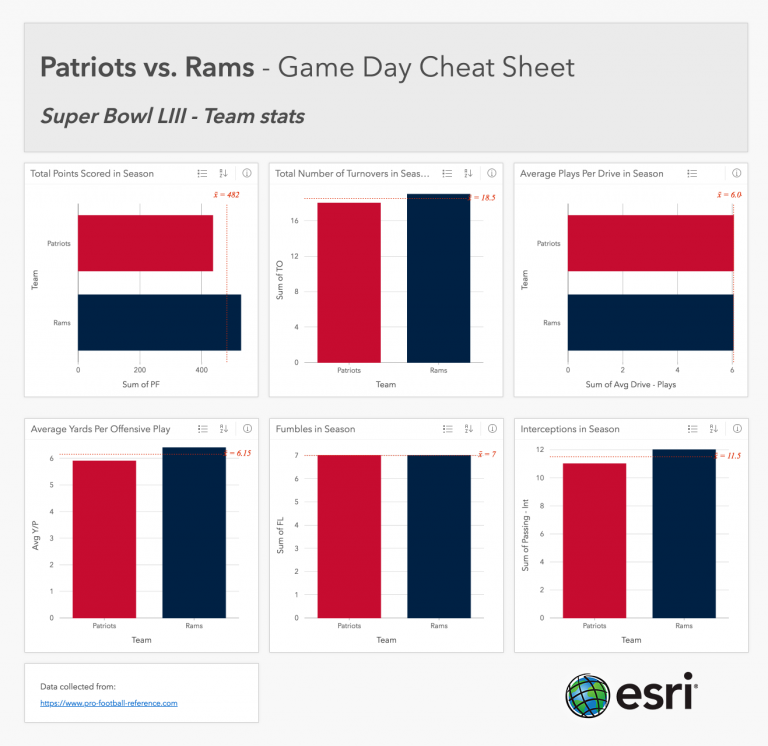
The big game is almost here. To prepare for another sports-trivia heavy Super Bowl weekend, I thought it would be fun to research the two championship teams and share my findings using pages created in Insights for ArcGIS. After all, not all of us are gifted in sports history, so here is a little cheat sheet, wink!
These links contain easy-on-the-brain LA Rams and New England Patriots sport statistics from this past season. My guess is if you study these numbers for a bit, you’ll be a rock star on game day. (Better yet, hint, hint just send these Insight’s page links to your phone this Sunday).
- Team highlights 2018 Season
- Team rushing 2018 Season
- Team passing 2018 Season
- Penalties and foul play in 2018
Chart Creation Process
In case you are curious about the workflow, here is the general process for creating these pages. With Insights for ArcGIS, non-spatial data is aggregated from www.pro-football-reference.com showing year-end statistics for the LA Rams and New England Patriots. The raw data is inputed via CSV format into Insights. Using team colors, each chart conveys who scores the most, passes the most, drops the ball the most and who has gotten the most penalties this past season.
Did I mention you can create charts using any color you want? For this project I apply official team colors down to the exact hex code.
The charts in the links also include additional sportsy stuff. Might you be interested what team has thrown the most touchdowns this past year? Hint, it’s not the team with Tom Brady. (see, Passing touchdowns in season card)

By all means, please do bring these links to your Super Bowl party. I hope a conversation arrises where you can pull up the data and settle a score! Especially, if someone says the Patriots have the most passing game touchdowns.
Do you like powerful visualizations? Do you like simple? Check out some of our Insights case studies. Don’t have access to Insights for ArcGIS, follow this link to get a free trial!


Commenting is not enabled for this article.