Technical session recordings from this year’s (virtual) Developer Summit are now available! This blog serves as a virtual tour for the ArcGIS API for JavaScript sessions this year.
Each year, we carefully design a technical session plan to showcase the latest capabilities of the API and best practices for building state-of-the-art, powerful, elegant, and meaningful web apps. Sessions are geared towards all levels of experience, from novice software tinkerers all the way to the most advanced developers. This year, we’ve categorized sessions into four groups:
1) API Fundamentals and Architecture
2) Visualization
3) Developer Tooling and Methodologies
4) Building a Great User Experience
Let’s dive into each of these categories, and then preview of some of the demos and concepts covered in select sessions.
API fundamentals, architecture
Whether you are new to the JavaScript API or an advanced developer, these sessions help to build your knowledge of API architecture, capabilities, and programming patterns.
ArcGIS API for JavaScript: Programming Patterns and API Fundamentals
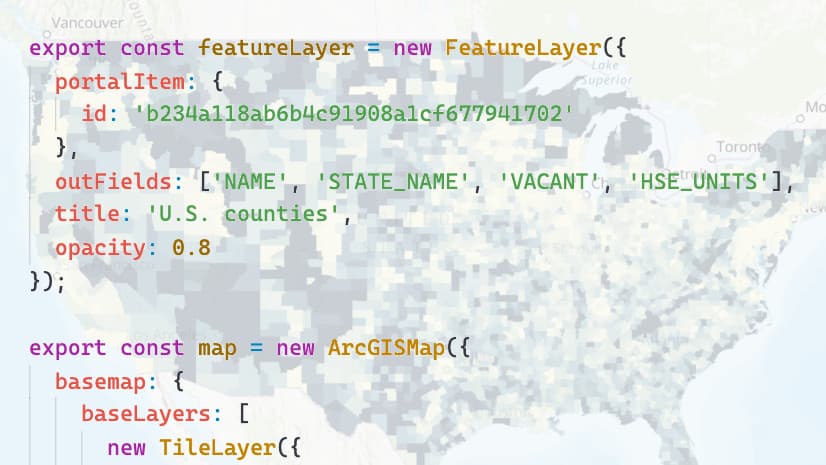
ArcGIS API for JavaScript: Working with Your Data Using the Feature Layer
ArcGIS API for JavaScript: Getting Started with Web Development
ArcGIS API for JavaScript: A Look under the Hood
ArcGIS API for JavaScript: What’s New
A Holistic Approach to Building 3D Web Apps
ArcGIS API for JavaScript: Fundamentals for Building 3D Web Apps
Check out the inside scoop on some of these sessions:
A look under the hood of the JavaScript API!
For the first time, we offered a session covering the underlying design of the JavaScript API and the technologies that power it – presented by two of our lead API developers. The ArcGIS API for JavaScript: A Look under the Hood session covers some of the key components the team developed to enable fast display of huge datasets, and then demonstrates how you can apply some of the same techniques to your own web apps. They have a variety of apps shared in this repo that illustrate concepts covered in the session.
For developers new to web development
If you are brand new to web development and/or developing with the API, you might want to start with ArcGIS API for JavaScript: Getting Started with Web Development. It covers the basics of setting up your development environment, fundamental debugging techniques, and tips for using the online SDK. It also covers patterns and practices for integration with your WebGIS and working with data and widgets. Find all of the example apps featured in this session in this repo.
Migrating from 3.x or simply new to the API
If you are coming up to speed on the API – either as someone transitioning from 3.x, or are simply new to the API all together – ArcGIS API for JavaScript Programming Patterns and API Fundamentals is a key session for you. It covers the basics of the ArcGIS API 4.x for JavaScript, for example, watching for property changes, working with collections, and lazy-loading data in your applications. It also covers details about maps, webmaps, layers, 2D and 3D views, UI, and widgets. Some of the demos shown are about widget view models, zoom and scale, and layer views.
For developers ready to start developing 3D web apps
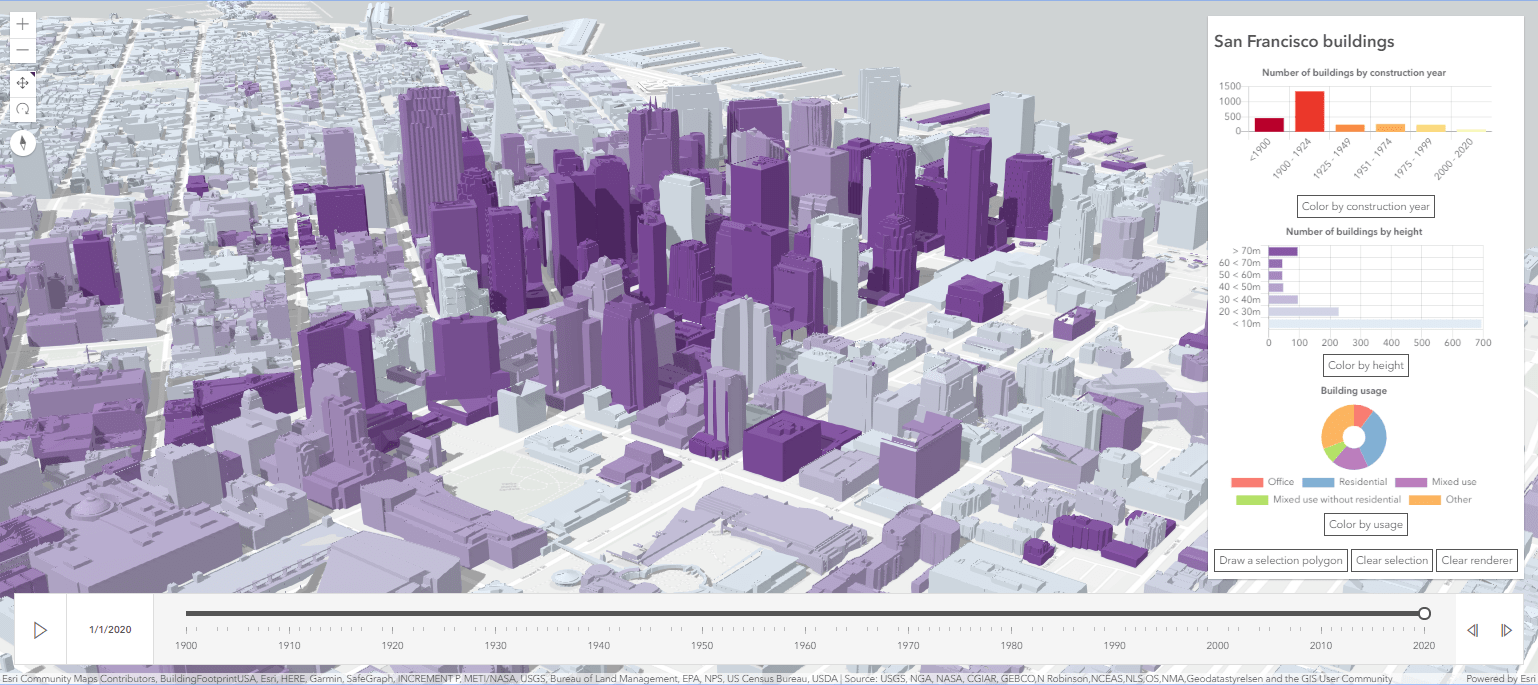
Are you ready to create your first 3D web app? Start with the A Holistic Approach to Building 3D Web Apps session. It is a practical session that covers the full workflow of authoring web scenes in ArcGIS Online and Enterprise all the way to building interactive 3D web apps. Learn the concepts behind creating this San Francisco building explorer, an interactive application to explore buildings in a city by construction date, height, and building usage. The ArcGIS API for JavaScript: Fundamentals for Building 3D Web Apps session then goes a bit deeper by taking you through the fundamental 3D building blocks of the API: SceneView, 2D and 3D layers, terrain, and symbology.
Visualization
Using the API, you can build web apps that allow experts and novices alike to explore and understand their data faster, making better maps with more confidence and less effort. If you want to learn about the variety of techniques and capabilities available for creating stunning visualizations in 2D and 3D, there are plenty of sessions that might pique your interest.
ArcGIS API for JavaScript: 2D Visualization
Best Practices for Building Web Apps that Visualize Large Datasets
Customizing and Styling Vector Basemaps
ArcGIS API for JavaScript: Practical Guide for Building a 3D Web App from 2D Data
ArcGIS API for JavaScript: Building Custom Visualizations Using WebGL in 2D Map Views
ArcGIS API for JavaScript: Using Arcade with Your Apps
Check out the inside scoop on some of these sessions:
You don’t need to be a cartographer to create beautiful, meaningful maps
The ArcGIS API for JavaScript: 2D Visualization session demonstrates how to create a progression of multiple visualizations with the same dataset. It highlights what each visualizes well and what they don’t visualize well. It uses Arcade expressions and visual variables to give you different perspectives of the data. Here is one of the apps demonstrated; the full repo is here.
Create meaningful visualizations of large datasets – with fast performance
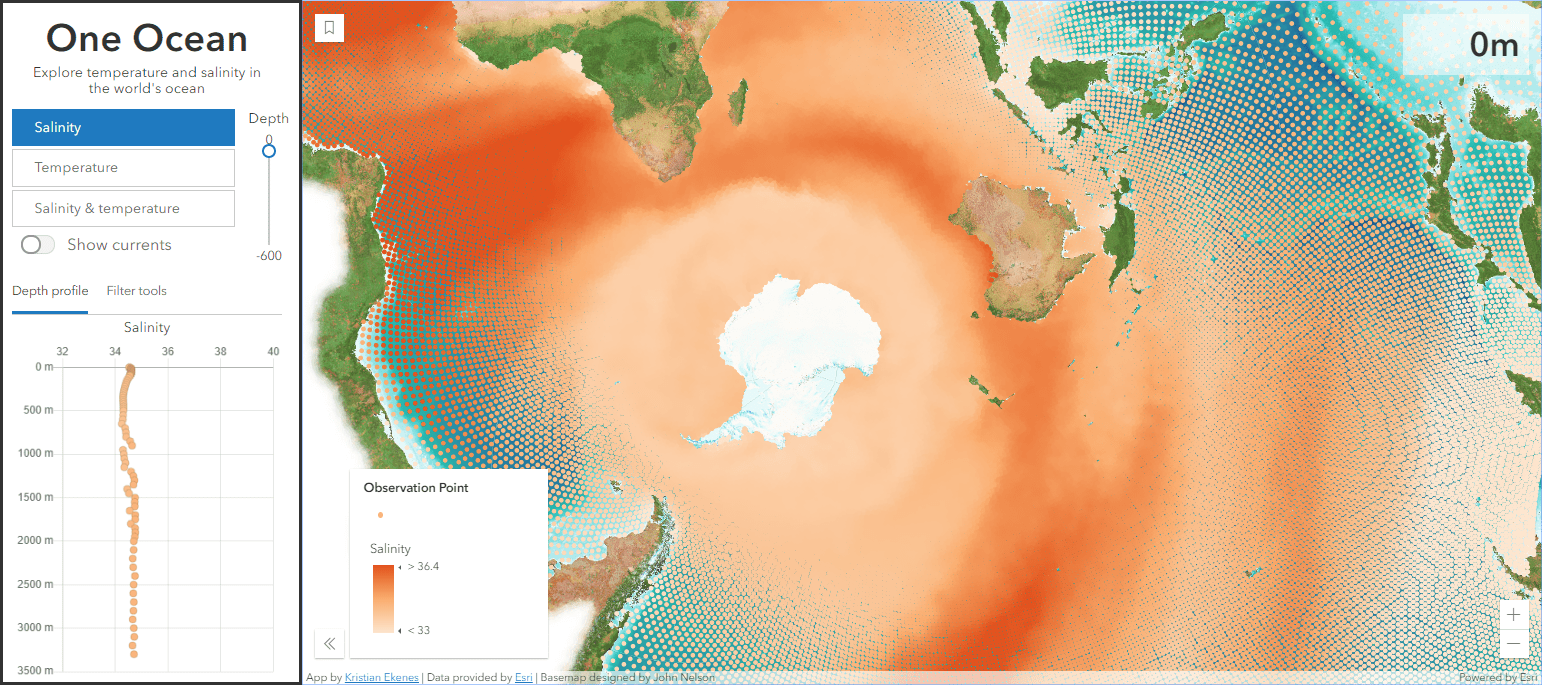
The Best Practices for Building Web Apps that Visualize Large Datasets session describes the process for preparing the data in the One Ocean app so it can be effectively rendered and explored in the browser. The data started from 52 million points (4 GB) and resulted in 85,000 points with hundreds of attributes (280 MB) after processing by the developer and the ArcGIS platform. The full repo is here.
Do you want to build a 3D web app but only have 2D data?
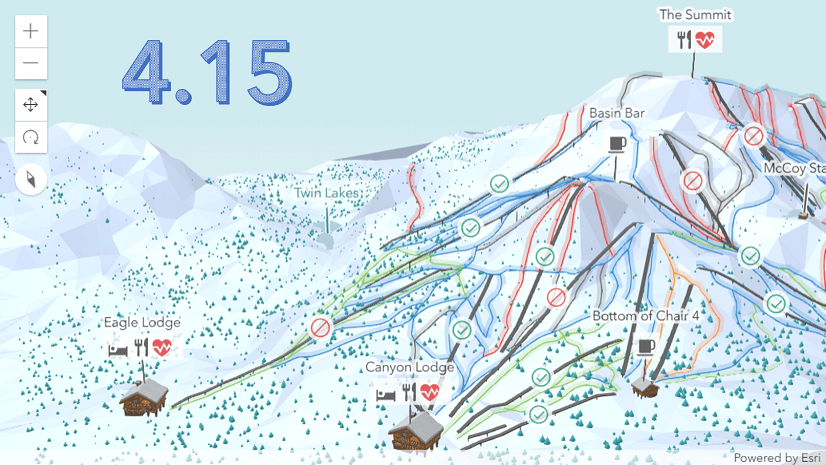
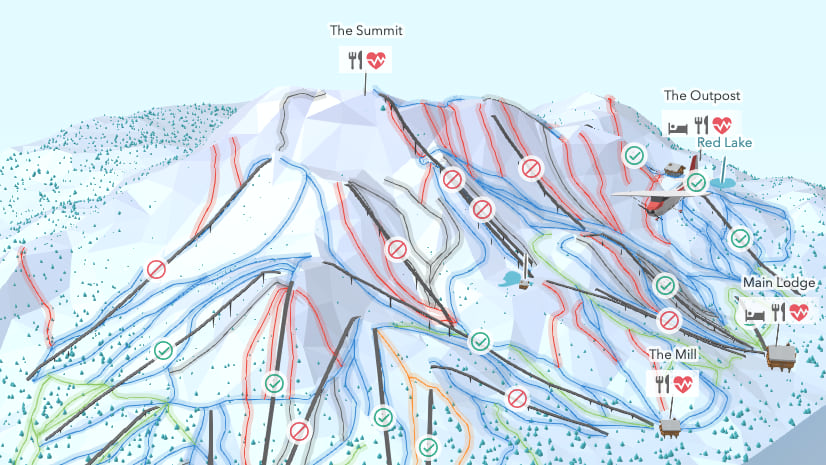
In the Practical Guide for Building a 3D Web App from 2D Data session, Raluca and Kristian show four examples of 3D maps built with 2D data and Esri’s world elevation service. Among others, this talk explains the main API features for building a 3D ski resort map of Mammoth in a low poly style. In another example, they show how to visualize trees with real world sizes using a 3D model provided out-of-the-box in the API. The underlying data is a 2D point FeatureLayer with attributes for height, width, and tree species. You don’t need to create your own complicated 3D model; just use what the API already provides. The full repo is here.
Use Arcade to perform powerful client-side calculations for visualization, popups, and labeling
Sometimes simple calculations can provide more insight than field values when creating data-driven visualizations. The ArcGIS API for JavaScript: Using Arcade with your Apps session covers techniques for developing your skills and applying Arcade in your apps. For example, this app has a popup that uses an Arcade expression to compare an attribute value for the clicked/highlighted feature to the same value of all of its neighbors (the polygons that share a boundary with it). This is possible using Arcade feature sets in conjunction with the geometry engine. The full repo is here.
Developer tooling & methodologies
These sessions are all about making coding easier and faster as you build more complex and scalable applications. Watch these sessions to gain insight on topics such as integrating with 3rd party JavaScript Frameworks, architecting for enterprise deployment, or learning debugging tips and tricks.
ArcGIS API for JavaScript: Using Frameworks
ArcGIS API for JavaScript: Using React and Webpack
ArcGIS API for JavaScript: Using TypeScript
ArcGIS API for JavaScript: Building Progressive Web Apps
ArcGIS API for JavaScript: Building Apps with Angular
Javascript Applications for the Enterprise: Building for Production
Javascript Applications for the Enterprise: Test More, Work Less

Check out the inside scoop on some of these sessions:
Use the API with a 3rd party framework
We have seen growing interest to integrate the API with 3rd party frameworks for building scalable apps. The ArcGIS API for JavaScript: Using Frameworks session covers the frameworks that are the most popular in our developer community. Walk-through examples showcase integration with Angular (in this sample apps directory you will find a number of implementations of the JS API in Angular applications), React, Svelte, and Vue.
Cool kids use webpack and React
If you want to learn how you can use React to build fast and responsive applications that uses modern tooling and techniques, watch ArcGIS API for JavaScript: Using Webpack and React. Rene and Tom discuss concepts for building this Nearby app which uses React and webpack, and using esri-loader with webpack for your React applications.
Build a great user experience
Building great apps doesn’t end once the map and features have been added. Creating and designing a great experience for your end users is key to maximizing adoption and satisfaction of your applications.
ArcGIS API for JavaScript: Web Editing in 2D and 3D
ArcGIS API for JavaScript: Customizing the JavaScript Widgets
ArcGIS API for JavaScript: Building Your Own Widget
ArcGIS API for JavaScript: Client-side Mapping and Analytics
Accessible Web Mapping Apps: ARIA, WCAG and 508 Compliance
ArcGIS API for JavaScript: Create Participatory 3D Web Apps Using BIM- and Editing Capabilities
Check out the inside scoop on some of these sessions
Use client-side analytics to build interactive apps
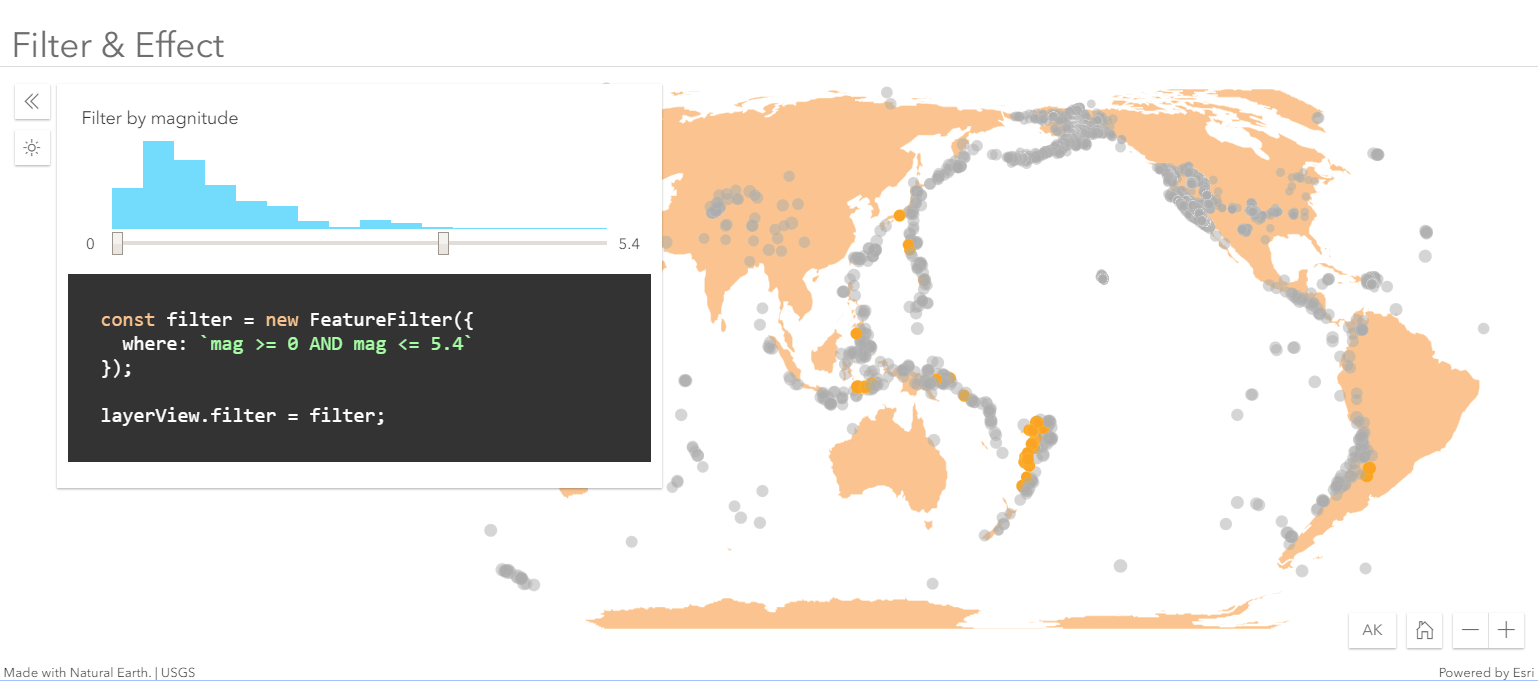
One of the most powerful aspects of the API is the ability to perform client-side analytics such as querying, statistics, filtering, and geometry operations. The ArcGIS API for JavaScript: Client-side Mapping and Analytics session covers the core programming patterns for building client-side tech with demos such as client-side filters, filters and effects – a look at a century of earthquakes, and measuring how far the Mars Curiosity is from Opportunity.
Feature layer editing in 2D or 3D!
Last year, we released the Editor widget which allows you to incorporate the full end-to-end editing workflow with minimal code. With version 4.15, you can now edit feature layers in 3D scenes as well! The ArcGIS API for JavaScript: Web Editing in 2D and 3D session covers both 2D and 3D editing – from the simplest scenarios to apps with more advanced, custom workflows. Check out this cool 3D app that they use to demonstrate editing in 3D scenes (click on the camera or ball to move around the view point). More demos from this session are here.
Accessible web mapping
Many developers choose to build apps that meet accessibility standards. Accessible apps benefit more than people with disabilities; in fact, they make your app more usable in more places. For example, accessible apps make it easier for someone to use your app while on a train ride with their child in the other hand. Accessible Web Mapping Apps: ARIA, WCAG and 508 Compliance covers the APIs built-in capabilities for accessibility and other practical tips for building accessible apps.
There’s a lot more…
This blog was an overview of many of the web development-focused sessions, but there are many more available that span a variety of topics. The full 2020 Developer Summit technical session playlist is available on YouTube.
We sure missed seeing you in person this year, but we hope that these recordings, along with the resources we have shared, assist you with your work. Thank you all for your incredible work.

This is a great summary of all the related recordings. thanks Julie