In a previous blog post Raluca describes how low poly is a style for 3D maps using abstraction, sharp edges and artistic design. Let’s have a look how we can apply such techniques to a scene using the ArcGIS API for JavaScript.
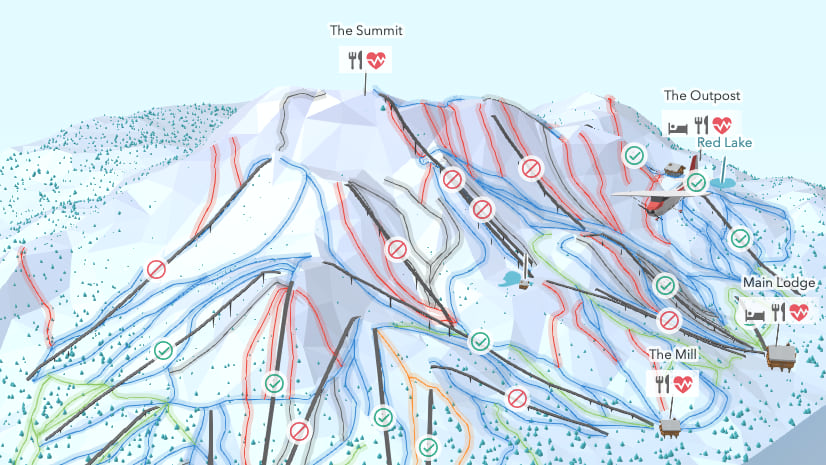
As a playground we chose Mammoth Mountain, a ski resort in Northern California. It’s one example of how well the low poly style works to emphasize on ski slopes, lifts and point of interests, while simplifying the terrain and exaggerating the size of objects. The source code together with a live demo are available online.
In this first of two blogs we will focus on creating the terrain. It lays out the foundation for the look and feel of our sample of Mammoth Mountain. We will highlight the iconic shape of the mountains by generating a triangulated irregular network (TIN) directly in the browser.
Step 1: Irregular grid
Once we have defined the extent in Web Mercator, the first step of creating a TIN is placing the vertices at which we want to sample the elevation. Before creating an irregular grid, we will start by evenly distributing vertices within the extent. We decided to use an average distance of 200 meters, resulting in roughly 1.5k vertices.
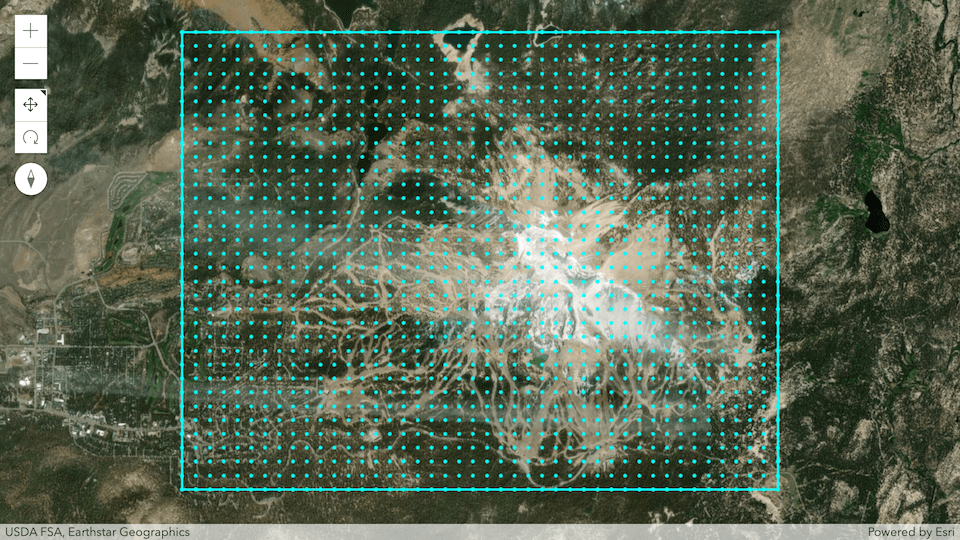
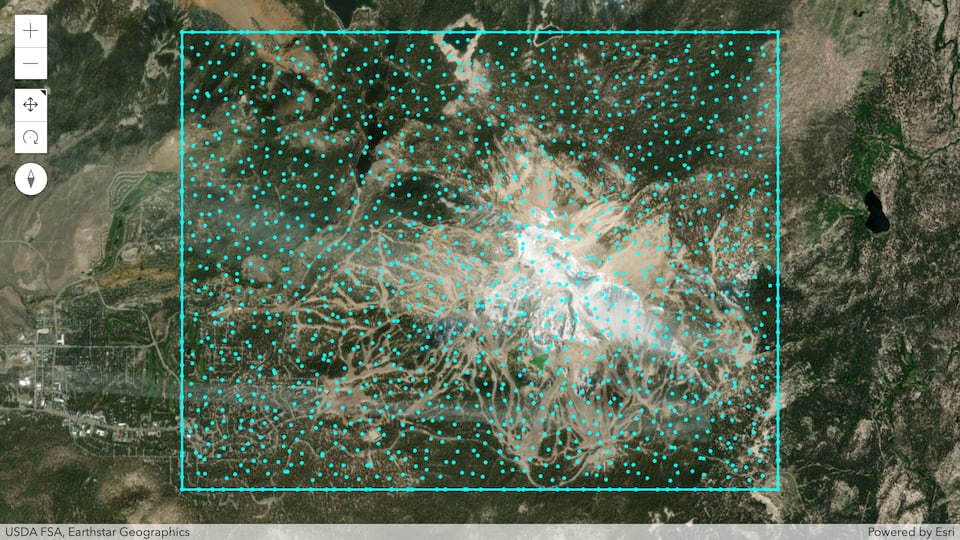
We introduce irregularity by randomly deviating each of the vertices within their grid cell. In addition, we reduce the deviation range to make sure the points always keep a certain distance to each other.
A side note on randomness: in our app we replaced Math.random() with a library called seedrandom.js. It also generates floating-point numbers between 0 and less than 1, but allows us to define a seed so we always receive the same numbers each time we run the app. It has the advantage that we always end up with the same pattern. This is helpful when debugging and as we will see later, also required for aligning the thematic data along the terrain. While this doesn’t sound random at all anymore it works perfectly for our use case. In the end we just want our vertices to be placed irregularly.
Step 2: Triangulation
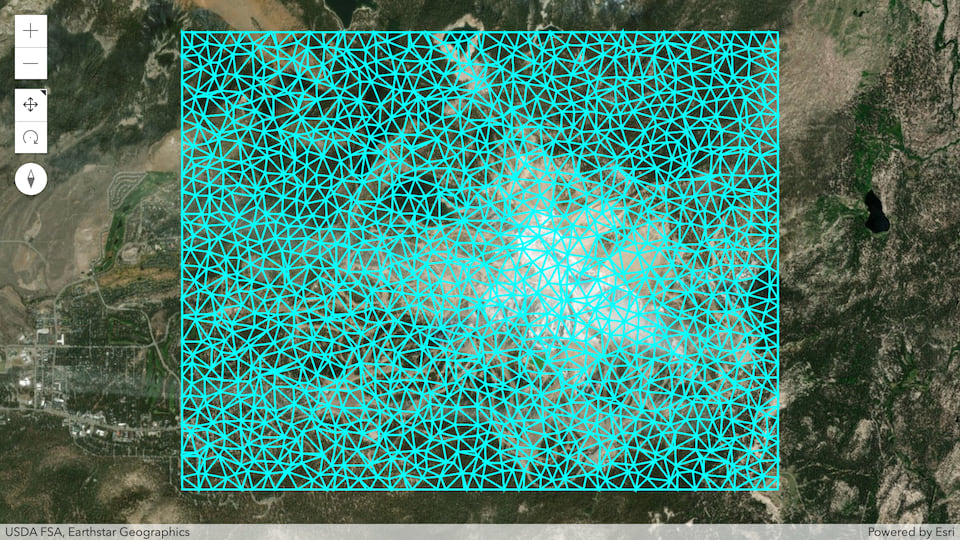
The next step in creating a TIN is connecting all vertices so that the extent is completely covered with adjacent triangles. An algorithm that solves this problem is called Delaunay triangulation.
You can find several JavaScript implementations of it online and we will also rely on the library Delaunator created by Vladimir Agafonkin (check out his GitHub profile for a range of spatial libraries). Delaunator is very efficient but assumes that the input vertices represent a convex area, which is the case for our rectangular extent.
const delaunay = new Delaunator(vertices);
const triangles = delaunay.triangles;
Note how the outer edge is now made up of triangle faces but still perfectly straight. That’s because we only deviated the vertex coordinates inside and along the extent.
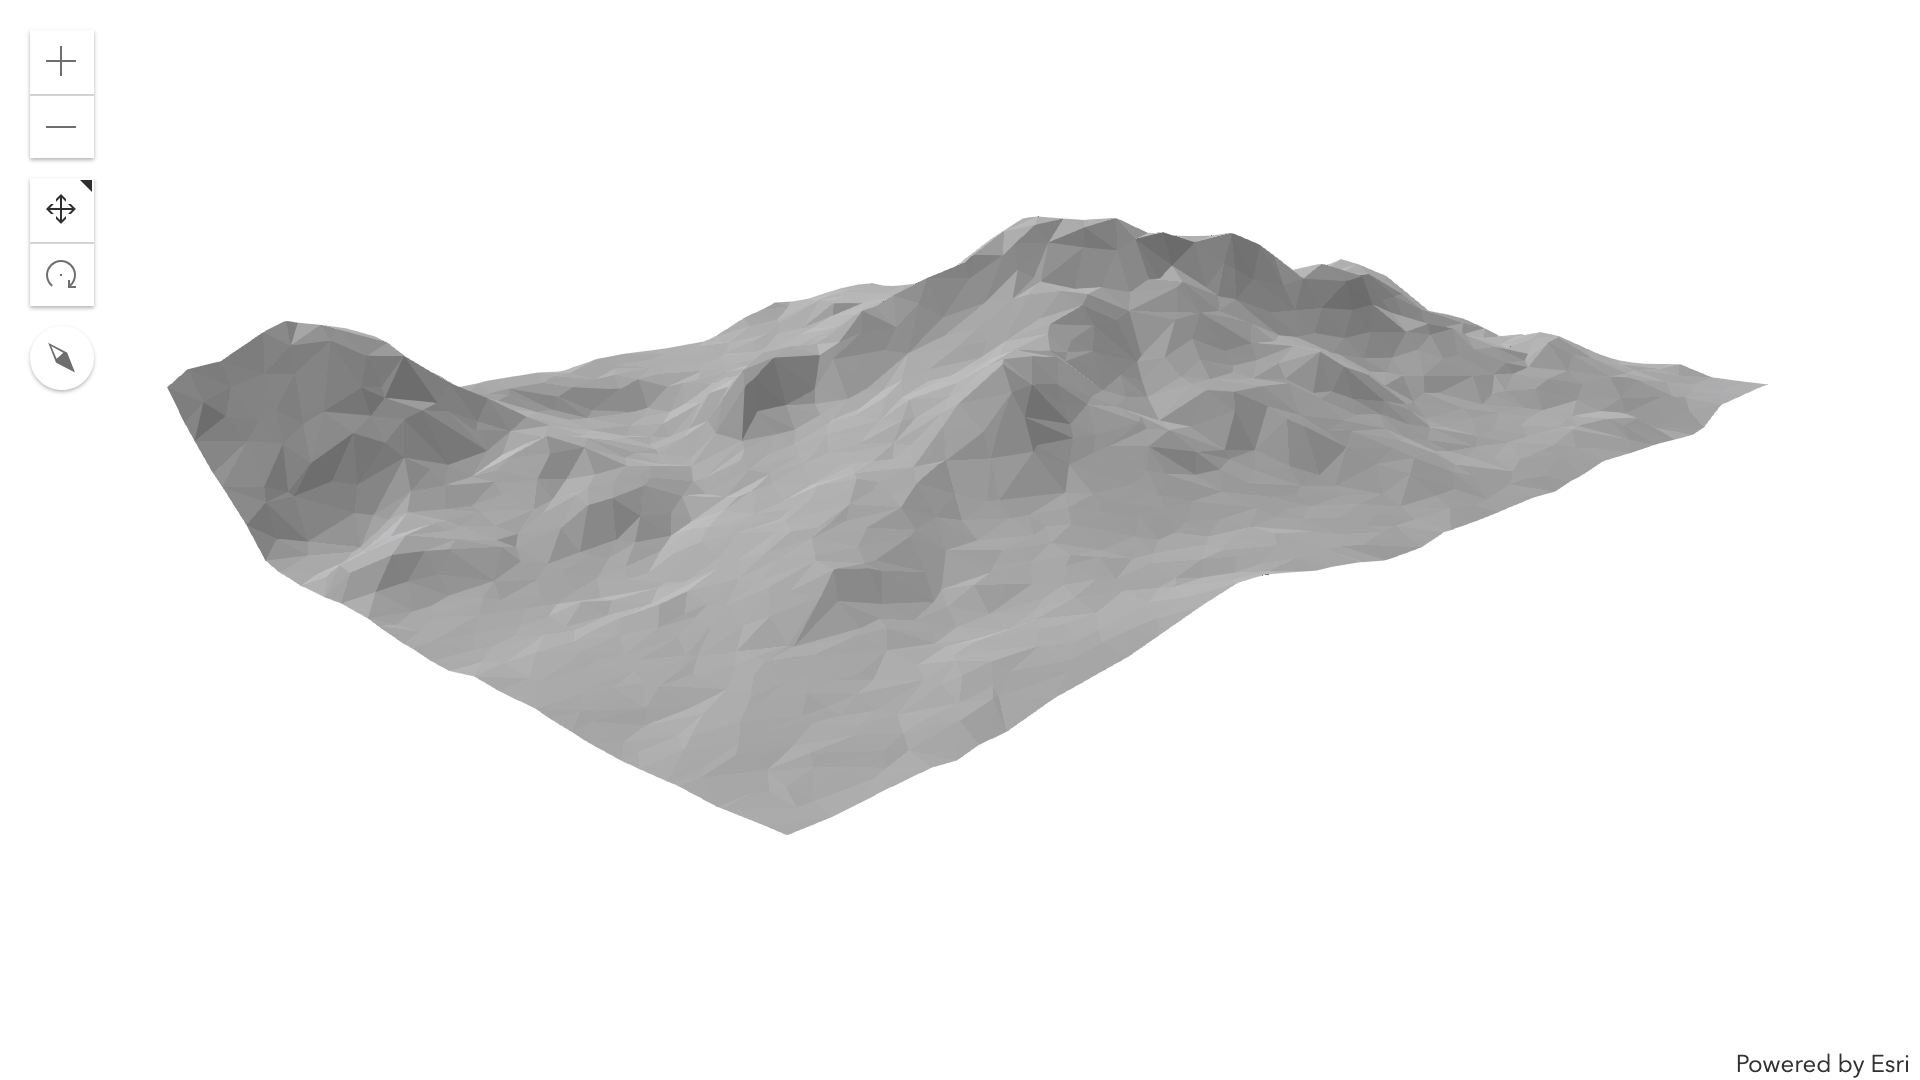
Step 3: Elevate the triangles
At this point we are ready to create a 3D visualization of our TIN. All we need to do is add a z-component to each of the triangle vertices. Using the ArcGIS API for JavaScript’s ElevationLayer.queryElevation() method we can obtain all required real-world heights with a single request.
Visualizing client-side 3D shapes is where the Mesh class of the JavaScript API comes in. It’s a mere wrapper around simple primitives made up of vertices and triangles before they are passed to the graphics card for rendering. As this is what we have been producing so far, we can directly use them to create a new Mesh geometry.
new Mesh({
  components: [
    new MeshComponent({
      faces: triangles,
      shading: "flat",
    })
  ],
  vertexAttributes: {
    position: vertices,
  },
  spatialReference: SpatialReference.WebMercator
});
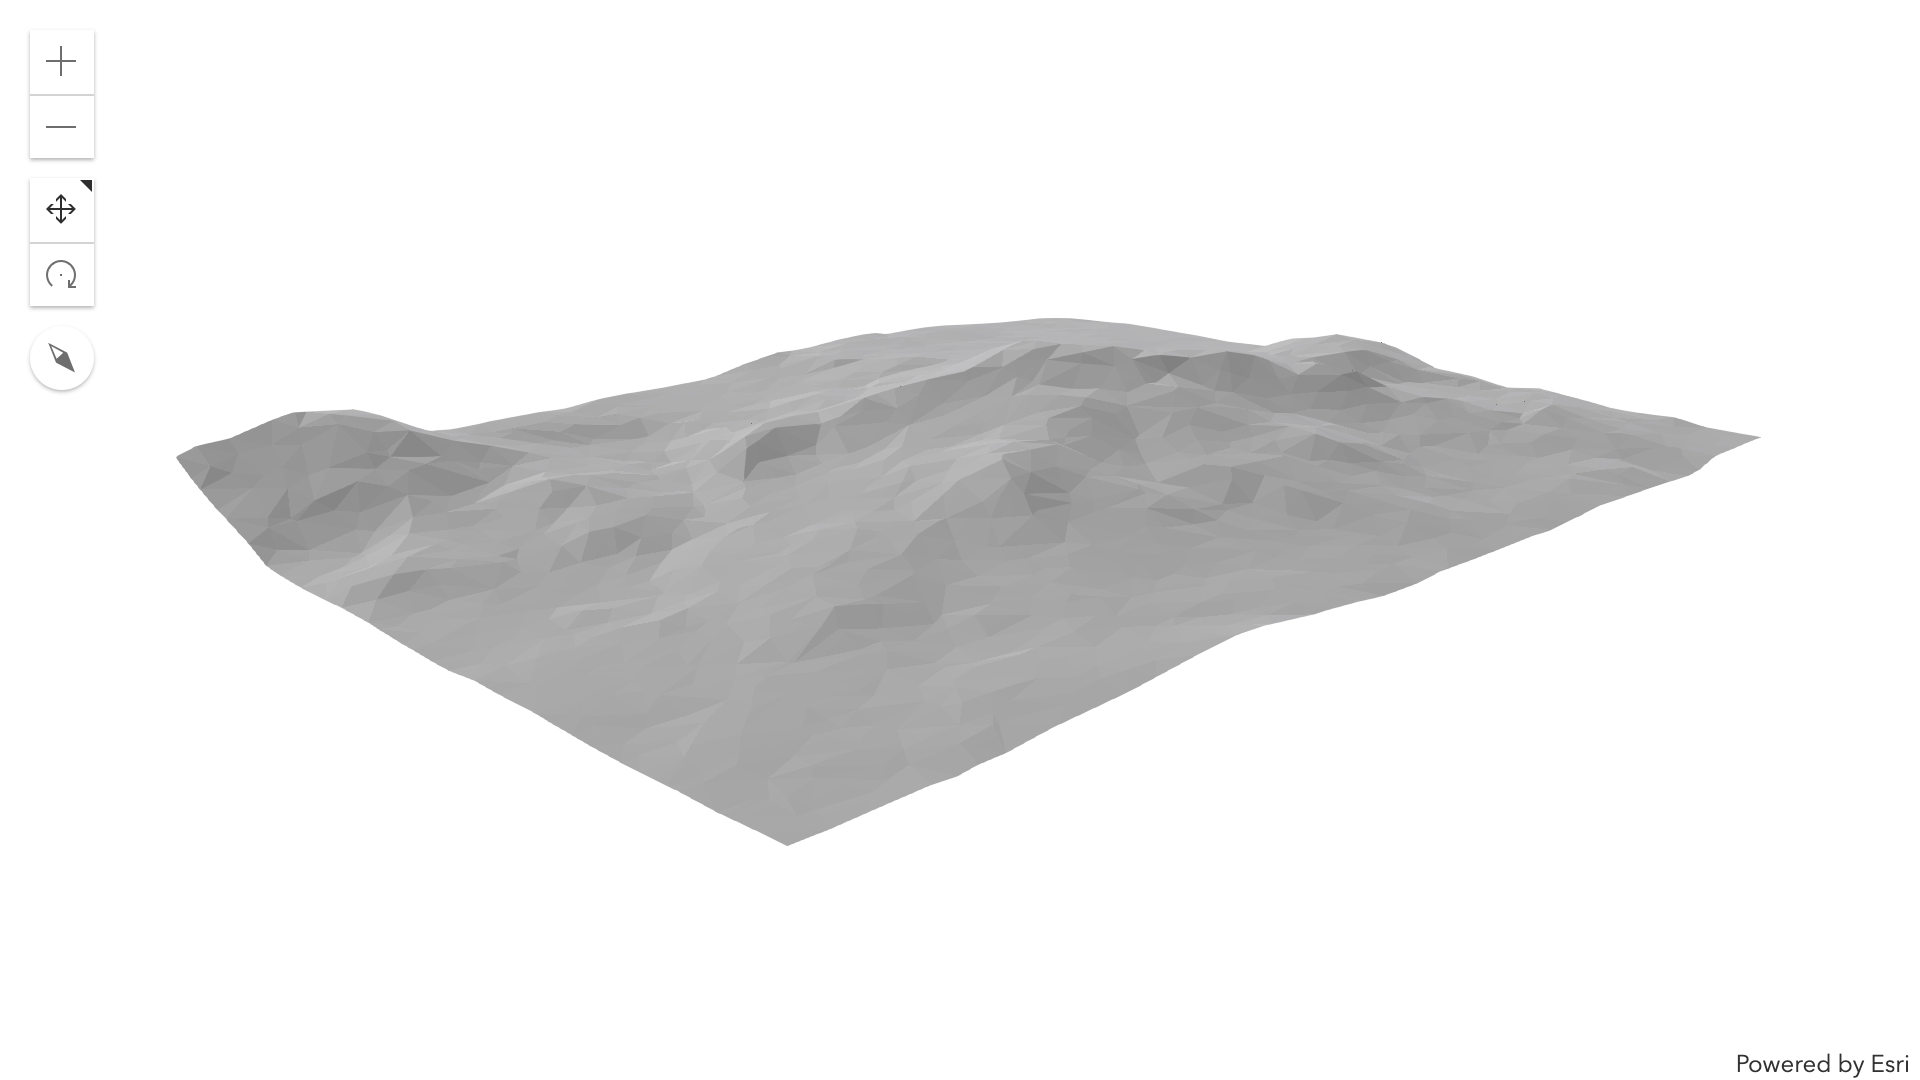
So far we have been applying real-world heights for our 3D terrain. In order to emphasize the shape of the mountain we can double the values returned by the elevation query, exaggerating the final terrain.
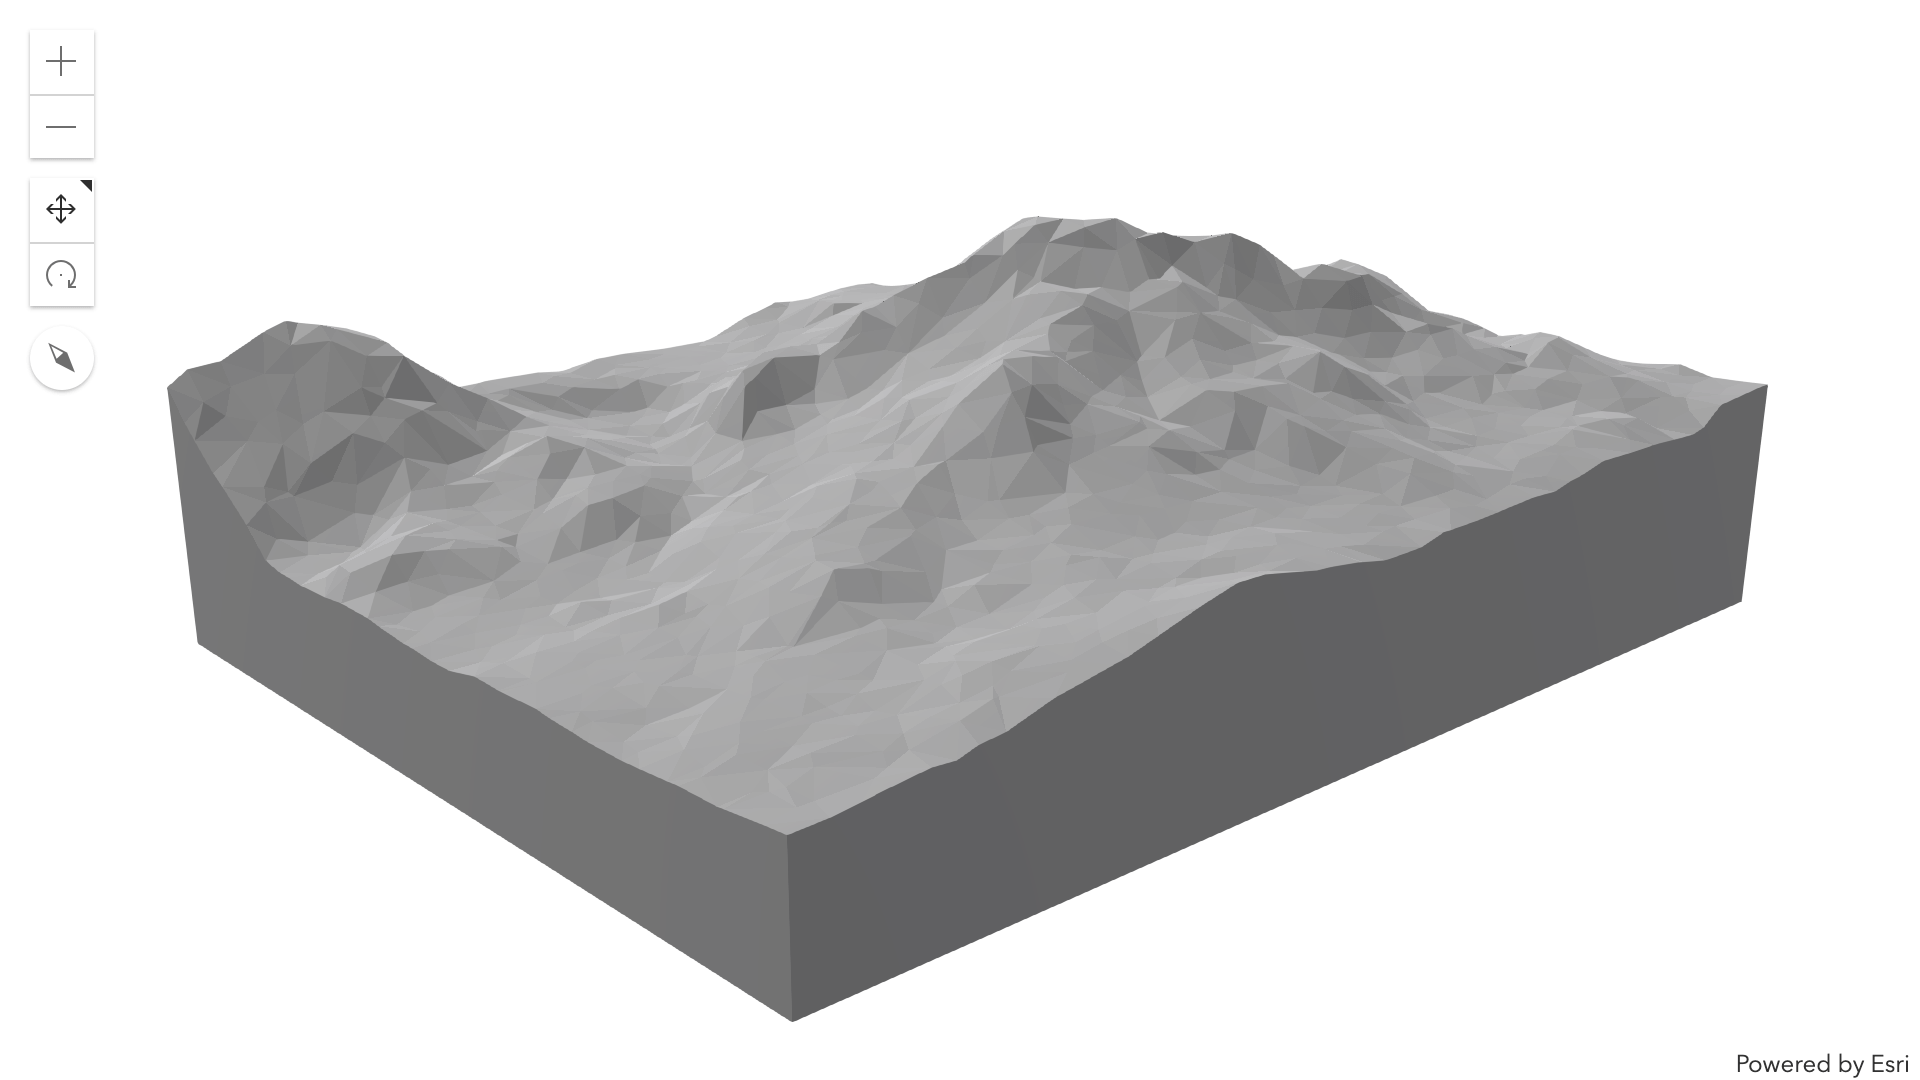
Step 4: Add foundation
To give the low poly map a volumetric touch we added a foundation to the terrain. It is in fact represented by a wall connecting each of the border vertices with another vertex at a predefined height. Taking the exaggeration into account we placed the bottom vertices at a height of 4000 meters.
We created the wall by combining four neighboring vertices using two triangles. As previously done with the terrain, the additional vertices and triangles are passed into the same Mesh geometry using an additional MeshComponent.
Step 5: Colors and materials
The Mesh class provides various properties affecting how the 3D surface is rendered. Besides simple color values, it supports concepts commonly used in computer graphics, such as materials, texture- and normal maps. Thanks to them we can make our 3D terrain look more like a winter landscape.
First we add a color value for each vertex of the mesh. The elevation values we previously queried are used to interpolate between predefined colors. The resulting color values are also passed to the Mesh class using an array and make up the fill color for each triangle.
new Mesh({
  components: [
    new MeshComponent({
      faces: triangles,
      shading: "flat",
      material: new MeshMaterialMetallicRoughness({
         metallic: 0.5,
         roughness: 0.8,
      })
    })
  ],
  vertexAttributes: {
    position: vertices,
    color: colorValues,
  },
  spatialReference: SpatialReference.WebMercator
});
Besides color we also make use of material properties defined on the mesh component. A new type called MeshMaterialMetallicRoughness supports settings for physical based rendering (PBR), allowing us to model surfaces with metal- or plastic characteristics.
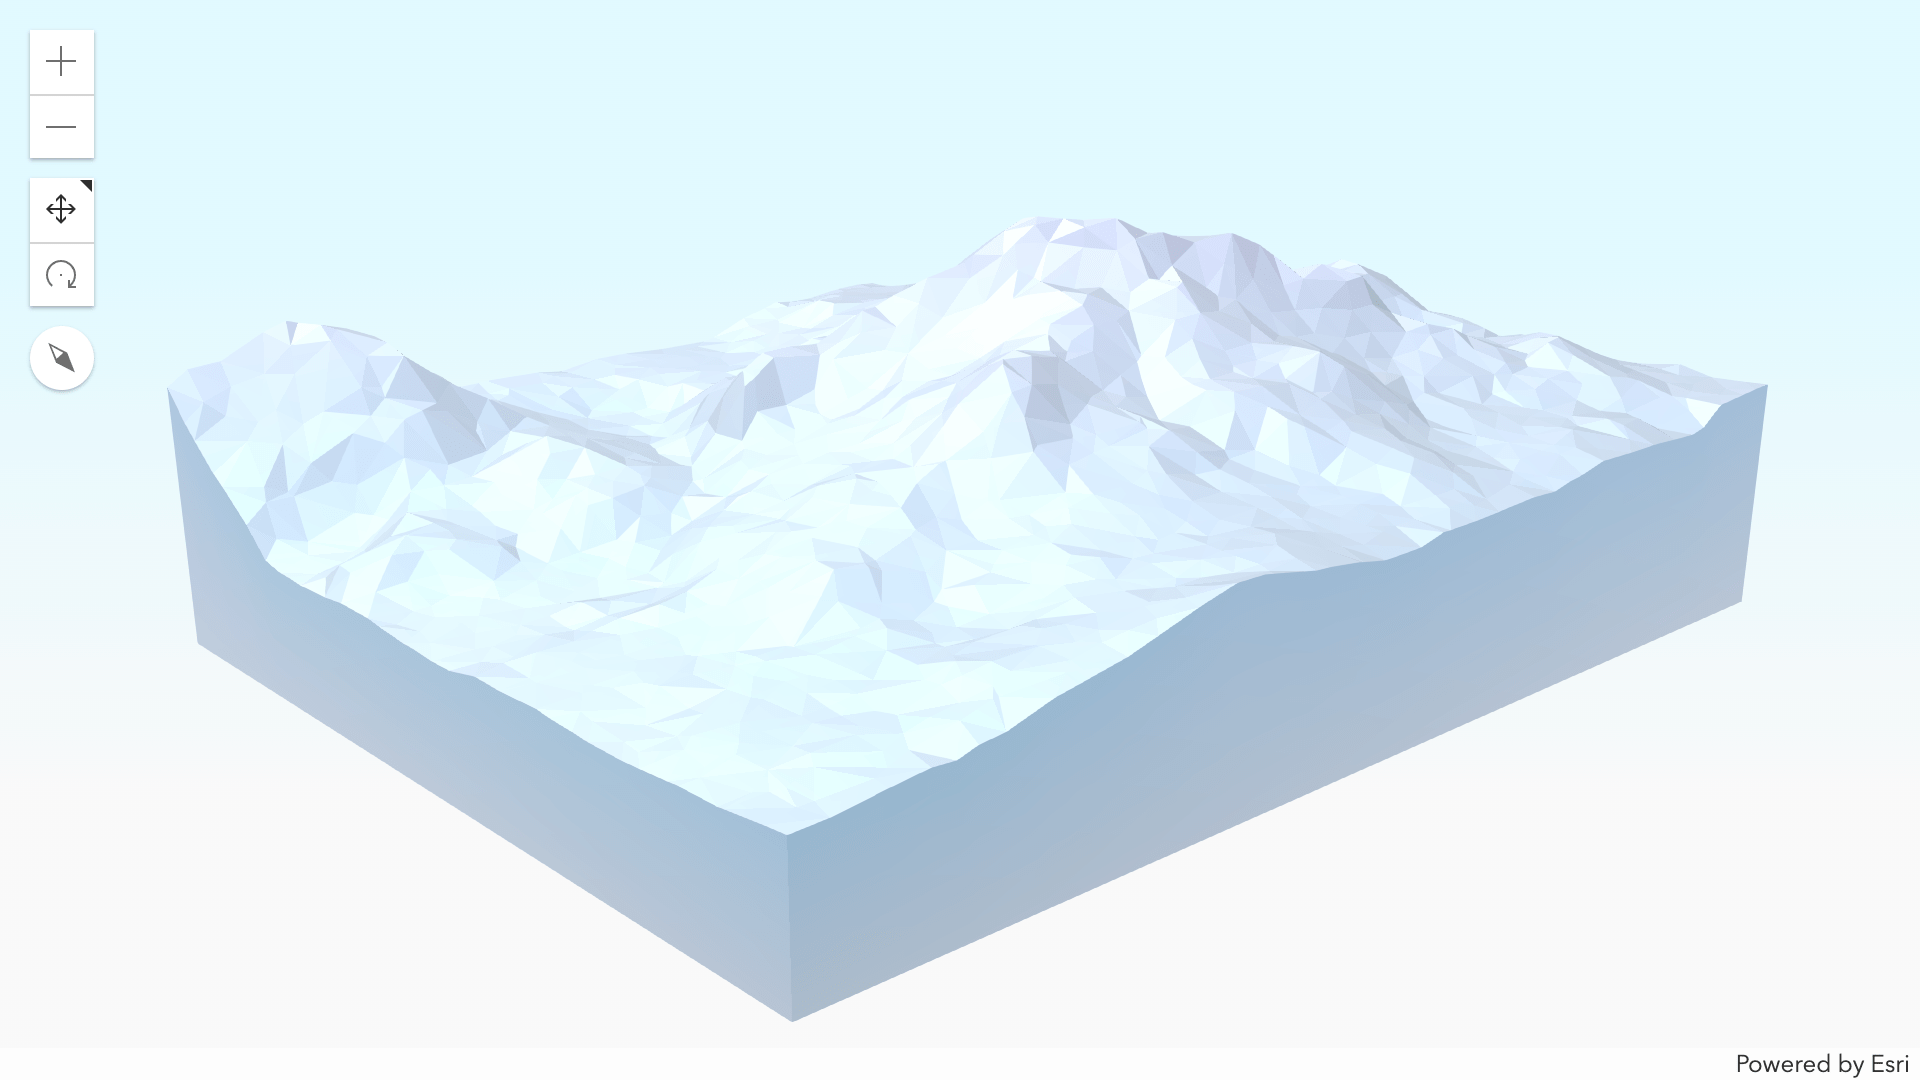
Thanks to the added effects our terrain now looks like it was truly chiseled out from an ice block. Especially when navigating in the scene you can see the specular reflections added by the metallic material.
This is it for the first part! In the second part of this blog Raluca will finish our winter wonderland adding the thematic data: ski lifts, slopes and points of interests.


In Step 4 you describe, “…represented by a wall connecting each of the border vertices with another vertex at a predefined height…We created the wall by combining four neighboring vertices using two triangles.”
Does this mean that you have to create a vertex at 4000 for every vertex along the edge, or does it mean you have to create the vertex at 4000 for each of the four corner vertices? I have been working on a similar project that would replicate this layout for 10 different locations and this workflow seems like a great solution.