Looking for inspiration to build production-ready web mapping apps? Start here.
We’ve refreshed our Showcase page with new sample applications that demonstrate how to build custom web mapping apps with ArcGIS Maps SDK for JavaScript. Explore live apps, inspect the source code, and see how the capabilities of the SDK work together in real-world workflows. Learn best practices, build with web components, and pair the SDK with Calcite Design System to create scalable, accessible applications.
Let’s take a quick tour of the Showcase Page
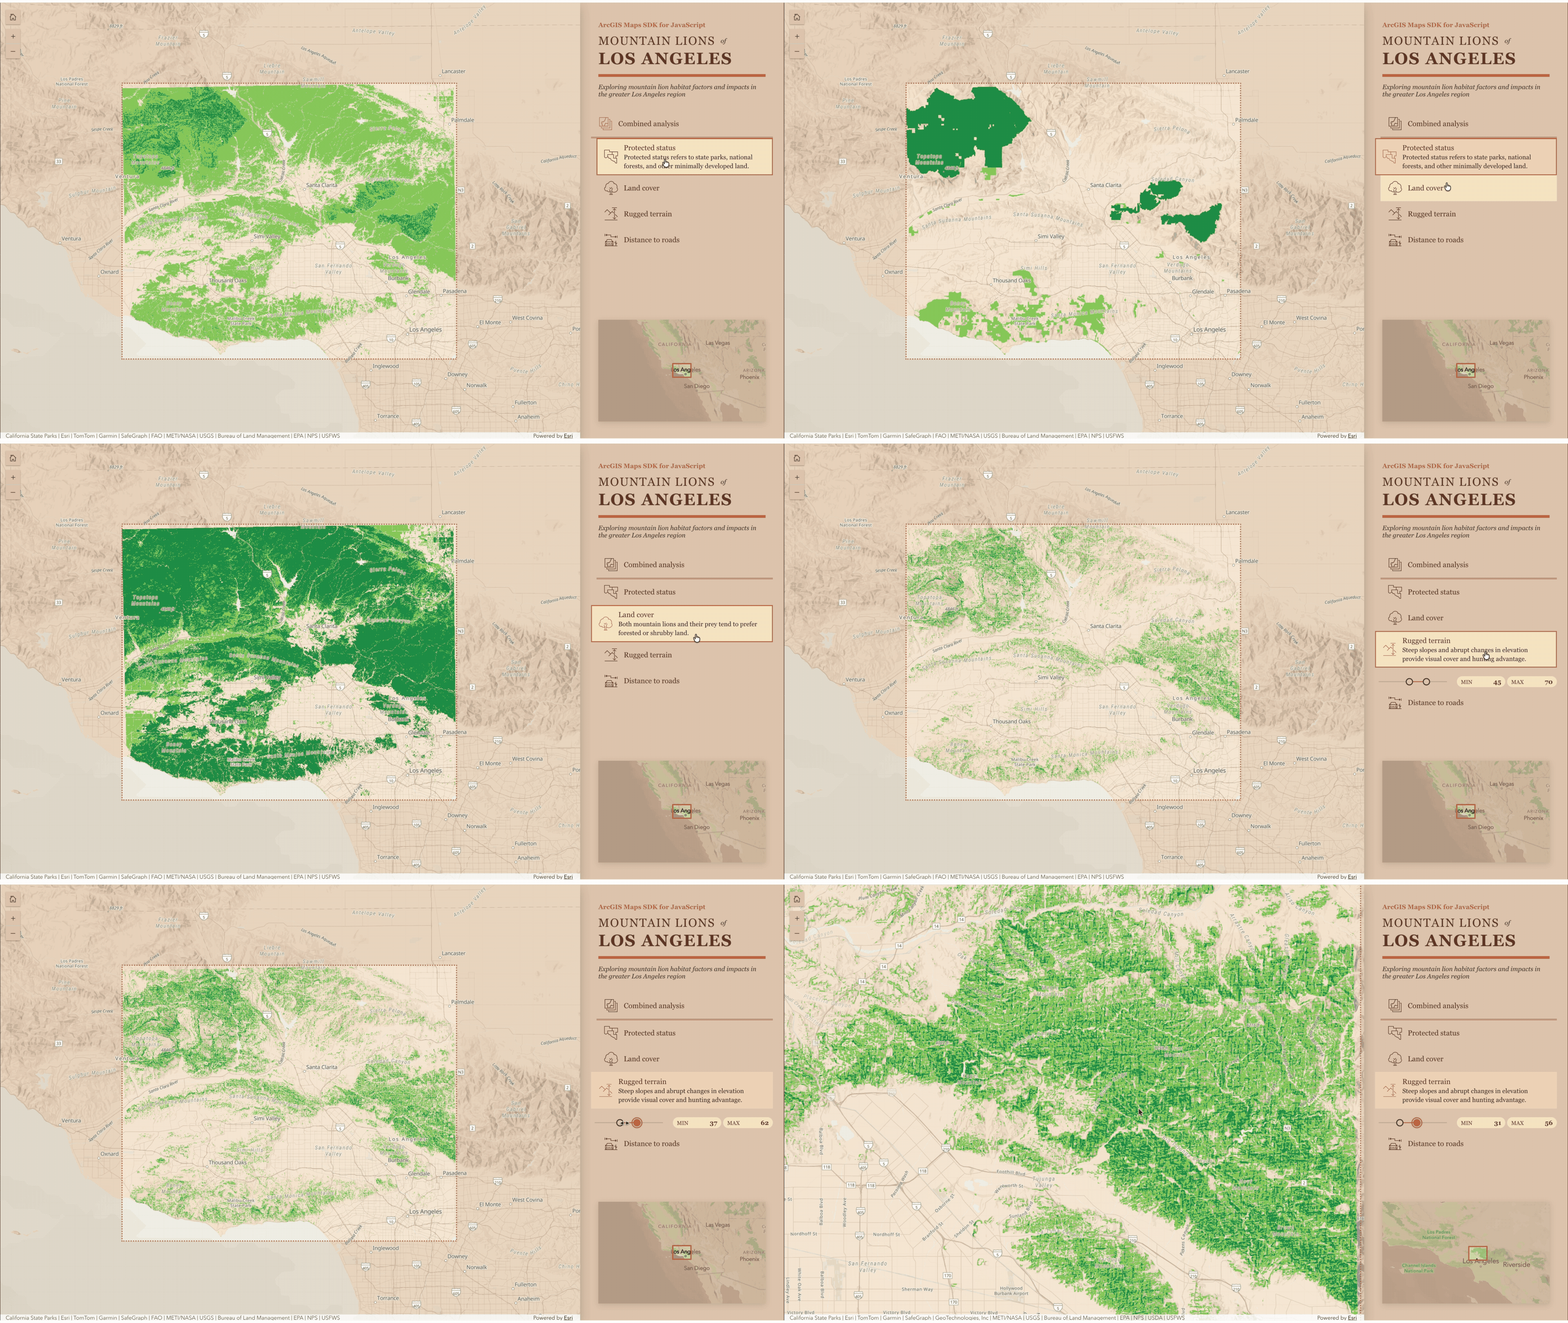
Mountain Lion Habitat Analysis
Analyze and visualize potential mountain lion habitat suitability based on multiple factors using client-side raster analysis. Navigate the map to explore the region and better understand habitat patterns. Adjust raster function parameters with the side panel sliders to see how they affect habitat suitability.
How it is built: This app leverages imagery layers, client-side raster analysis, inset maps, and Calcite Design System components to evaluate habitat suitability and visualize environmental factors interactively.
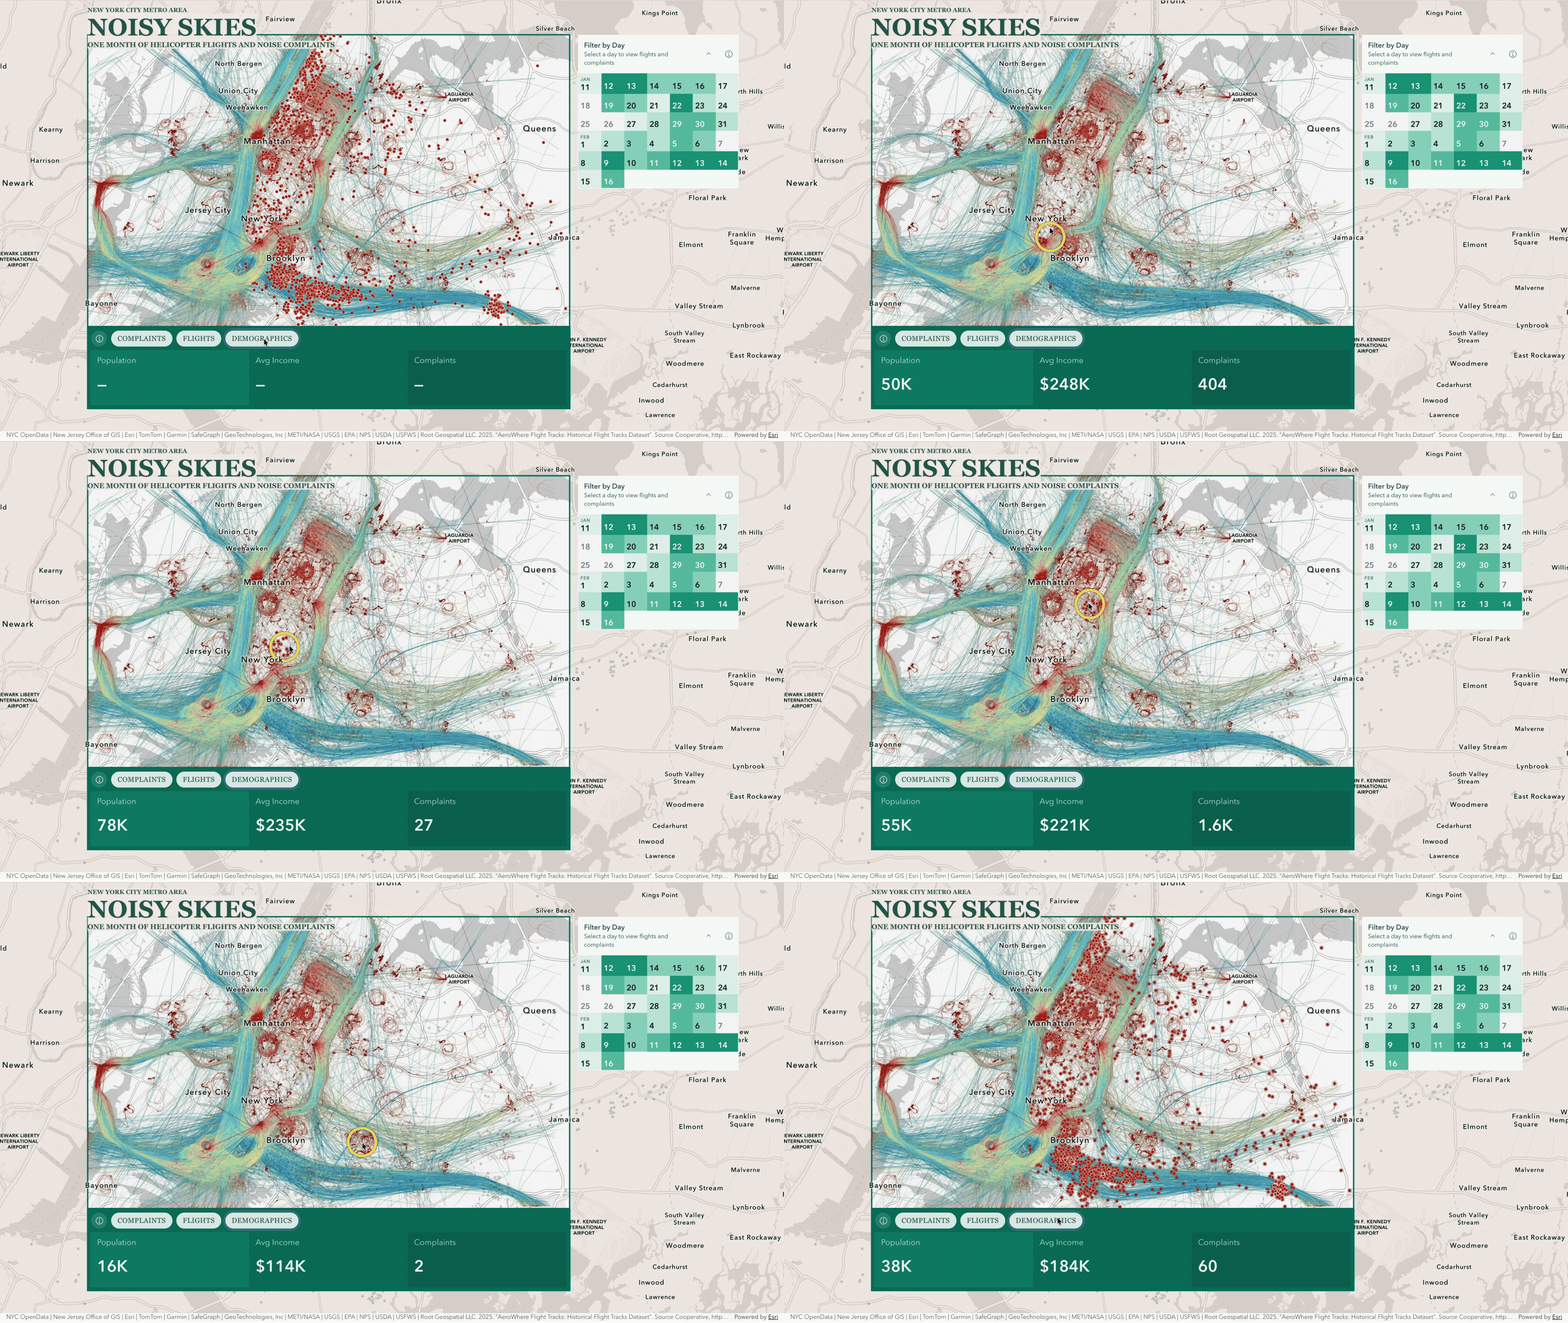
NYC Helicopter Noise Explorer
This app provides interactive analytics, charts, map effects, and demographic context for NYC noise complaints and helicopter activity. Explore the data through neighborhood lookup, calendar-based filtering, a noise complaint table, and more.
How it is built: The app leverages the SDK’s data-driven visualizations, client-side querying, interactive charts, and feature table capabilities to explore relationships between flight activity and noise complaints.
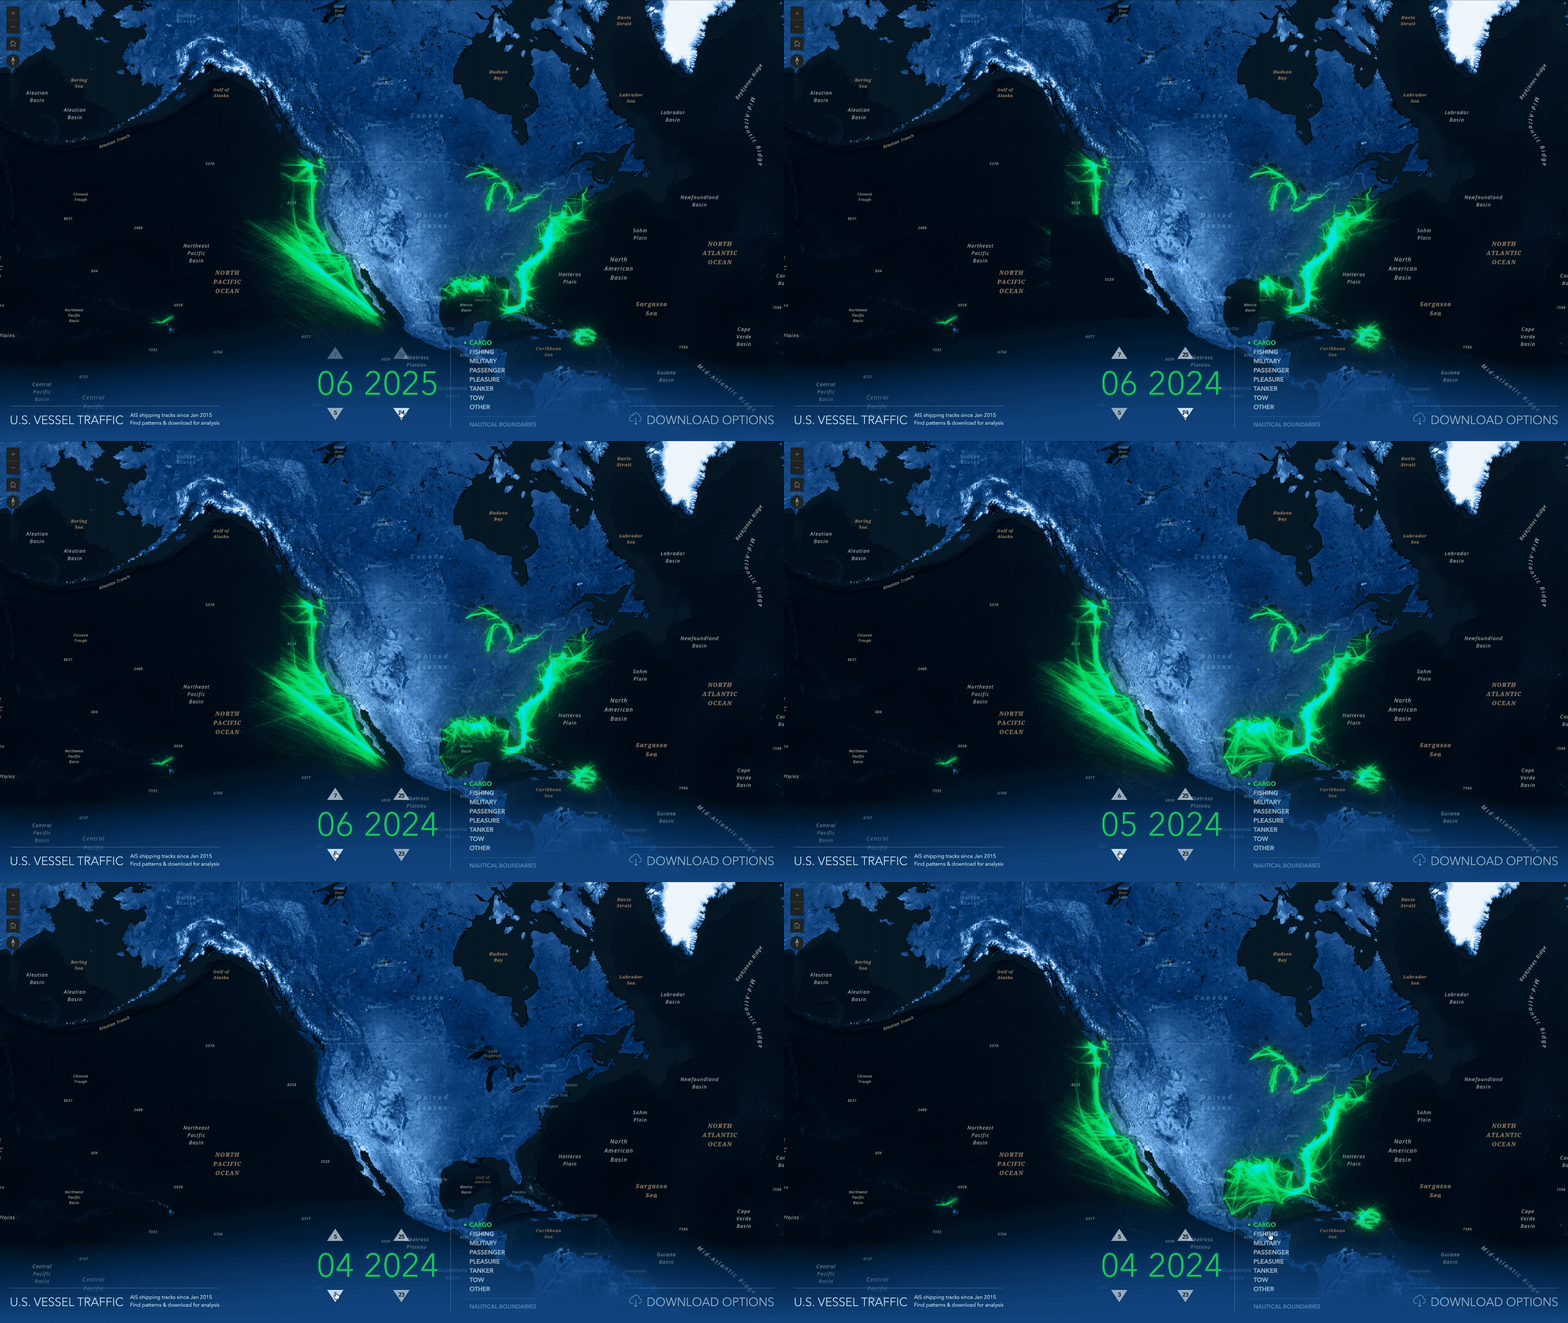
U.S Vessel Traffic
Visualize U.S. vessel traffic by month and category, and download the tracks for further analysis. Vessel traffic data comes from the USCG, NOAA, and BOEM through Marine Cadastre, helping marine spatial planners better understand the users of ocean space and identify potential space-use conflicts.
How it is built: The app leverages custom basemaps, layer effects, feature layers, and map components to create an immersive, interactive visualization of large-scale vessel traffic patterns.
Hike in the Swiss National Park
In this app, you can explore National Park hiking trails in a 3D scene. Hikers who want to pick a hike based on their ability can filter trails by difficulty level or walk time, or select a trail from the map to display more details such as the trail name, description, and elevation profile.
How it is built: The app leverages 3D web scenes, terrain visualization, smart labeling, and elevation profile capabilities to create an immersive hiking exploration experience.
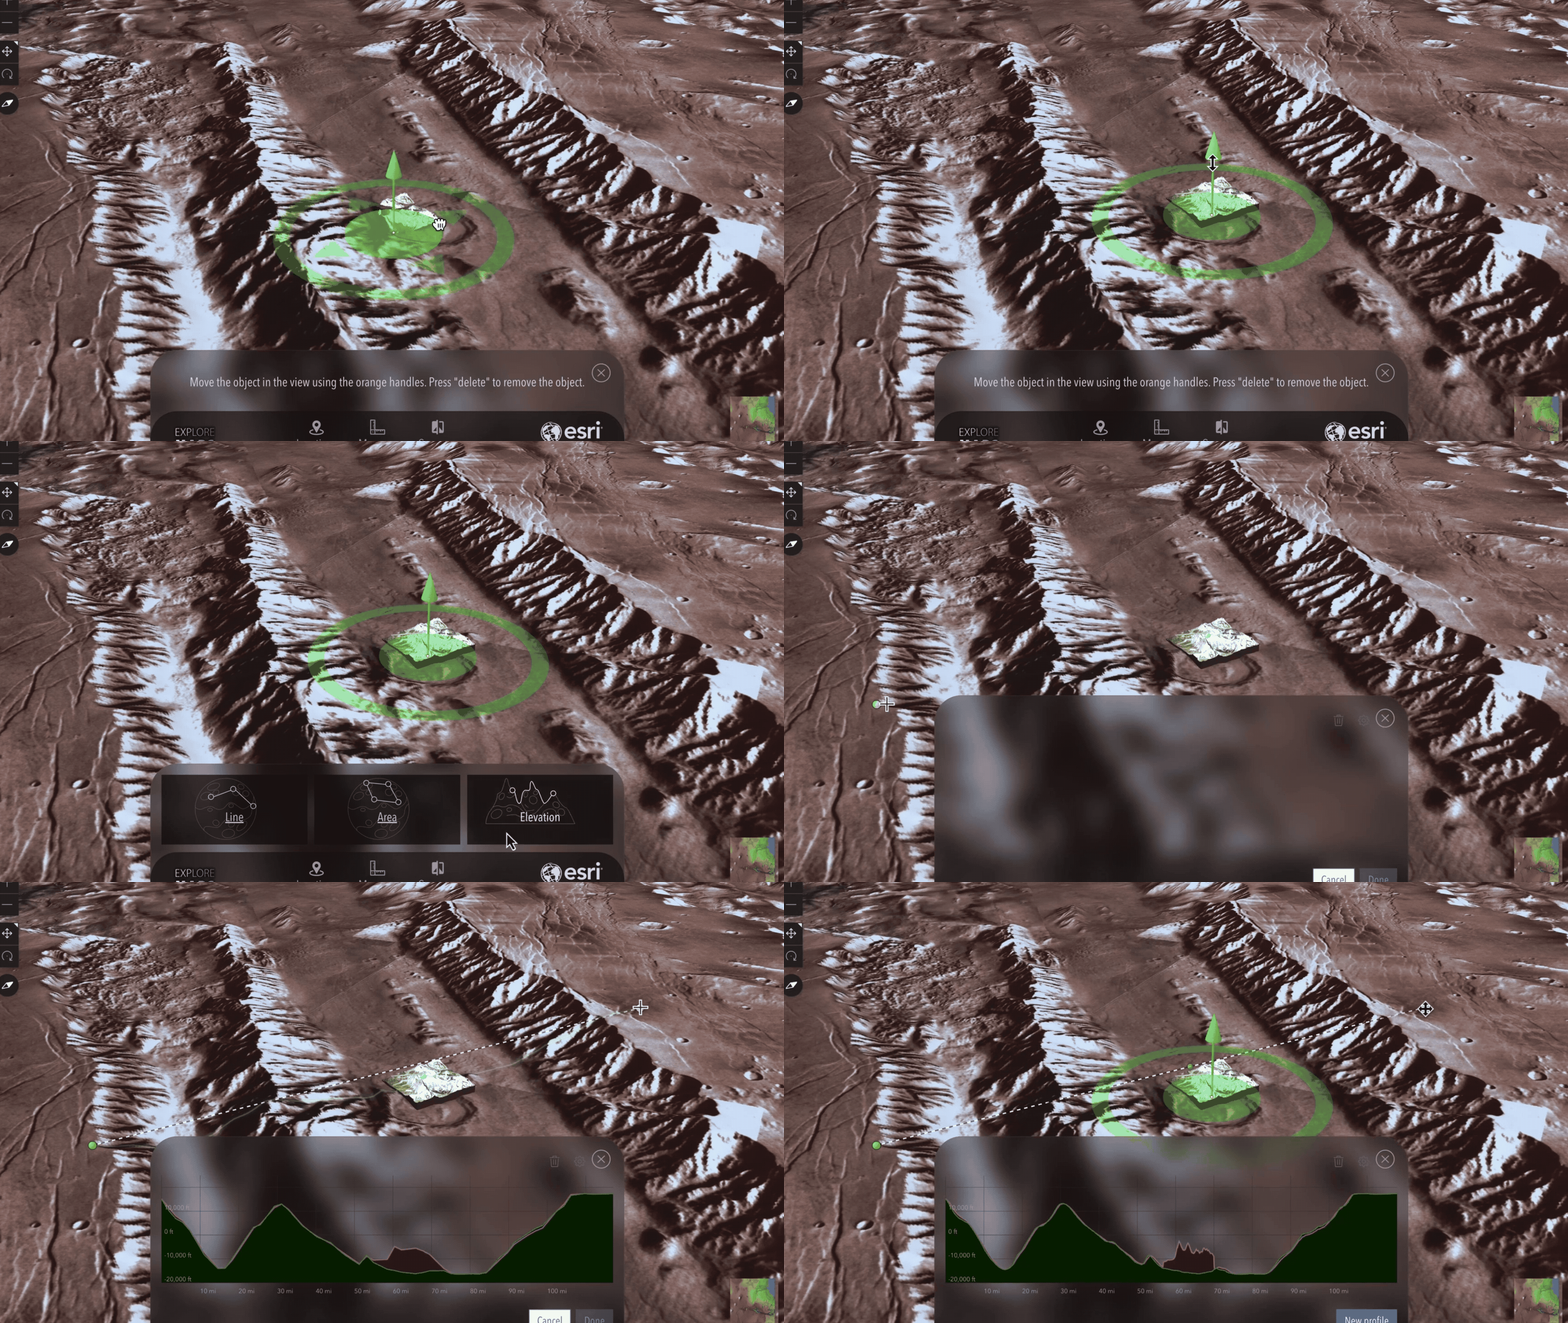
Explore Mars
Navigate and explore Mars using this application. You can traverse the Martian surface, accurately measure its craters and mountains, and understand its terrain with the help of detailed imagery and spatial data. The application uses the Martian coordinate system for an accurate representation of the planet’s real size. You can also compare Mars with Earth by overlaying known regions and 3D objects, which aids in understanding the scale and size of Mars, and trace the paths of rovers such as Perseverance and Curiosity.
How it is built: The App leverages planetary coordinate systems, measurement tools, custom projections, and glTF model support to enable interactive exploration and analysis of Mars in 3D.
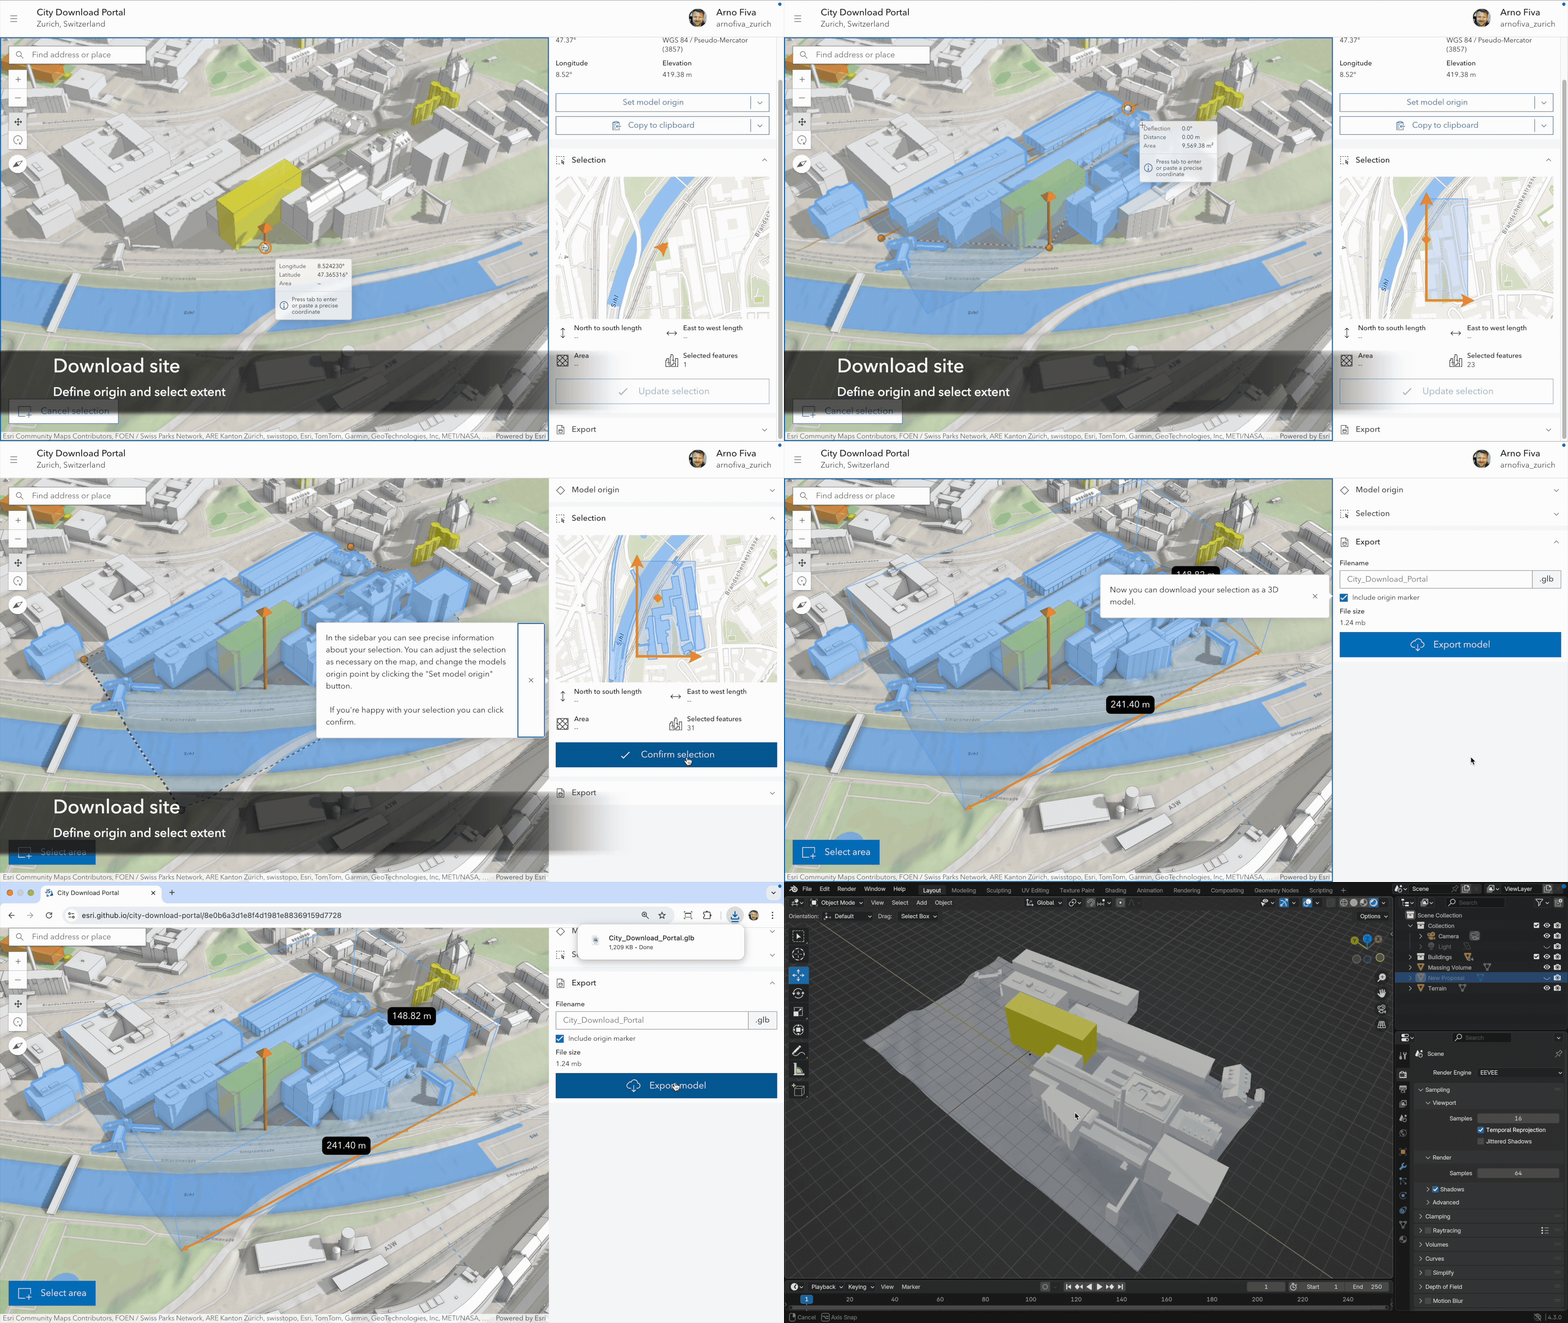
City Download Portal
Select an area of interest to export as a 3D model. This allows you to download the geometry of buildings and terrain. The generated glTF model can then be imported into most popular 3D modeling tools for further use. This app also allows citizens to engage in urban planning processes by interactively proposing designs for future developments. Using the 3D sketching capabilities, users can draw on the ground, create simple buildings, and place arbitrary 3D objects in the scene.
How it is built: The app uses the SDK’s sketching, 3D querying, mesh processing, and glTF export capabilities to extract buildings and terrain from a selected area and generate a downloadable 3D model.
Manhattan Skyscraper Explorer
Buildings are visualized in 3D, allowing you to virtually explore Manhattan. Using the interactive charts and filters, you can single out construction time periods to study the expansion of Manhattan, or view buildings with the shortest or tallest height. Selecting a building displays Wikipedia information about the building in a popup.
How it is built: The app leverages data-driven 3D visualization coordinated chart-map interactions, feature filtering, and search capabilities to explore Manhattan’s skyline and uncover patterns across its tallest buildings.
A practical way to use the Showcase page
The Showcase is more than a gallery of apps. It’s a collection of patterns, workflows, and implementation approaches you can apply to your own projects.
Start with a workflow that resembles yours.
Find an app that solves a similar problem, even if the industry, audience, or data differs.
Explore the experience.
Use the live application to understand how the workflow comes together, from the user interface to the mapping experience.
See how it’s built.
Look beneath the surface to discover the web components, layers, visualizations, analyses, and design patterns that power the application.
Dive into the source code.
Browse the repository to understand the architecture and implementation details, then clone or adapt the code for your own needs.
Make it your own.
Swap in your data, refine the workflows, and tailor the experience to your users and business requirements.
Start exploring and building
The showcase applications demonstrate how multiple capabilities can work together in complete web mapping experiences. Explore the applications, review their code, and adapt the approaches that fit your own projects.
To continue: Explore ArcGIS Maps SDK for JavaScript, read the developer documentation, or subscribe to the Esri Developer Newsletter.


Article Discussion: