I’ve been presenting and writing about ArcGIS Arcade since it was first released in late 2016. One of the most common questions people have asked me over the years is “What if I want to use Arcade for something else?” and “How can I execute Arcade outside of Esri’s predefined profiles?”
Up until recently, Arcade’s execution was strictly constrained to profiles, such as a layer’s popup or renderer. Earlier this year, the ArcGIS API for JavaScript and the ArcGIS Runtime SDKs released the following Arcade executor APIs, which allow you to evaluate Arcade expressions outside predefined profiles.
In this post, I’ll demonstrate how to execute Arcade outside the context of a web map, to create a scatterplot complimenting the map.

Profiles
The Arcade documentation refers to a script’s execution context as its profile. An Arcade profile specifies:
- where you can use Arcade,
- the profile variables (aka globals) that can be used as input data values to the expression,
- the language functions you may use, and
- the valid data types that may be returned from an expression.
Another way to think of a profile is the environment that controls Arcade’s execution. There are more than 20 profiles that allow you to author Arcade expressions for various purposes. Some examples include popups, visualization, labels, and attribute rules.

Cases when you need Arcade executed outside its designated profile
The Arcade profiles already implemented in ArcGIS apps and developer products are sufficient for enabling users to customize apps in a vast majority of cases. However, there are a few scenarios where you may need to display the result of an expression in a custom element or use it as input for some other task. The following are common workflows that would require you to execute Arcade outside an existing Arcade context.
- When you need to use the result of an expression defined in a web map in another context outside the map. For example, an end user may have written an expression for a renderer, popup, or label in a web map and the data returned from the expression should be displayed outside the map in a custom component, table, or summarized in a chart.
- When you need to define a custom Arcade profile and provide a configurable experience within an app for users to write their own expressions.
- Developers may want to take advantage of Arcade’s simplified language syntax for filtering and querying data using the chain-able FeatureSet functions Arcade provides.
This post will demonstrate the first scenario using the esri/arcade module added in version 4.24 of the ArcGIS API for JavaScript. We’ll follow the steps below to display the results of an Arcade expression in a chart outside the context of a web map.
- Load the web map
- Get the Arcade expression
- Define the profile variables
- Create an Arcade executor
- Execute the script
1. Load the web map
When a user authors an Arcade expression in the ArcGIS Online Map Viewer, or in another app like ArcGIS Pro, that expression can be saved in the context where it was defined.
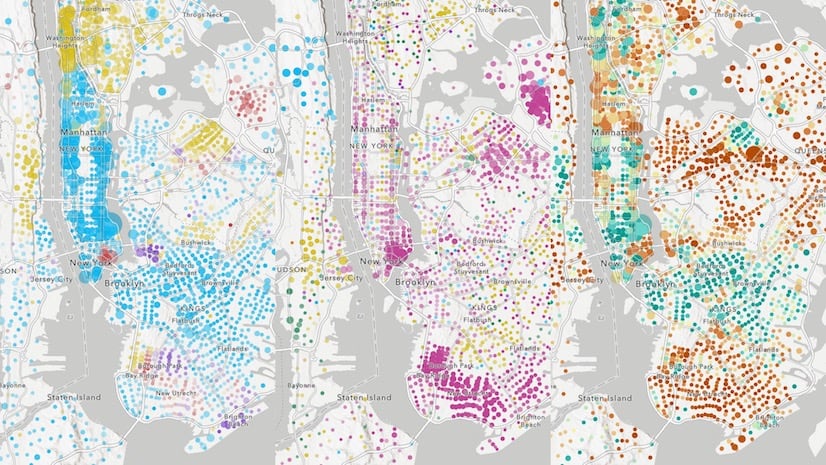
For example this web map defines the following expression in the layer’s style to create a diversity map of languages spoken in U.S. homes.
var english = $feature["B16007_calc_numEngOnlyE"];
var spanish = $feature["B16007_calc_numSpanE"];
var asianLanguages = $feature["B16007_calc_numAPIE"];
var europeanLanguages = $feature["B16007_calc_numIEE"];
var otherLanguages = $feature["B16007_calc_numOtherE"];

var groups = [
  english,
  spanish,
  asianLanguages,
  europeanLanguages,
  otherLanguages,
];

function simpsonsDiversityIndex(vals){
  var k = Array(Count(vals));
  var t = sum(vals);
  for(var i in vals){
    var n = vals[i];
    k[i] = n * (n-1);
  }
  var s = Sum(k);
  var di = 1 - ( s  / ( t * (t-1) ) );
  return Round(di*100);
}

simpsonsDiversityIndex(groups);

To load the web map, reference the portal item ID in the portalItem property of the WebMap class.
const view = new MapView({
  map: new WebMap({
    portalItem: {
      id: "a7fb72d99a9b4e15b811ee60c04fdfc1"
    }
  }),
  container: "viewDiv",
});
2. Get the Arcade expression
The Arcade expression is defined in the valueExpression property of a color visual variable. You need to wait for the view’s resources to load before drilling into the renderer to retrieve the expression.
await view.when();

// Get layer containing Arcade expression from webmap
const spanishSpeakersLayer = view.map.layers.find(
  ({title}) => title === "Language diversity in Spanish speaking populations"
);

// Get visual variable containing the Arcade expression
const renderer = spanishSpeakersLayer.renderer;
const colorVariable = renderer.visualVariables.find( vv => vv.type === "color");

// Arcade expression used by color visual variable
const diversityArcadeScript = colorVariable.valueExpression;
3. Define the profile variables
Arcade requires a profile, or a context, in which to execute. The ArcadeExecutor creates this context, but you first need to provide it with valid profile variables so the Arcade compiler can validate whether the expression is written for the right context.
In the case of the language diversity expression, it was defined for a visual variable in a renderer. Therefore, it should execute within the context of the Visualization profile. The Arcade documentation defines the valid profile variables and expected output types in the Visualization profile specification.
In the ArcGIS API for JavaScript, profile variables are defined as plain objects specifying the name of each variable along with its Arcade data type.
const visualizationProfile = {
  variables: [{
    name: "$feature",
    type: "feature"
  }, {
    name: "$view",
    type: "dictionary",
    properties: [{
      name: "scale",
      type: "number"
    }]
  }]
};
4. Create an Arcade executor
Now the expression is ready to compile. We must provide both the expression and the profile definition to the createArcadeExecutor method, which compiles the script and validates it. If the script validates without compilation errors, the method will return an ArcadeExecutor object, which provides metadata about the expression and methods for executing it.
// Compile the Arcade expression and create an executor
const diversityArcadeExecutor =
  await arcade.createArcadeExecutor(diversityArcadeScript, visualizationProfile);
The executor will throw an error if there are any problems during the compilation of the script, such as usage of an undeclared variable, an improper function call, or a reference to an invalid profile variable.

You shouldn’t find compilation errors when working with expressions from web maps since the ArcGIS Online map viewer blocks bad Arcade expressions from being saved.
When compilation succeeds, an ArcadeExecutor object is returned. This object contains synchronous and asynchronous execute methods that allow you to evaluate the expression.

It’s worth noting the fieldsUsed property of the executor object. This property will list all fields required as inputs for the expression to successfully evaluate. This is important because you need to ensure those attributes are available and downloaded to the client for the script to return valid output.
You should set the fieldsUsed to the outFields property of the source layer of the features used as inputs to the expression. Failing to do this is the equivalent of attempting to call a function without all the required input values.
// Compile the Arcade expression and create an executor
const diversityArcadeExecutor =
  await arcade.createArcadeExecutor(diversityArcadeScript, visualizationProfile);

// Ensure the input to $feature has all the
// data required by the expression.
// The additional field listed below is required by the y axis of
// the chart, but not used in the Arcade expression.
spanishSpeakersLayer.outFields = [
  ...diversityArcadeExecutor.fieldsUsed,
  "B16007_calc_pctSpanE"
];
Now the script is ready to execute.
5. Execute the script
To execute the script, you must hydrate the profile variables with valid inputs. In the case of the visualization profile, you must set $feature to a Graphic instance and $view to a MapView instance.
Since I’m creating a scatterplot where each point represents a feature in the view, I need to query all features in the view and execute the expression for each feature.
const spanishSpeakersLayerView = await view.whenLayerView(spanishSpeakersLayer);
const { features } = await spanishSpeakersLayerView.queryFeatures();

const chartPoints = features.map( async (feature) => {
  // Execute the Arcade expression for each feature in the layer view
  const diversityIndex = await diversityArcadeExecutor.executeAsync({
    "$feature": feature,
    "$view": view
  });

  const backgroundColor = await symbolUtils.getDisplayedColor(feature);
  // Return the chart data along with the color used to represent
  // the diversity index value in the color variable
  return {
    data: {
      x: diversityIndex,
      y: feature.attributes.B16007_calc_pctSpanE
    },
    backgroundColor
  }
});

// Use a Chart API to build a chart from the Arcade results
const chartDataArray = await Promise.all(chartPoints);
The result of the expression (i.e. the diversity index value) is provided to the x axis of the chart in addition to the percentage of the population that speaks Spanish (the chart’s y axis).
Once the data is processed on the client and provided to the chart, it will render alongside the map view. Also note the color of each point corresponds to the color of the related feature on the map.
Conclusion
This was just one example of how you can use the ArcadeExecutor to execute Arcade expressions already defined in web maps in the context of an ArcGIS API for JavaScript web application. You could similarly display the results in a custom web component or as input to another analytical process.
Check out the Execute Arcade for a custom chart sample to review the full app code and explore the data on your own.


Article Discussion: