At Esri UC last month, I observed more interest in ArcGIS Arcade than I ever had at an Esri conference. I heard questions ranging from the fundamentals, such as:
- What is Arcade?
- Where can I use Arcade?
- Why did Esri develop a new language instead of leveraging an existing one?
…to more specific questions like:
- How can I use Arcade to sort fields in my popup?
- Can Arcade be used to help me visualize the status of a project based on multiple fields?
- Can I control the execution of Arcade outside of a popup?
But my favorite question was the following:
As a developer I can already use (insert favorite programming language here) to customize almost any ArcGIS app. Do I really need Arcade?
It’s a great question that deserves much more than a catch-all “it depends” response (though it really does depend on what you’re trying to accomplish).
The TL;DR is yes, Arcade may help you more than you think. Especially when it comes to defining conditional content in one app where it can be saved and reused in potentially hundreds of apps, all without duplicating your code.
Let’s dive into some details that demonstrate how Arcade can benefit app developers. I’ll start with some contextual examples of where Arcade is used. If you feel confident in your Arcade knowledge, feel free to skip straight to the Why developers should care about Arcade.
What is Arcade?
In its most fundamental usage, Arcade is a calculator. It allows you to compute values derived from attributes in a layer. The result can be used in popups, labels and in renderers. Best of all, these scripts work throughout the ArcGIS system.
In fact, when Arcade was first released in December 2016, it could only be used for basic calculations and formatting with a few out of the box functions, very similar to a spreadsheet formula.


Arcade has evolved over the years, making it more powerful. In fact, we’ve added more than 100 new Arcade functions, new language features (such as template literals), and expanded Arcade’s presence throughout the ArcGIS system since its first release. Now Arcade looks and feels more like a full-fledged scripting language.
For example, in the latest versions of Arcade, you can use it to customize popup content and define conditional behavior in forms and dashboard elements based on user input.

Where can I use Arcade?
You can only use Arcade within a few contexts of ArcGIS apps and APIs. In our documentation, we refer to the script’s execution context as the profile. An Arcade profile specifies where you can use Arcade, the profile variables (aka globals) that can be used as input data values to the expression, the language functions you may use, and the valid data types that may be returned from an expression. Another way to think of a profile is the environment that controls Arcade’s execution.

Let’s check out a few scenarios where Arcade can be useful to you as a developer.
- Scenario 1. Calculate a new value.
- Scenario 2. Create custom popup content.
- Scenario 3. Customize app layout and behavior.
Scenario 1: Calculate a new value
Arcade allows you to calculate new values based on existing attribute values in the layer or table. Each of the following are common examples of how Arcade can be useful when defining custom popup content or creating a new data variable for a visualization.
Calculate a percentage or ratio based on two fields
This very common workflow in mapping makes it easy for you to normalize a data variable by whatever variable you want without having to rely on the table to provide it. For example, you may need to visualize the percentage of the population under the age of 5.
($feature.POP_0_5 / $feature.TOTAL_POPULATION) * 100
Or calculate the density of that population by square mile.
$feature.POP_0_5 / AreaGeodetic($feature, "square-miles")
Arcade gives you the flexibility to explore various ways to represent your data without having to modify the underlying table.
Classify data into user-friendly categories
Another common use of Arcade is to classify data into user-friendly categories such as no risk, low risk, moderate risk, or high risk. Oftentimes a number isn’t relatable. Classifying numeric data with a relatable term may be all policy makers need to inform decision making.
When(
  $feature.TEMP > 110, "Extreme heat",
  $feature.TEMP > 95, "Abnormally hot",
  $feature.TEMP > 30, "Normal range",
  $feature.TEMP > 0, "Abnormally cold",
  "Extreme cold"
)

Track work order progress
I recently spoke with a customer working for a power company that uses web maps to track their work orders for clearing vegetation encroaching on distribution lines. They had fields describing the state of an incident:
- VegScore – A category indicating the severity of the encroachment.
- WorkOrder – When there is significant encroachment, a work order is assigned for someone to clear the vegetation.
- Assignee – The name of the field worker assigned to do the work.
- Completed – A field indicating if the work was complete.
- Audit – When the work is completed, someone will inspect the work and indicate if it has been done properly.
This customer wanted to easily visualize the stage of each work order without having to set up a new field. The following expression demonstrates how they can do this in Arcade.
When(
  $feature.Audit == "Accepted", "Audit Accepted",
  $feature.Audit == "Rejected", "Audit Rejected",
  $feature.Completed == "Yes", "Work complete",
  !Empty($feature.Assignee), "Work order Assigned",
  !Empty($feature.WorkOrder), "Work order created",
  $feature.VegScore
);
Arcade is the perfect solution for this scenario. Rather than creating new fields with computed values, Arcade allows us to dynamically derive values on each map refresh.
Calculate an index
Sometimes you may need to make sense of multiple data values that are related to one another. With Arcade, you can create an index and map it to help you identify geographic areas of concern or abnormality.
The following expression demonstrates how you can use Arcade to calculate Simpson’s Diversity Index.
function simpsonsDiversityIndex(vals){
  var k = Array(Count(vals));
  var t = sum(vals);
  for(var i in vals){
    var n = vals[i];
    k[i] = n * (n-1);
  }
  var s = Sum(k);
  var di = 1 - ( s  / ( t * (t-1) ) );
  return Round(di*100);
}

var categories = [
  $feature.categoryA,
  $feature.categoryB,
  $feature.categoryC,
]
simpsonsDiversityIndex(categories);

Is Arcade really needed for simple calculations?
You may reasonably ask, “Hold on, why do I need Arcade to calculate a new value? Can’t I just create a new field in my table or service and calculate it with SQL?”
That question assumes you either own the underlying data, or you have editing access to the table. Because Arcade is a client-side solution, you don’t actually edit the underlying data. It allows you to calculate data values and save them to your app without touching the service.
Here are a few reasons why Arcade may be preferable even for simple calculations:
- When you don’t own the data, but need to calculate values or classify the data in your own way.
- The underlying data updates so frequently it doesn’t make sense to run a task to recalculate the derived values you need every five minutes, one hour, each day, etc. This is the case for the vegetation management work on the distribution lines.
- The formula for classifying the data is fluid or under development. Have you ever created a new field and had to recalculate it multiple times (or even create additional fields) before getting what you were looking for? It’s a messy workflow and can feel like a drag if the table calculations take a while. Calculating values on the client protects the back end from unnecessary clutter.
- Arcade provides a full suite of geometry functions not available in other languages, like SQL. That means you can use Arcade to calculate measurements like area in renderers and popups without needing to run a task or geoprocessing tool.
Scenario 2: Create custom popup content
Arcade gives you capabilities beyond simple calculations. It allows you to declare variables, iterate through items in a list, write conditional statements with logical operators, and define custom functions. The following examples demonstrate how you can use Arcade to create dynamic popup content.
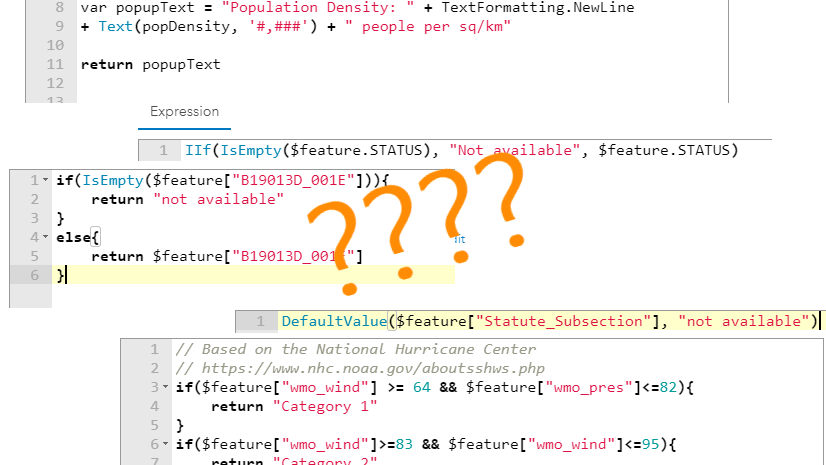
Conditional popup content
Sometimes you need different content elements to display in a layer’s popup depending on the underlying data. For example, the user may to see a list of features included in a cluster inside its popup. However, scrolling through a long list would be undesirable in very large clusters. With Arcade, you can set a condition so the popup of small clusters ( 20 features) would display categories summarizing the data in a table or charts. Arcade can define all that behavior with one expression in one popup template.
If this interests you, I encourage you to check out this post that describes how you can use Arcade to create popup content for clusters conditional on the number of features in the cluster.


Popups enriched with Living Atlas data
Arcade also provides functions for accessing data in other hosted feature services. That means you can query data from a layer in the Living Atlas, and summarize that information based on the selected geography in your map.
var censusLayer = FeatureSetByPortalItem(
  Portal('https://www.arcgis.com/'), "8dcf5d4e124f480fa8c529fbe25ba04e", 0)
var tract = First(Intersects($feature, censusLayer));

return tract.Average_Household_Income;

Scenario 3: Customize app layout and behavior
Because of all the capabilities listed above, Arcade also allows you to customize configurable apps beyond the options provided in the configuration UI. Perhaps the best example of this is with ArcGIS Dashboards and form templates in editing workflows.
Dashboards
In Dashboards, Arcade can be used to customize the way indicator, list, and table elements render data points. You can also build robust visualizations based on new data sources queried and built completely in Arcade.
The following image shows how Arcade can be used in a snowplow tracking dashboard to highlight list elements representing stopped trucks.

Check out these articles that outline how to use Arcade in various workflows within ArcGIS Dashboards.
- Getting started with advanced formatting using Arcade in Dashboards
- Pushing the limits of Arcade in dashboards
This video also demonstrates more examples of how you can use Arcade to customize visualizations in dashboards.
Editing data with forms
Arcade allows you to customize the behavior of field inputs in forms for editing workflows. For example, instead of displaying all fields in various form elements, you can control field visibility (and the visibility of groups of fields) based on the values of other fields.
You can also write expressions to automatically calculate field values based on the values of other fields as the user edits the data. Check out the 4-minute mark of this video to see a demonstration of this capability.
Why developers should care about Arcade
Now you may have read everything to this point and thought, “Do I really need Arcade to help me in any of these scenarios?”
Scenario 1. Calculate new values. Can’t every programming language already do that?
Scenario 2. Create custom popup content. Been there. Done that.
Scenario 3. Customize app layout and behavior. I already do this all the time. I’m an app developer, remember?
If you are developing only one app, then yes, you have a point. You can leverage a variety of programming languages in a number of ArcGIS developer products to create custom content for desktop, mobile, or web apps. However, there are two things Arcade does for you that will make your life easier as an app developer.
- Arcade gives users the power to define conditional content without the need for a developer.
- Arcade is portable. The same expression can be saved, shared, and understood by many apps on a variety of platforms.
We’ve already covered how Arcade can help non-developers use Arcade to customize apps beyond configuration UIs. The ability to save and share expressions deserves a closer look.
Portability
Arcade is powerful because of its portability with other apps and maps throughout the ArcGIS system. Can you customize an app built with an ArcGIS API or SDK to fit your organization’s needs? Absolutely. However, those customizations live only in the context of one application.
What if you wanted to create dynamic popup content that desktop GIS users consumed at their workstations, and the same content could be consistently rendered on a mobile app by field workers, and by policy makers in a web app? With Arcade, you can define that dynamic content with one consistent language and share it for consumption in apps throughout your organization’s system.

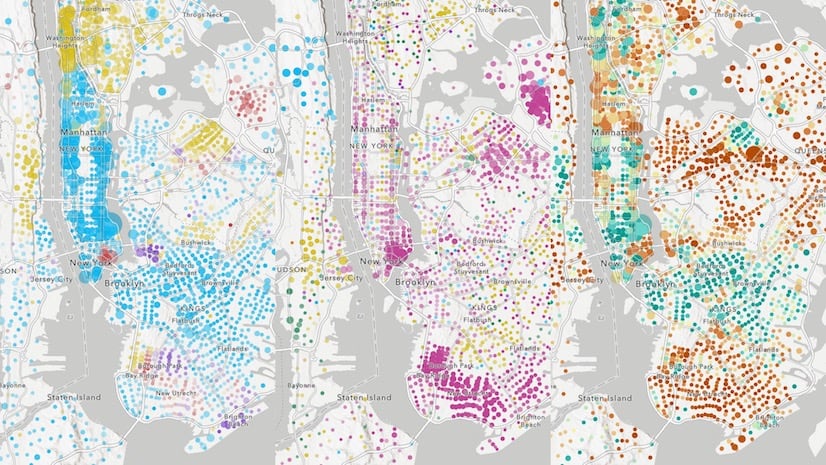
In the following presentation, I demonstrate Arcade’s portability using an expression I wrote that calculates diversity index for language groups in the United States. The values of the layer’s renderer and the popup content are all dynamically created using Arcade.
Without Arcade, I would need to customize each mobile and web app in an attempt to make them behave and look the same. ?
Thanks to Arcade, I can author expressions with one consistent syntax, save them to a web map, and load that map into almost any ArcGIS application (web, mobile, or desktop) and the content will persist, providing a consistent experience for all my end users.
Conclusion
You’re a developer. Do you really need Arcade?
Given your use case, you may not need Arcade at all. However, there are many cases where it can make your app development much easier, especially if you deploy many apps to your organization. I believe it’s definitely worth your while to experiment and give Arcade a try.

Article Discussion: