About a year and a half ago ArcGIS Online introduced the ability to create data-driven visualizations using Arcade expressions. In this post, I’ll demonstrate how you as a developer can use Arcade to generate renderers with Smart Mapping for data exploration web apps, while keeping the UI simple for your users.
We’ll discuss the fundamentals required for developing a web app with the ArcGIS API for JavaScript using Arcade to generate the renderer in the app below.
Arcade is an expression language built for evaluating data values client side for labeling, popup content, and data visualization. Since Arcade’s introduction to the ArcGIS platform, many people have used it in innovative ways to visualize their data. If you’re unfamiliar with Arcade, check out a few of the resources below to see examples of how Arcade can be used in your workflows.
- Introducing Arcade
- Use Arcade expressions to map your ideas
- Creating a predominance visualization with Arcade
In the case of styling layers with Arcade, ArcGIS Online will pass the Arcade expression to the relevant Smart Mapping generator method selected by the user (e.g. color, size, color & size, predominance, etc.). The selected method will treat the expression as an attribute field and generate a style (or renderer) for the layer based on statistics queried from data returned from the expression.
For example, you can write an expression that returns the winner among a set of competing numeric attributes. You don’t need to add new fields to your service to indicate the winner for each geography. The expression will calculate it client side and return that value for you. This is particularly powerful for election mapping.
We ported support for generating renderers with Arcade to the 4.x series of the ArcGIS API for JavaScript at the 4.7 release in April 2018. That means you can now develop data exploration apps with 4.7 that use values from Arcade expressions to generate renderers.
Some background
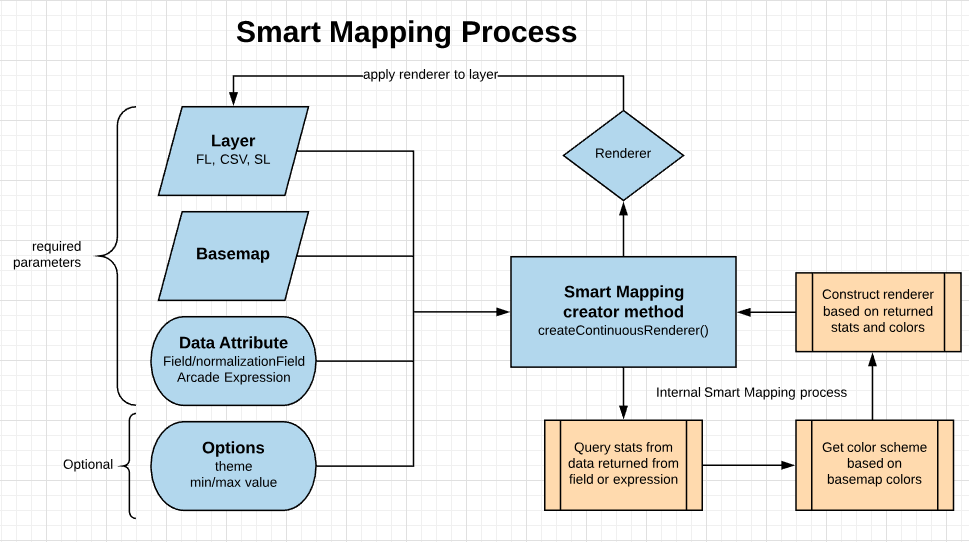
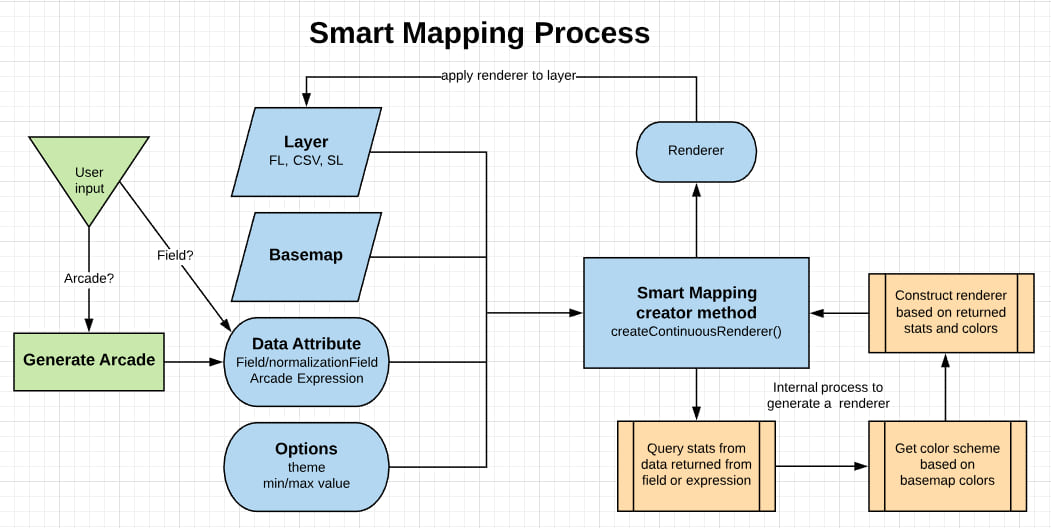
See the flow diagram below (starting from the left), which provides a brief overview of how you can use the Smart Mapping APIs to generate renderers for data exploration apps. The portion in blue indicates the process you should follow including required input parameters, and what to do with the output renderer. The beige steps indicate the internal process the creator method follows for creating the desired renderer.
Check out the following resources if you are new to Smart Mapping:
In the most standard Smart Mapping scenario, all you need is a layer, a basemap, and a field name (and optionally a normalization field). This will create a nice renderer based on the statistics of the data and styled with colors that pair nicely with the basemap. The snippet below demonstrates this pattern using async/await.
const rendererParams = {
  layer: layer,
  field: "EDUC01_CY",  // Population 14+ without education
  normalizationField: "EDUCA_BASE",  // Total Population 14+
  basemap: view.map.basemap
};

const rendererResponse = await colorRendererCreator.createContinuousRenderer(rendererParams);

// apply renderer to layer
layer.renderer = rendererResponse.renderer;
While the API is clean, take note of the awkward legend text. By default the field aliases reflect the mathematical operation of normalizing.
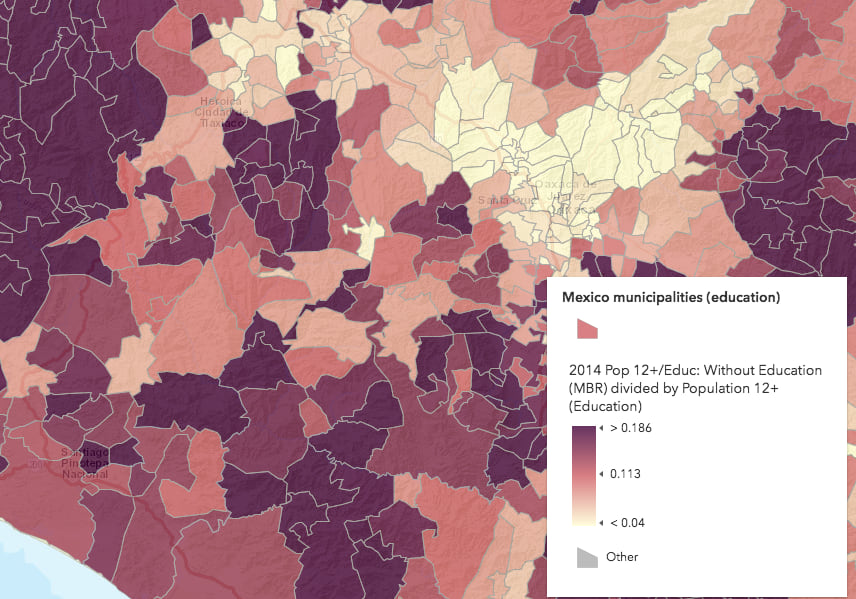
This is OK for the sake of defaults. But you can make the legend text more readable by setting the legendOptions parameter to something more understandable.
const rendererParams = {
  layer: layer,
  field: "EDUC01_CY",
  normalizationField: "EDUCA_BASE",
  legendOptions: {
    title: "% population without formal education"
  },
  basemap: view.map.basemap
};
That title is better, but the numbers in the legend will still appear as ratios. What’s nice about Arcade is that it gives you flexibility to convert those numbers to percentages, round them, or do anything else client-side without the need to calculate new fields on the service.
Smart Mapping and Arcade
Instead of referencing a field and a normalization field in the renderer creator function, you can pass an Arcade expression as a string to the valueExpression parameter. This can be a simple one-line expression or a more complex multi-line expression from a separate script tag or text file.
The Arcade expression passed to the creator function in the following snippet returns the percentage of the population that doesn’t have any formal education.
const rendererParams = {
layer: layer,
valueExpression: "Round( ( $feature.EDUC01_CY / $feature.EDUCA_BASE ) * 100 )",
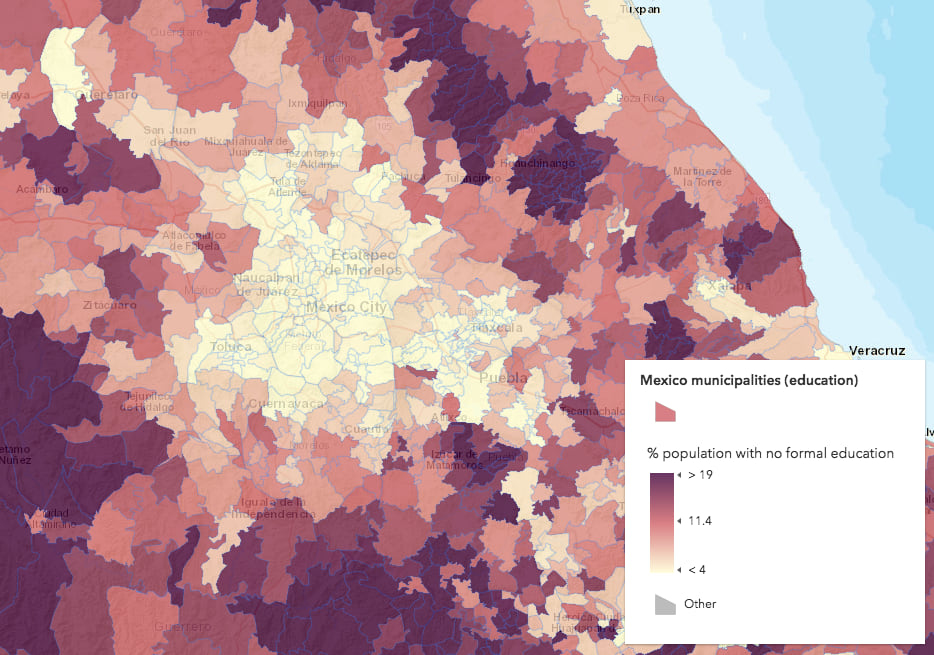
valueExpressionTitle: "% population with no formal education",
basemap: view.map.basemap,
view: view
};
const rendererResponse = await colorRendererCreator.createContinuousRenderer(rendererParams);
// apply renderer to layer after the promise resolves
layer.renderer = rendererResponse.renderer;
The rounded numbers make the legend look more clean and readable.
Generating Arcade expressions
While the snippets above demonstrate how Arcade expressions can be used to generate renderers for your data, they don’t necessarily illustrate a practical use case for using Arcade to create renderers in a useful data exploration application. Most of the time, you likely won’t have a hard-coded expression either as a string or wrapped in standalone script tags. After all, changing the mapped variable (i.e. the expression) is what data exploration is all about!
There are two approaches to changing the Arcade expression for data exploration purposes. You can:
1. Give the user full control over the expression by developing your own Arcade editor similar to the one used by ArcGIS Online. This would be expensive and time intensive, not to mention it would add a certain degree of complexity to the user experience of your app.
2. You can generate and re-generate Arcade expressions in behalf of the user without exposing them to Arcade at all. You can accomplish this by providing the user with traditional UI elements such as drop downs, text/number inputs, and sliders to change key parameters used to determine the visualization. You could then use their inputs to generate an Arcade expression for them behind the scenes. This simplifies the data exploration experience for the user and significantly reduces the possibility of allowing the user to create an invalid expression.
See the modified flowchart representing this workflow, where green shapes indicate the new steps in the Smart Mapping development pattern.
I wrote the following app in TypeScript to demonstrate how you can write your own Arcade generator function in a Smart Mapping workflow.
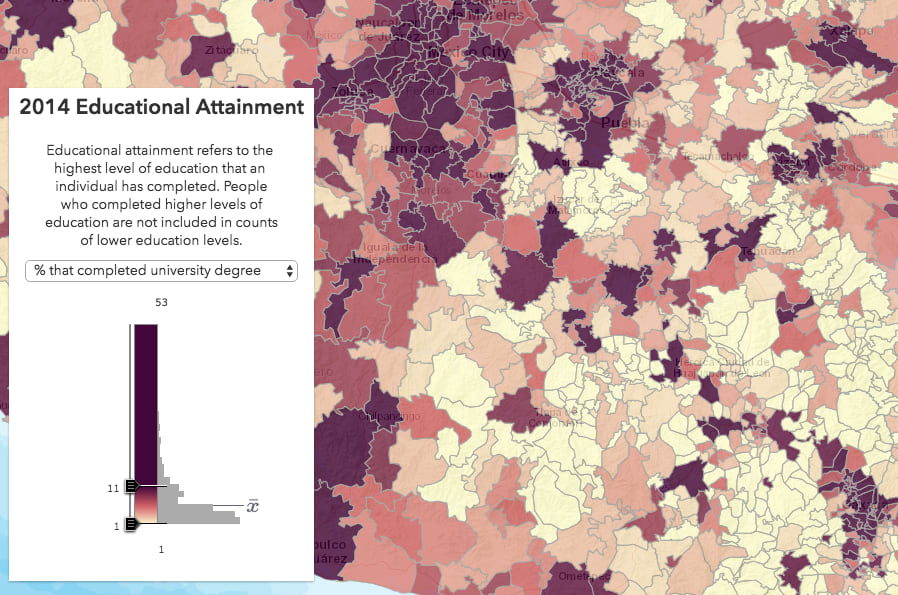
The concept of the app is simple – The user can select one of five educational attainment levels to show the geographic distribution of that variable in the map. Behind the scenes, the app generates Arcade expressions for the renderer and the popup, without exposing an expression builder to the user.
The app visualizes various levels of completed educational attainment for each city. The dataset actually has a lot more than five educational attainment variables; it contains 15 more refined subcategories including fields such as “never attended school”, “attended some elementary school”, and “attended preschool”.
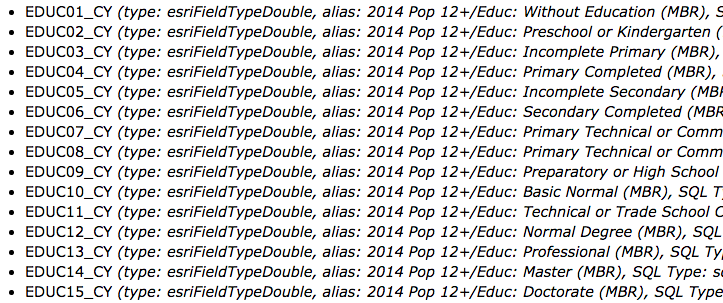
To simplify my app, I combined those three fields into a single attribute I called “no formal education” since people in all three categories never technically finished an education level. Likewise, on the other end of the spectrum, there are fields for those who completed bachelor’s, master’s, and doctorate degrees. Since those numbers are small on their own, I decided to aggregate them into one variable: “university degree completed”.
That’s where Arcade can help us. To visualize the percentage of people without formal education, we would need to write the following expression:
var noSchool = $feature.EDUC01_CY + $feature.EDUC02_CY + $feature.EDUC03_CY;
var total = $feature.EDUCA_BASE;
Round( ( noSchool / total ) * 100 );
Rather than write out separate expressions for each category, or ask the user to do it themselves, I wrote a function that generates the expression required to visualize the percentage of the population that attained each education level. The expression appends the $feature keyword to field names and aggregates fields to a single value when multiple fields are provided.
The benefit of this approach is that it scales, allowing you to generate more expressions as needed as long as the same expression template is required.
function generateArcade(fields: string[], normalizationField?: string): string {
  let value: string;
  if (fields.length === 1) {
    value = `$feature.${fields[0]}`;
  } else {
    value = fields.reduce( (a: string, c: string, i: number) => {
      return i === 1 ? `$feature.${a} + $feature.${c}` : `${a} + $feature.${c}`
    });
  }
  const percentValue = normalizationField ? `( ( ${value} ) / $feature.${normalizationField} ) * 100` : value;
  return `Round( ${percentValue} )`;
}
This function expects an array of field names (for aggregation if necessary) and a normalizationField. Notice that I don’t expose a normalize option to the user in the app. You, as the developer, should handle normalization within the code. This is nice because it keeps the user experience as simple as possible.
The app is also written in such a way that it can be configured to work with other layers as long as the developer configures the FieldInfoForArcade objects appropriately given the following interface:
interface FieldInfoForArcade {
  value: string,  // e.g. "no-school"
  label: string,  // e.g. "% with no formal education completed"
  description: string,  // e.g. "didn't complete any level of formal education."
  fields: string[]  // e.g. [ "EDUC01_CY", "EDUC02_CY", "EDUC03_CY" ]
}
Notice also that I use the same expression to update the popupTemplate of the layer. That way, when the user selects a new variable to visualize, they can click any feature and see a nicely formatted popup specific to the selected variable. This keeps unnecessary information from appearing in the popup when there is only one variable of interest.
Try it out!
You might also ask, “Can’t I just use JavaScript to do all of this work for me?” Yes, you can do that, but using JavaScript instead of Arcade will limit the visualization to the scope of the app. Arcade can run on multiple systems throughout the ArcGIS platform, so the generated expression can be saved to the layer and consumed in other web apps and even ArcGIS Pro if needed.
Hopefully, you’ve learned something new and have been inspired to write your own functions for generating Arcade expressions for data exploration apps. In fact, we already do this for some Smart Mapping functions in the API. Stay tuned to learn more about how we generate Arcade expressions internally in our Smart Mapping methods.

Commenting is not enabled for this article.