At the 2018 Dev Summit, Yann Cabon and I presented on Dynamic Map Services with the 4.x version of the ArcGIS API for JavaScript. We received a lot of excellent feedback, and quickly realized that this topic deserved additional attention. This blog will serve as an opportunity to reintroduce you to MapImageLayer, and highlight the highlights from the presentation. Future blogs will dive even deeper into specific capabilities of this class.
Background
If you’re familiar with the 3.x version of the API, then you might remember the class ArcGISDynamicMapServerLayer, which is both one of the longest and most favored classes in the API. This class is known as MapImageLayer in the 4.x version of the API. It’s worth noting that dynamic layers must be enabled on the Map Service to unlock the dynamic abilities of MapImageLayer if you are working with ArcGIS Enterprise.
The MapImageLayer proposes a revamped API that allows the developer to easily manipulate Sublayers, which represent the different layers of the service, organized in a tree structure. MapImageLayer handles all processing on the server, not the client, and exports images of features. For example, when a map’s View stops moving after a user interaction, the MapImageLayer sends a request to the service to get an updated image of the map. In some cases, offloading the processing to the server allows MapImageLayer to render more features with a higher level of performance than other layers.
Creating a MapImageLayer
MapImageLayers can be created two different ways: from a service URL or from an ArcGIS portal item ID (ArcGIS Online or ArcGIS Enterprise). If working with a service URL, MapImageLayers with one or more Sublayers can only be created from a MapServer (not a FeatureServer).
Here’s an example from a service URL:
require(["esri/layers/MapImageLayer"], function(MapImageLayer) {

  const layer = new MapImageLayer({
    url: "https://sampleserver6.arcgisonline.com/arcgis/rest/services/USA/MapServer"
  });

  map.add(layer);

});
Here’s an example from a portal item:
require(["esri/layers/MapImageLayer"], function(MapImageLayer) {

  const layer = new MapImageLayer({
    portalItem: {  // autocasts as new PortalItem()
      id: "e7e03ad8f72b42709e7d63dde8c6c3f5"
    }
  });

  map.add(layer);

});
Both methods create the same MapImageLayer. One of the benefits of working with a portal item is that the styling (e.g. symbology, definition expressions, popups) that was previously configured is honored in the new MapImageLayer. This reduces the amount of code the developer needs to add. Now let’s dive into customizing the MapImageLayer in the code.
Customizing a MapImageLayer
There are two big deals with MapImageLayer. First is the ability to create dynamic layers from map service layers for creating on the fly rendering, labeling, definition expressions, and popups, with DynamicMapLayer. Second is the ability to create dynamic layers from other sources in registered workspaces such as tables and table joins, using DynamicDataLayer. Now let’s explore two specific use cases for working with the MapImageLayer.
1. DynamicMapLayer
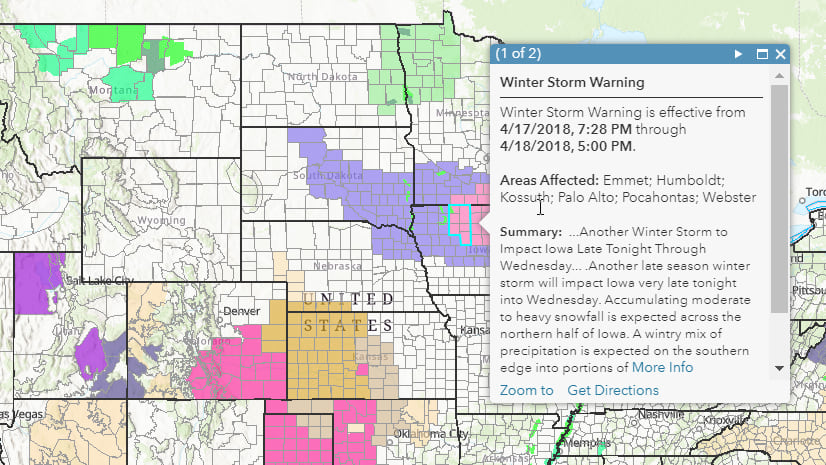
Here is a sample app that illustrates the power of on the fly customization. The goal is to display information about the populations of major cities in the US. It sets a renderer on three of the Sublayers (Cities, States, and Highways) to make the map visually appealing, and applies both a definition expression and a popup to the Cities Sublayer to allow for further investigation by the user. As a bonus feature, there is an interactive slider at the bottom of the app that allows the user to change the minimum population value for the Cities definition expression to display smaller or larger metropolitan areas.
DynamicMapLayer
First, let’s take a look at the renderering. We define three different SimpleRenderers using SimpleMarkerSymbol, SimpleFillSymbol, and SimpleLineSymbol. Fun fact: none of these class modules will appear in the require statement because they are all autocast. Thanks 4.x!
var citiesRenderer = {
  type: "simple", // autocasts as new SimpleRenderer()
  symbol: {
    type: "simple-marker", // autocasts as new SimpleMarkerSymbol()
    size: 14,
    color: {a: 1, b: 200, g: 0, r: 0},
    style: "circle"
  },
  label: "Cities"
};

var statesRenderer = {
  type: "simple", // autocasts as new SimpleRenderer()
  symbol: {
    type: "simple-fill", // autocasts as new SimpleFillSymbol()
    style: "solid",
    color: {a: 1, b: 0, g: 0, r: 0},
    outline: {
      width: 2,
      color: {a: 1, b: 0, g: 200, r: 0}
    }
  },
  label: "State boundaries"
};

var highwaysRenderer = {
  type: "simple", // autocasts as new SimpleRenderer()
  symbol: {
    type: "simple-line", // autocasts as new SimpleLineSymbol()
    style: "solid",
    width: 1.5,
    color: {a: 1, b: 100, g: 100, r: 100}
  },
  label: "Interstate highway"
};
Next, let’s apply those renderers to the relevant Sublayers, and then add the definition expression (to only display cities with a population greater than 100,000 initially) and popupTemplate (to display the exact city population and name in the respective state) to the Cities Sublayer. It’s worth mentioning that when you define Sublayers, you will want to manually order them so they display in a logical drawing order (e.g. polygons on bottom, point on top).
var layer = new MapImageLayer({
  portalItem: { // autocasts as new PortalItem()
    id: "e7e03ad8f72b42709e7d63dde8c6c3f5"
  },
  sublayers: [
  {
    id: 2,
    title: "States",
    visible: true,
    renderer: statesRenderer
  },
  {
    id: 3,
    title: "Counties",
    visible: false
  },
  {
    id: 1,
    title: "Highways",
    visible: true,
    renderer: highwaysRenderer
  },
  {
    id: 0,
    title: "Cities",
    visible: true,
    renderer: citiesRenderer,
    definitionExpression: "pop2000 > 100000",
    popupTemplate: {
      title: "{areaname}",
      content: "{pop2000} people call the city of {areaname}, {st} home"
    }
  }]
});
2. DynamicDataLayer
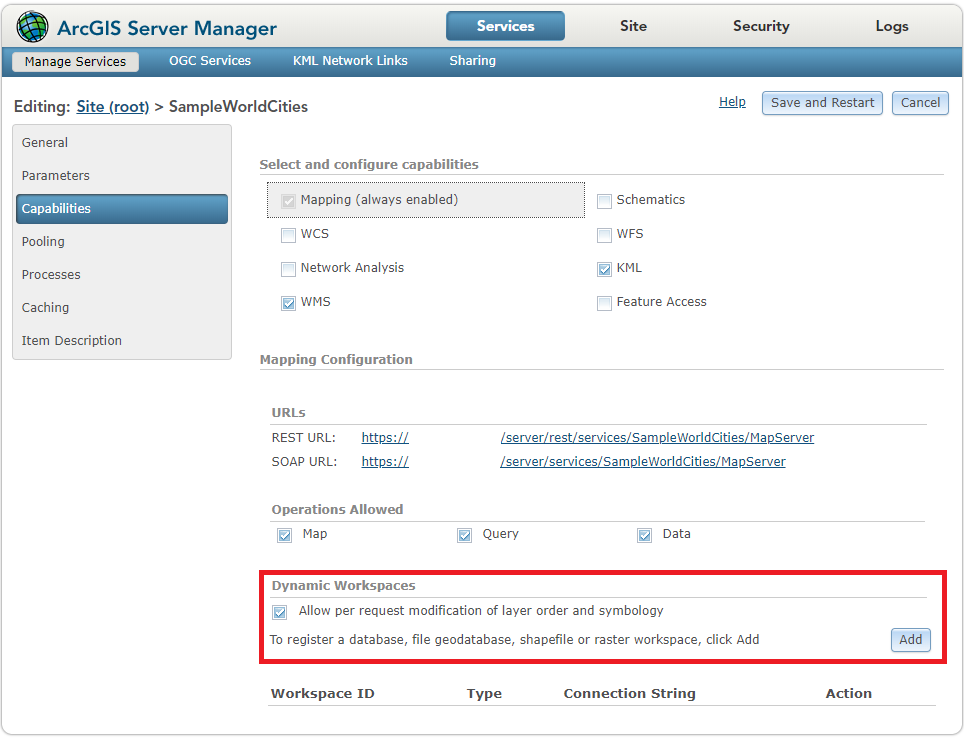
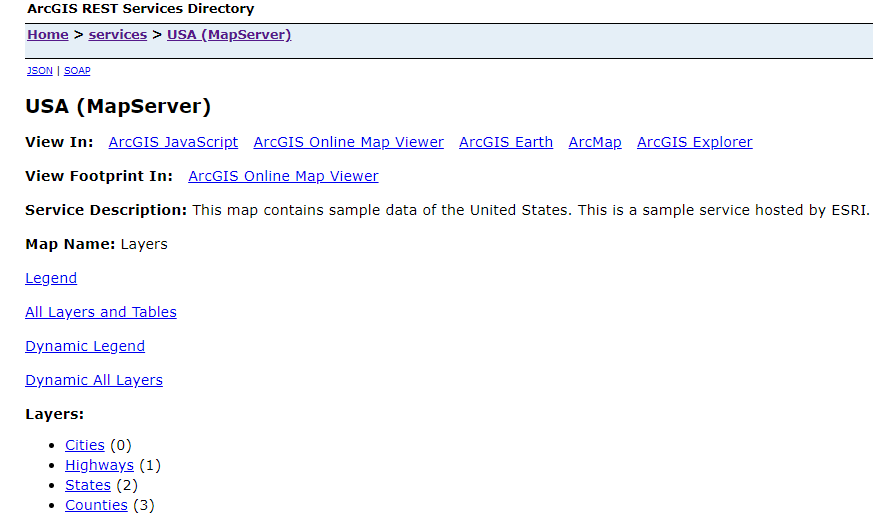
A DynamicDataLayer is created on the fly from data stored in a registered workspace, but isn’t explicitly exposed via the service URL. There are four types of these DynamicDataLayers, which are classified based on their data source: JoinTableDataSource, QueryTableDataSource, RasterDataSource, and TableDataSource. The data may be tables with or without geometries, feature classes, or rasters. Data from tables may be joined to other tables or dynamic map layers. For reference, look back at the USA (MapServer) mentioned earlier in this blog; there were four Sublayers listed, but no tables or other types of registered workspaces. However, I know that our ArcGIS Server administrator published a registered workspace here as well. Here’s a screenshot from ArcGIS Server Manager where you could do this configuration.
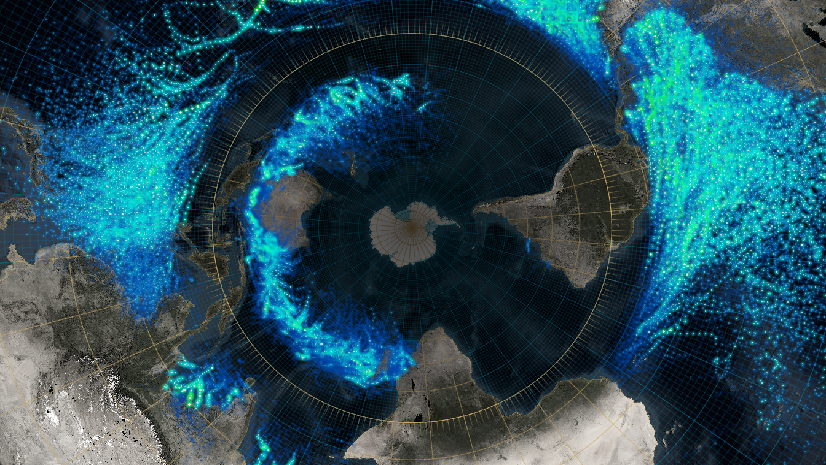
Here is a another sample app that illustrates the ability to create a DynamicDataLayer from a TableDataSource. This layer shows Railroads, and is initially turned off (visibility set to false). You can toggle on the visibility of Railroads by selecting the layer name at the bottom. There is also a dark-themed Legend, which is inordinately large in the embedded app, but normal size in the link to the sample above.
DynamicDataLayer
The renderer for the Railroad layer is similar to that of the other layers. The interesting part is how the Railroad is added as a Sublayer. Notice that everything looks much the same, except we have a new property called dataSource. For a TableDataSource, the workspaceId is the workspace where the table resides as defined in the ArcGIS Server Manager. The dataSourceName is the name of the table in the registered workspace. Again, I get these values from our ArcGIS Server administrator who published the workspace. Lastly, if there are multiple versions of the geodatabase, the gdbVersion references the specific geodatabase version that we want to target. Here is a code snippet that shows this in action.
var railroadsRenderer = {
  type: "simple",  // autocasts as new SimpleRenderer()
  symbol: {
    type: "simple-line",  // autocasts as new SimpleLineSymbol()
    color: [255, 255, 255, 0.5],
    width: 2,
    style: "long-dash-dot-dot"
  },
  label: "Railroad"
};

/*...*/

layer = new MapImageLayer({
  portalItem: {  // autocasts as new PortalItem()
    id: "e7e03ad8f72b42709e7d63dde8c6c3f5"
  },
  sublayers: [
  {
    id: 2,
    title: "States",
    visible: true,
    renderer: statesRenderer
  }, {
    id: 1,
    title: "Highways",
    visible: true,
    renderer: highwaysRenderer
  }, {
    id: 4,
    title: "Railroads",
    visible: false,
    renderer: railroadsRenderer,
    source: {
      // indicates the source of the sublayer is a dynamic data layer
      type: "data-layer",
      // this object defines the data source of the layer
      // in this case it's a feature class table from a file geodatabase
      dataSource: {
        type: "table",
        // workspace name
        workspaceId: "MyDatabaseWorkspaceIDSSR2",
        // table name
        dataSourceName: "ss6.gdb.Railroads"
      }
    }
  }, {
    id: 0,
    title: "Cities",
    visible: true,
    renderer: citiesRenderer,
    definitionExpression: "pop2000 > 50000"
  }]
});
MapImageLayer and FeatureLayer
A common question we get asked while talking about MapImageLayer is: “When do I use MapImageLayer instead of FeatureLayer?”
Here are the three main reasons people typically choose MapImageLayer instead of FeatureLayer:
- Server-side processing of MapImageLayer can improve the speed and performance of the application
- Rendering and labeling use cases that are not supported on the client
- Ability to display and interrogate features in registered workspaces
Because the FeatureLayer requires downloading the features to the client for processing, the MapImageLayer can be more performant in some use cases. There are several factors that affect speed and performance, so this will not be true for every application. Similarly, some rendering (e.g. military symbology) might not be supported on the client, so choosing MapImageLayer and server-side processing would be the best solution, regardless of performance. Lastly, the ability to display, query, and join data in registered workspaces is a powerful ability that MapImageLayer offers to developers.
However, for all their differences, the 4.x API introduced a lot of commonality between these two classes as well. Both MapImageLayers and FeatureLayers can be created from an ArcGIS portal item ID. If working with a service URL, MapImageLayers can only be created from a MapServer, while FeatureLayers can be created from a MapServer or a FeatureServer. While a MapServer or FeatureServer can have multiple FeatureLayers, a MapServer will typically only have one MapImageLayer with one or more Sublayers (each Sublayer can be thought of as the URL equivalent to a FeatureLayer). Here’s an example from a MapServer:
Here is a code snippet that shows how to create a FeatureLayer for each layer in the MapServer:
require(["esri/layers/FeatureLayer"], function(FeatureLayer) {

  const layer_0 = new FeatureLayer({
    url: "https://sampleserver6.arcgisonline.com/arcgis/rest/services/USA/MapServer/0",
    title: "Cities"
  });

  const layer_1 = new FeatureLayer({
    url: "https://sampleserver6.arcgisonline.com/arcgis/rest/services/USA/MapServer/1",
    title: "Highways"
  });

  const layer_2 = new FeatureLayer({
    url: "https://sampleserver6.arcgisonline.com/arcgis/rest/services/USA/MapServer/2",
    title: "States"
  });

  const layer_3 = new FeatureLayer({
    url: "https://sampleserver6.arcgisonline.com/arcgis/rest/services/USA/MapServer/3",
    title: "Counties"
  });

  map.addMany([layer_2, layer_3, layer_1, layer_0])

});
And here is a code snippet that shows how to create a MapImageLayer from the same MapServer. The Sublayer IDs correspond to the URLs of the FeatureLayers:
require(["esri/layers/MapImageLayer"], function(MapImageLayer) {

  const layer = new MapImageLayer({
  url: "https://sampleserver6.arcgisonline.com/arcgis/rest/services/USA/MapServer",
    sublayers: [
     {
       id: 2,
       title: "States"
       visible: true
     }, {
       id: 3,
       title: "Counties"
       visible: true
     }, {
       id: 1,
       title: "Highways"
       visible: true
     }, {
       id: 0,
       title: "Cities",
       visible: true
     }
   ]
  });

  map.add(layer);

});
Notice that we added the FeatureLayers to the map in the same order that we ordered the Sublayers in the MapImageLayer constructor. This allows us to maintain a logical drawing order with the points (cities) on top, followed by highways (polylines), then counties (polygons) and lastly states (polygons) on the bottom.
Conclusion
MapImageLayer is a big deal. This blog reviewed some core concepts, and highlighted two use cases. If you’re looking for more examples, here is a link to the MapImageLayer samples we host on our site. Stay tuned for future blogs that will dive deeper into specific capabilities of the MapImageLayer class.


Commenting is not enabled for this article.