ArcGIS Monitor provides observability by collecting metrics on the health, performance, and usage of your enterprise GIS. It is designed to help system administrators and GIS managers ensure their ArcGIS Enterprise deployments and underlying infrastructure are working efficiently. Monitor helps reduce and prevent system downtime, resulting in operational cost savings.
ArcGIS Monitor 2026.1 has several new capabilities (see Figure 1) to help administrators proactively manage their enterprise GIS deployments:
- Support for ArcGIS Velocity in your own infrastructure and the spatiotemporal big data store
- Support for ArcGIS Enterprise on Kubernetes deployments
- Dependencies for referenced services are supported in component relationship graphs
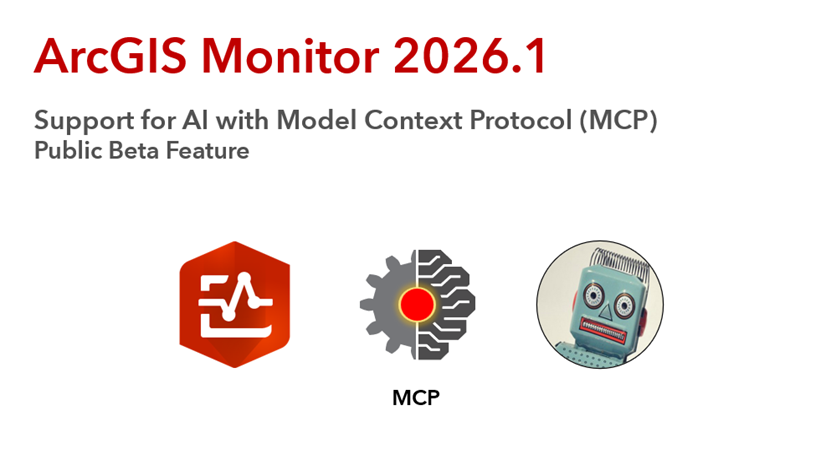
- Artificial Intelligence (AI) capability with Model Context Protocol (MCP) for ArcGIS Monitor – a public beta feature
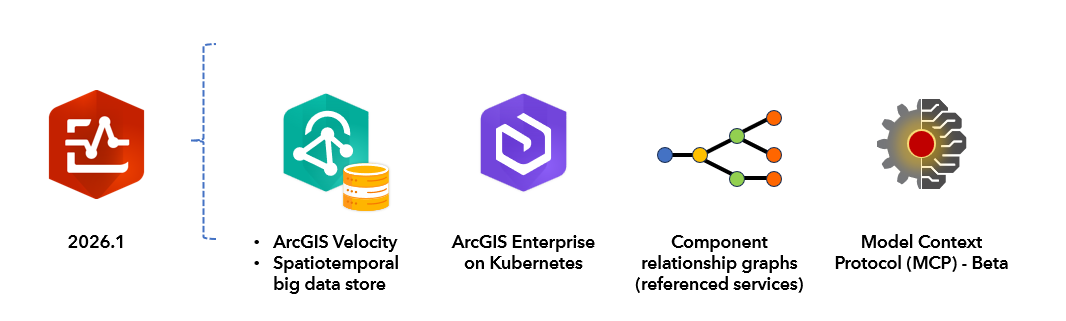
Figure 1: ArcGIS Monitor 2026.1 new features.
A complete list of updates is available in the ArcGIS Monitor 2026.1 release notes.
Support for ArcGIS Velocity in your own infrastructure and the spatiotemporal big data store
ArcGIS Velocity is a real-time data analytics capability for ArcGIS. Example use cases include managing vehicle fleet operations, reporting snowplow activity, and weather tracking. At the ArcGIS Enterprise 12.1 release, ArcGIS Velocity was enabled for self-hosted enterprise GIS deployments. This allows organizations to ingest, visualize, analyze, and act on streaming data from Internet of Things (IoT) sensors, moving assets, and event streams as part of their enterprise GIS.
ArcGIS Monitor 2026.1 can register and collect data from an ArcGIS Velocity 12.2 instance to help proactively manage Velocity. When a Velocity instance has been registered with Monitor, it will appear as a new component type on the Monitoring page, see Figure 2.
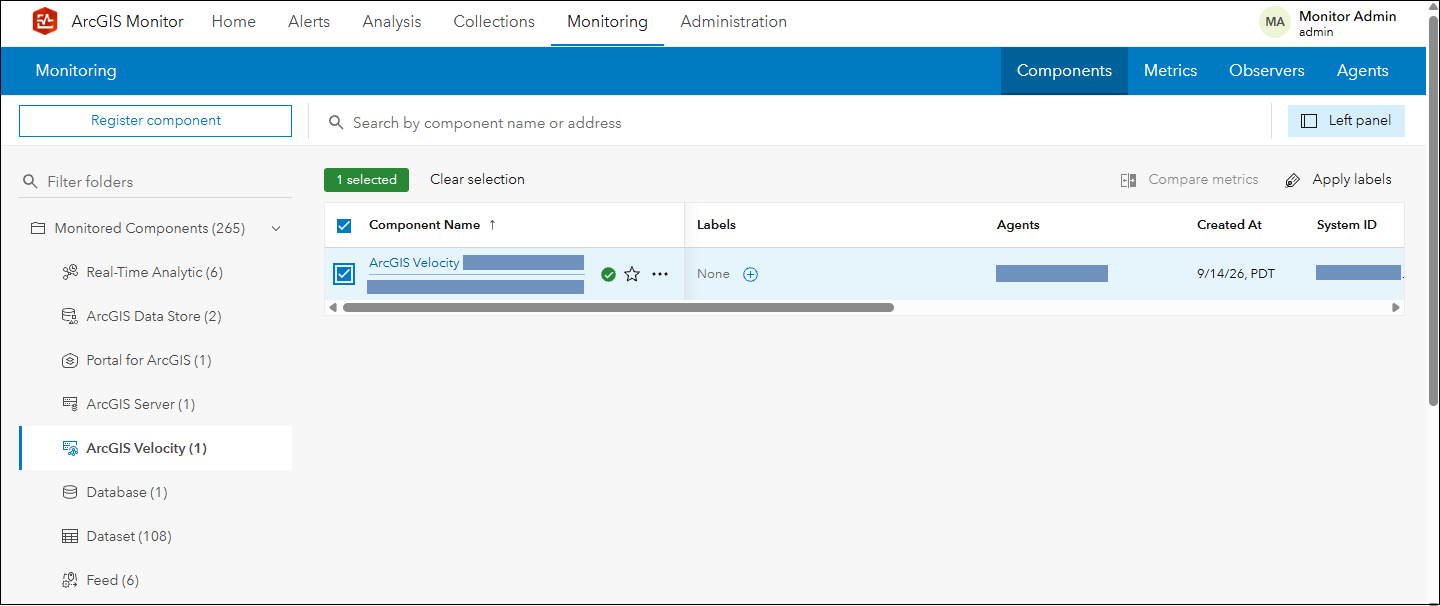
Figure 2: ArcGIS Velocity registered with ArcGIS Monitor 2026.1.
Viewing the Overview tab for a Velocity component will display several key performance indicators (KPIs): release version, the number of feeds, outputs, real-time analytics, CPU and memory utilization, see Figure 3. These KPIs provide a high-level overview of the Velocity instance’s status and performance.
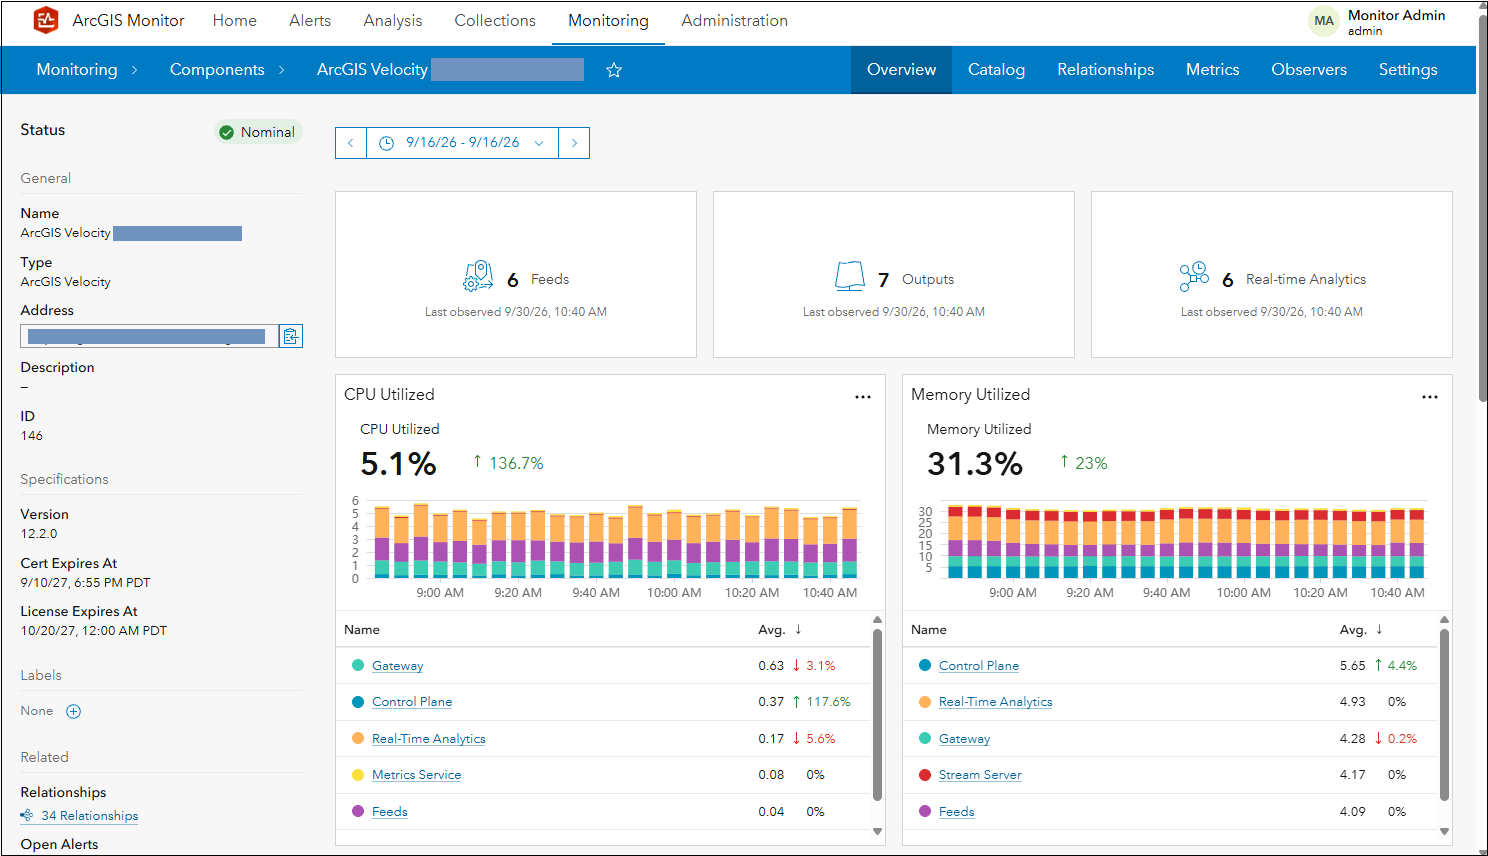
Figure 3: ArcGIS Velocity component Overview tab.
This Velocity instance has six feeds (i.e., real-time data streams), seven outputs, and six real-time analytics (i.e., analytic workflows). Under the CPU and memory utilization charts, the six system processes that comprise Velocity and consume the respective resources (of the Velocity host machine) are listed in the order of their average consumption. In Figure 3, the Gateway process has the highest average CPU utilization over the time range with 0.63%, then Control Plane process 0.37%, then Real-Time Analytics process 0.17%, then Metrics Service process 0.08%, then Feeds process 0.04%, and lastly Stream Server process (not shown). For some of the processes there is an indicator showing if usage is increasing (green arrow pointing up) or decreasing (red arrow pointing down) and a percentage. For example, the Gateway process has decreased 3.1% and the Control Plane process has increased by 117.6%, compared to the previous time range (in this case, approx. 2.5 hours). Learn more about the six ArcGIS Velocity processes that support the Velocity instance here.
Scrolling down the Overview tab, three additional KPIs are shown (see Figure 4):
- Feature rate – the frequency and volume at which features or sensor observations are received, ingested, and processed (features/second);
- Attribute rate – the frequency and volume at which attribute (fields or data points) are received, ingested, and processed (attributes/second); and
- Bytes processed – a measure of data volume processed (bytes/second).
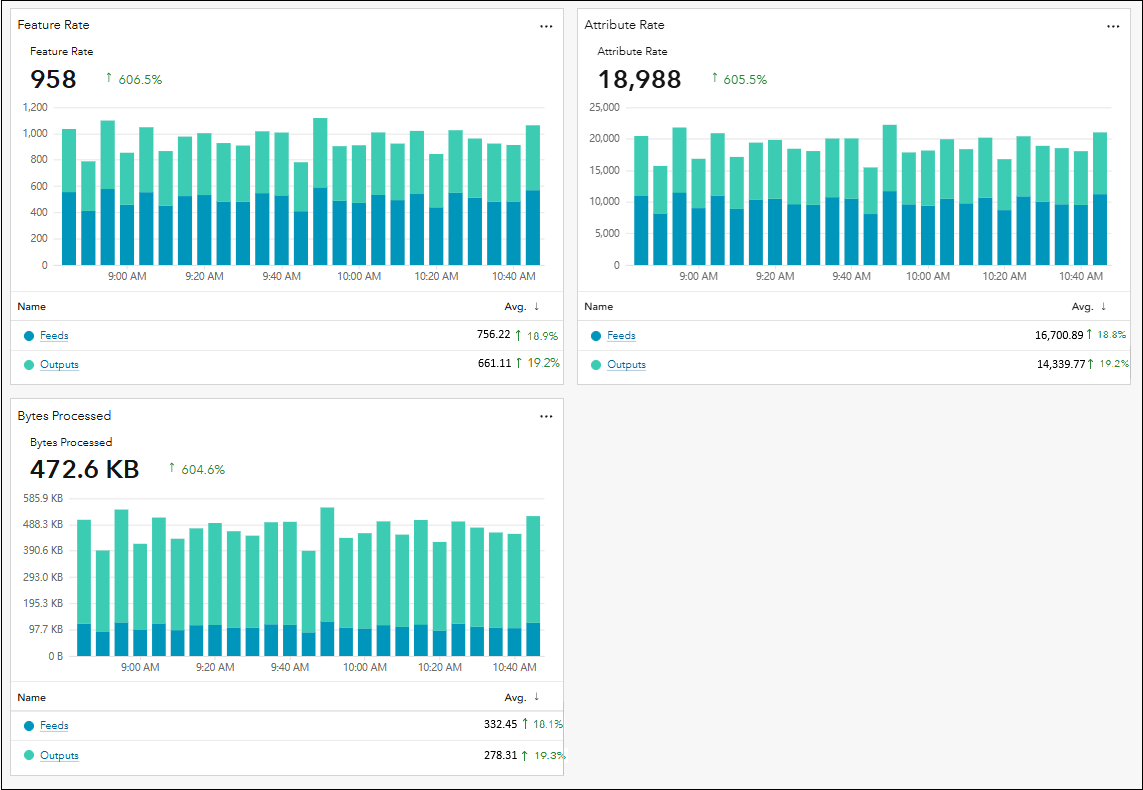
Figure 4: Other KPIs on the ArcGIS Velocity component Overview tab.
Note these metrics display the sum of the incoming and outgoing metric properties. In Figure 4, Feature rate represents the sum of Feature rate in (ingested) by all six feeds and Feature rate out (emitted) by the seven outputs for Velocity. Under each chart, the feeds and outputs are shown separately along with their average values and trend indicators. Learn more about ArcGIS Velocity metrics here.
System load on ArcGIS Velocity generally increases with feature rate. Higher feature rates increase processing demand and can require additional compute, memory, and disk space. The size and complexity of features, including their attributes and geometries, and the analyses performed also affects resource usage. The Overview tab allows you to view these metrics for the entire Velocity instance, but KPI metrics can also be viewed for individual feeds and outputs.
When you view the Catalog tab for ArcGIS Velocity, you will see all of its child components (these represent additional assets that are associated with a Velocity instance). This includes: Feed, Output, Real-Time Analytic, and Service, see Figure 5.
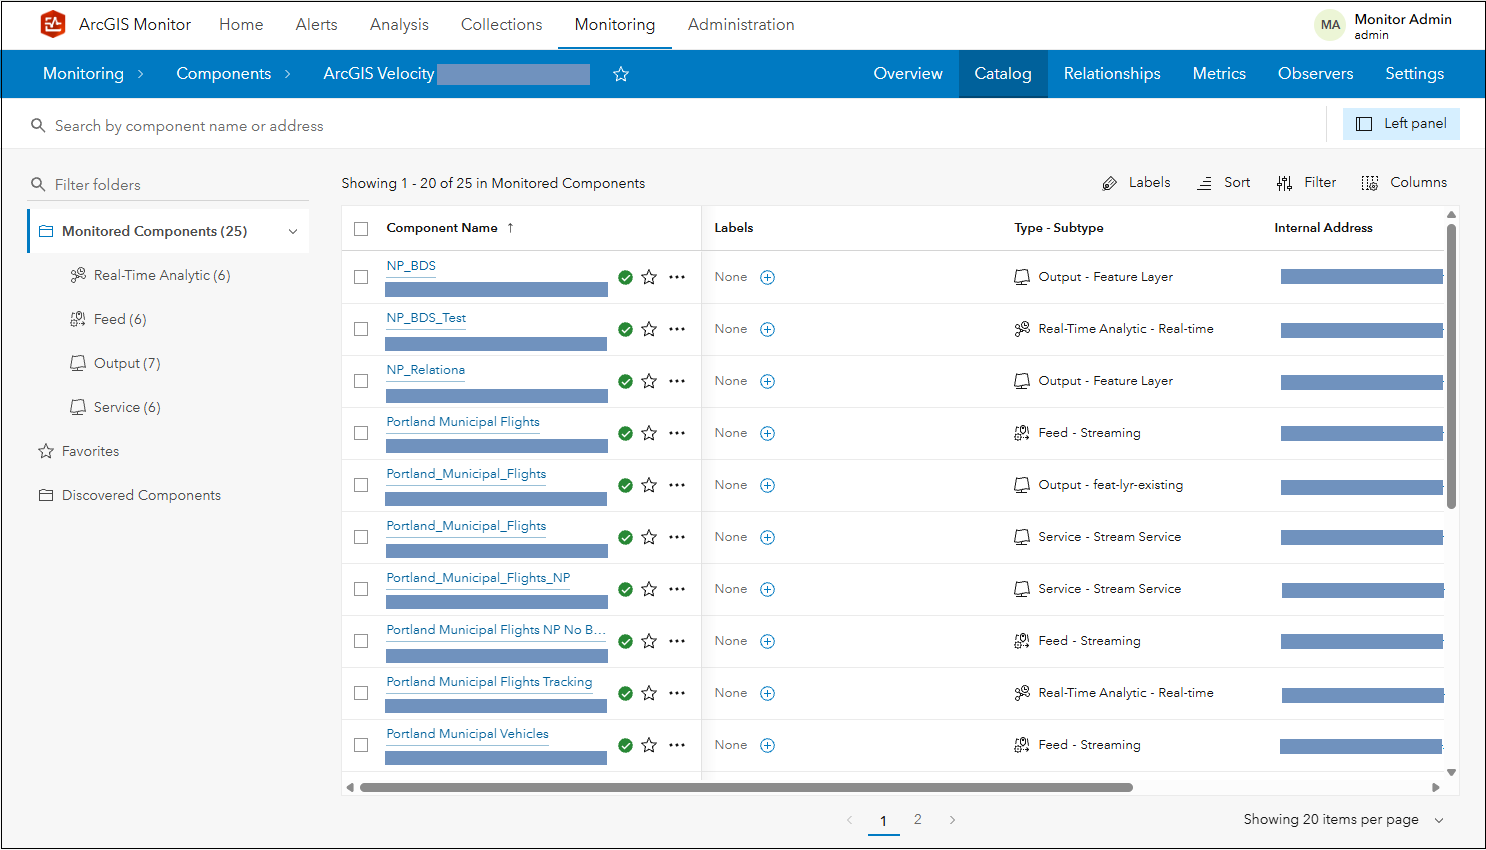
Figure 5: Other components related to ArcGIS Velocity.
Feed components are the real-time data being ingested into ArcGIS Velocity. They typically connect to external sources of observational data such as IoT platform sensors, message brokers, or third-party APIs. A Feed has four metrics: Feature rate, Attribute rate, Bytes processed, and Error Rate.
Output components are the final result or action emitted from a Real-time Analytic process in ArcGIS Velocity. This could be storing data in a feature layer or sending an email alert. An Output has three metrics: Feature rate, Attribute rate, and Bytes processed.
Real-time Analytic components represent a continuous processing capability on ingested data in ArcGIS Velocity. The input data is analyzed as it is received, and the process could transform the data, apply a geofence, and/or detect incidents. Its Feature rate, Attribute rate, and Bytes processed metrics are composed of both the Feed and Output components that it uses.
Figure 6 illustrates the relationship between Feed, Output, and Real-time Analytic components. It displays the component relationship graph of the Portland Municipal Vehicle Tracking real-time analytic component, which uses the Portland Municipal Vehicle feed as its input component and the Portland_Municipal_Vehicle_Layer as its output component.
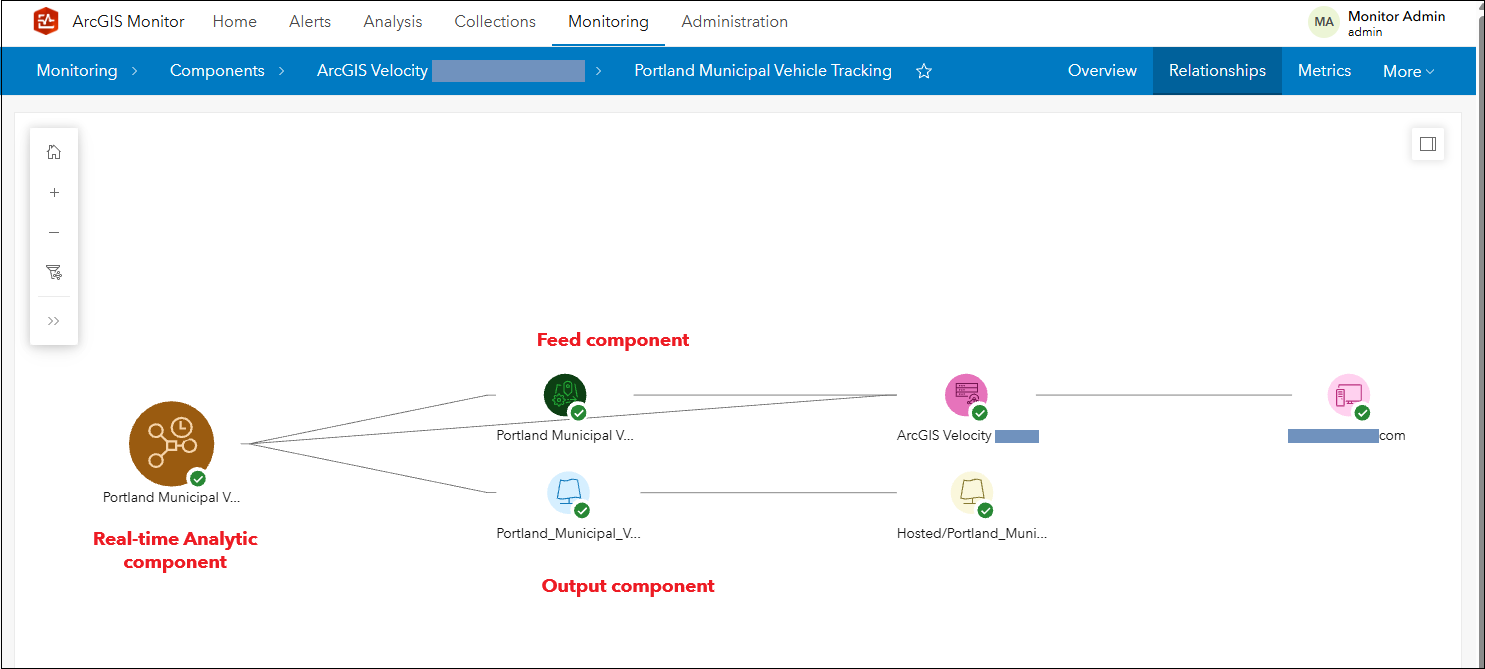
Figure 6: Portland Municipal Vehicle Tracking component relationship graph.
The fourth child component associated with ArcGIS Velocity is Service, in this instance, a stream service. A stream service provides low-latency delivery of real-time data to subscribed clients over WebSocket connections, enabling immediate visualization in ArcGIS. Stream service components have two metrics: Request rate and Connected users.
ArcGIS Velocity and its various associations and dependencies can be visualized as a component relationship graph in ArcGIS Monitor, see Figure 7. The green icons represent Feed components, the light blue icons represent Output components, the brown icons represent Real-Time Analytic components, and the yellow icons (directly connected to ArcGIS Velocity) represent the stream services.
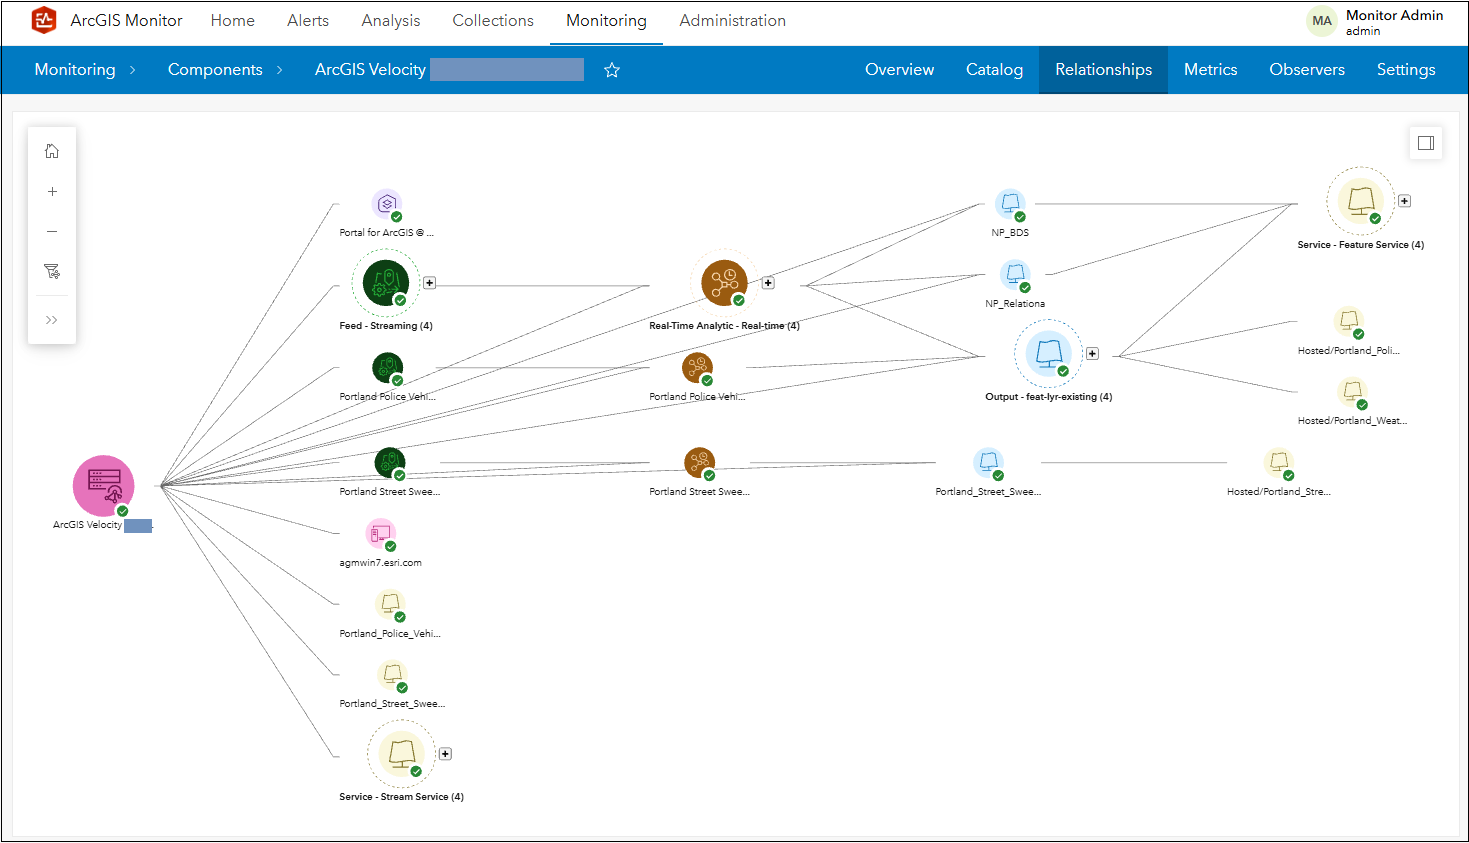
Figure 7: ArcGIS Velocity component relationship graph.
Associated with ArcGIS Velocity is the spatiotemporal big data store, which is a specialized deployment of the ArcGIS Data Store, designed to manage high-volume observational data. It is registered as a separate component from Velocity and will appear as an ArcGIS Data Store component type in ArcGIS Monitor, see Figure 8. Monitor supports the spatiotemporal big data store from version 11.0 and higher.
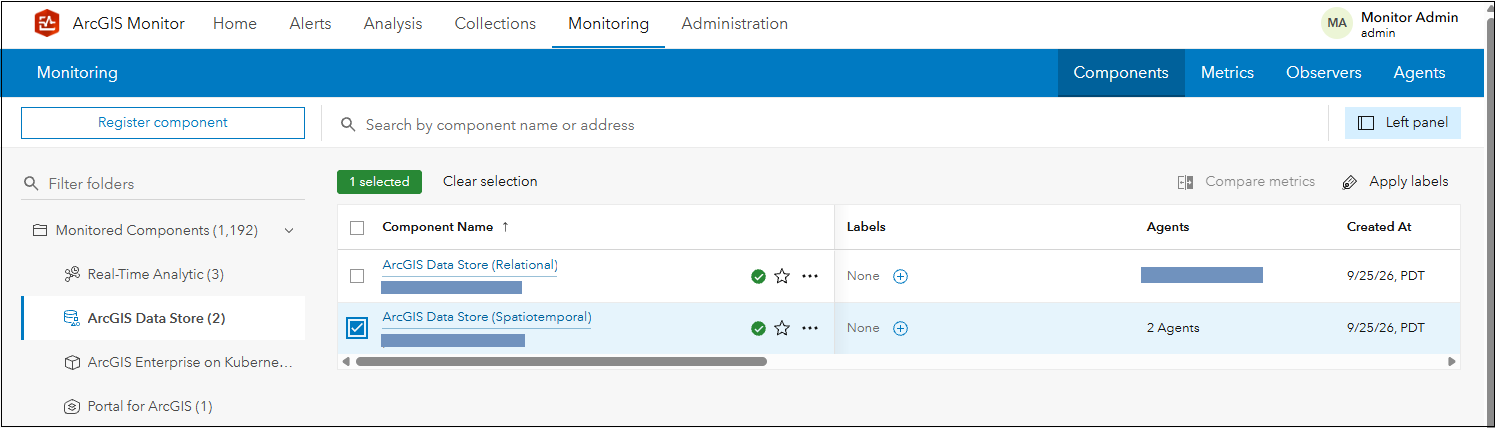
Figure 8: Spatiotemporal big data store component in ArcGIS Monitor 2026.1.
The Overview tab for the spatiotemporal big data store component is divided into three sections: health overview, performance, and infrastructure. Health overview displays alerts for all associated metrics and “at risk” items – these are dataset components in the spatiotemporal big data store that have a critical alert(s). “At risk” items should be investigated to avoid possible performance issues. The performance section (see Figure 9) includes: Write rate, Write response time, Query rate, and Query response time metrics. It also displays the top 5 (or bottom 5) datasets for each metric.
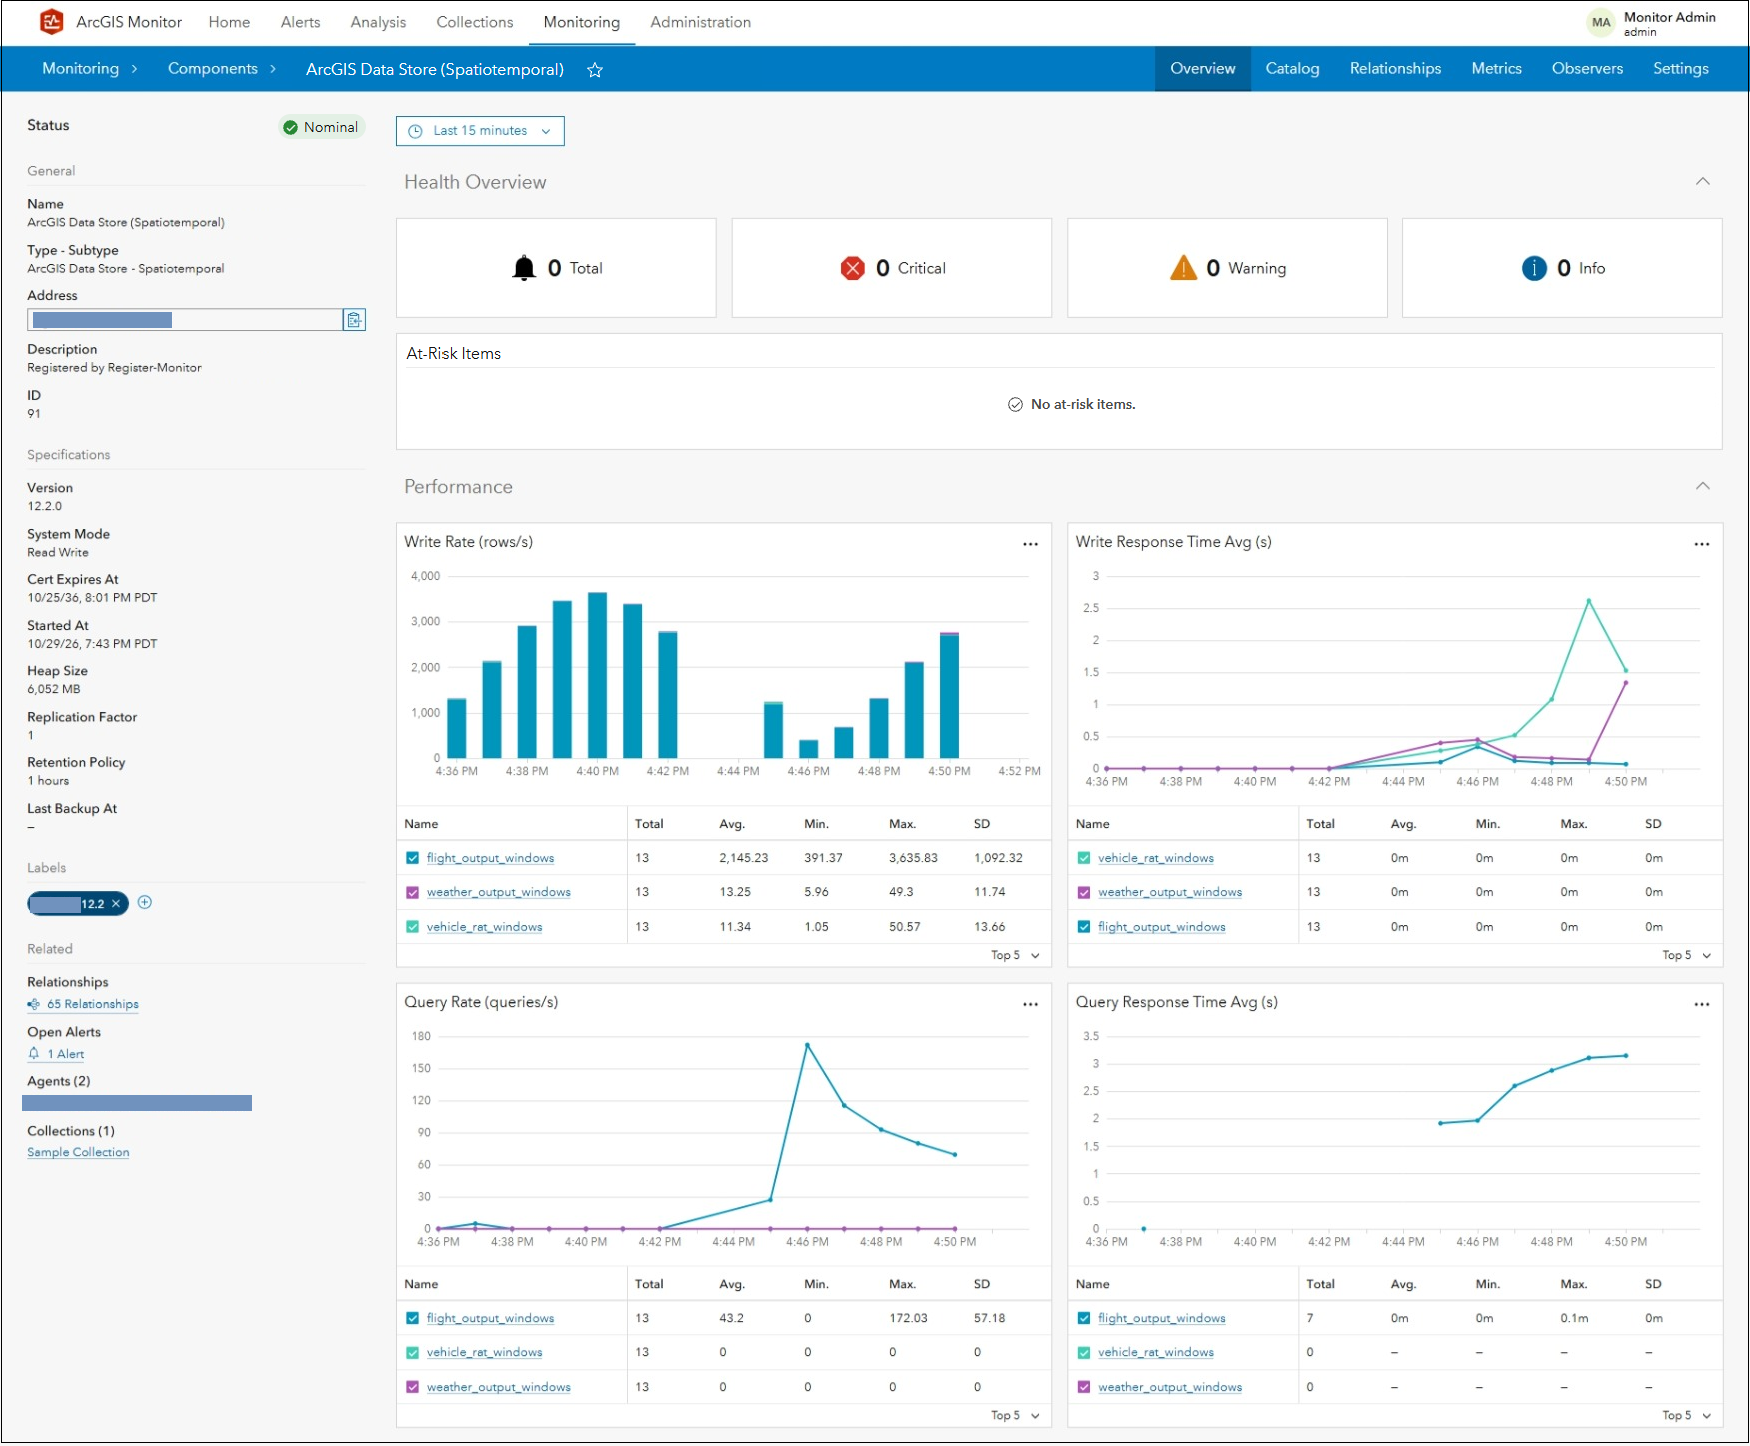
Figure 9: Spatiotemporal big data store Overview tab.
The infrastructure section displays CPU and memory utilization, storage capacity available, and storage read rate/write rates, see Figure 10.
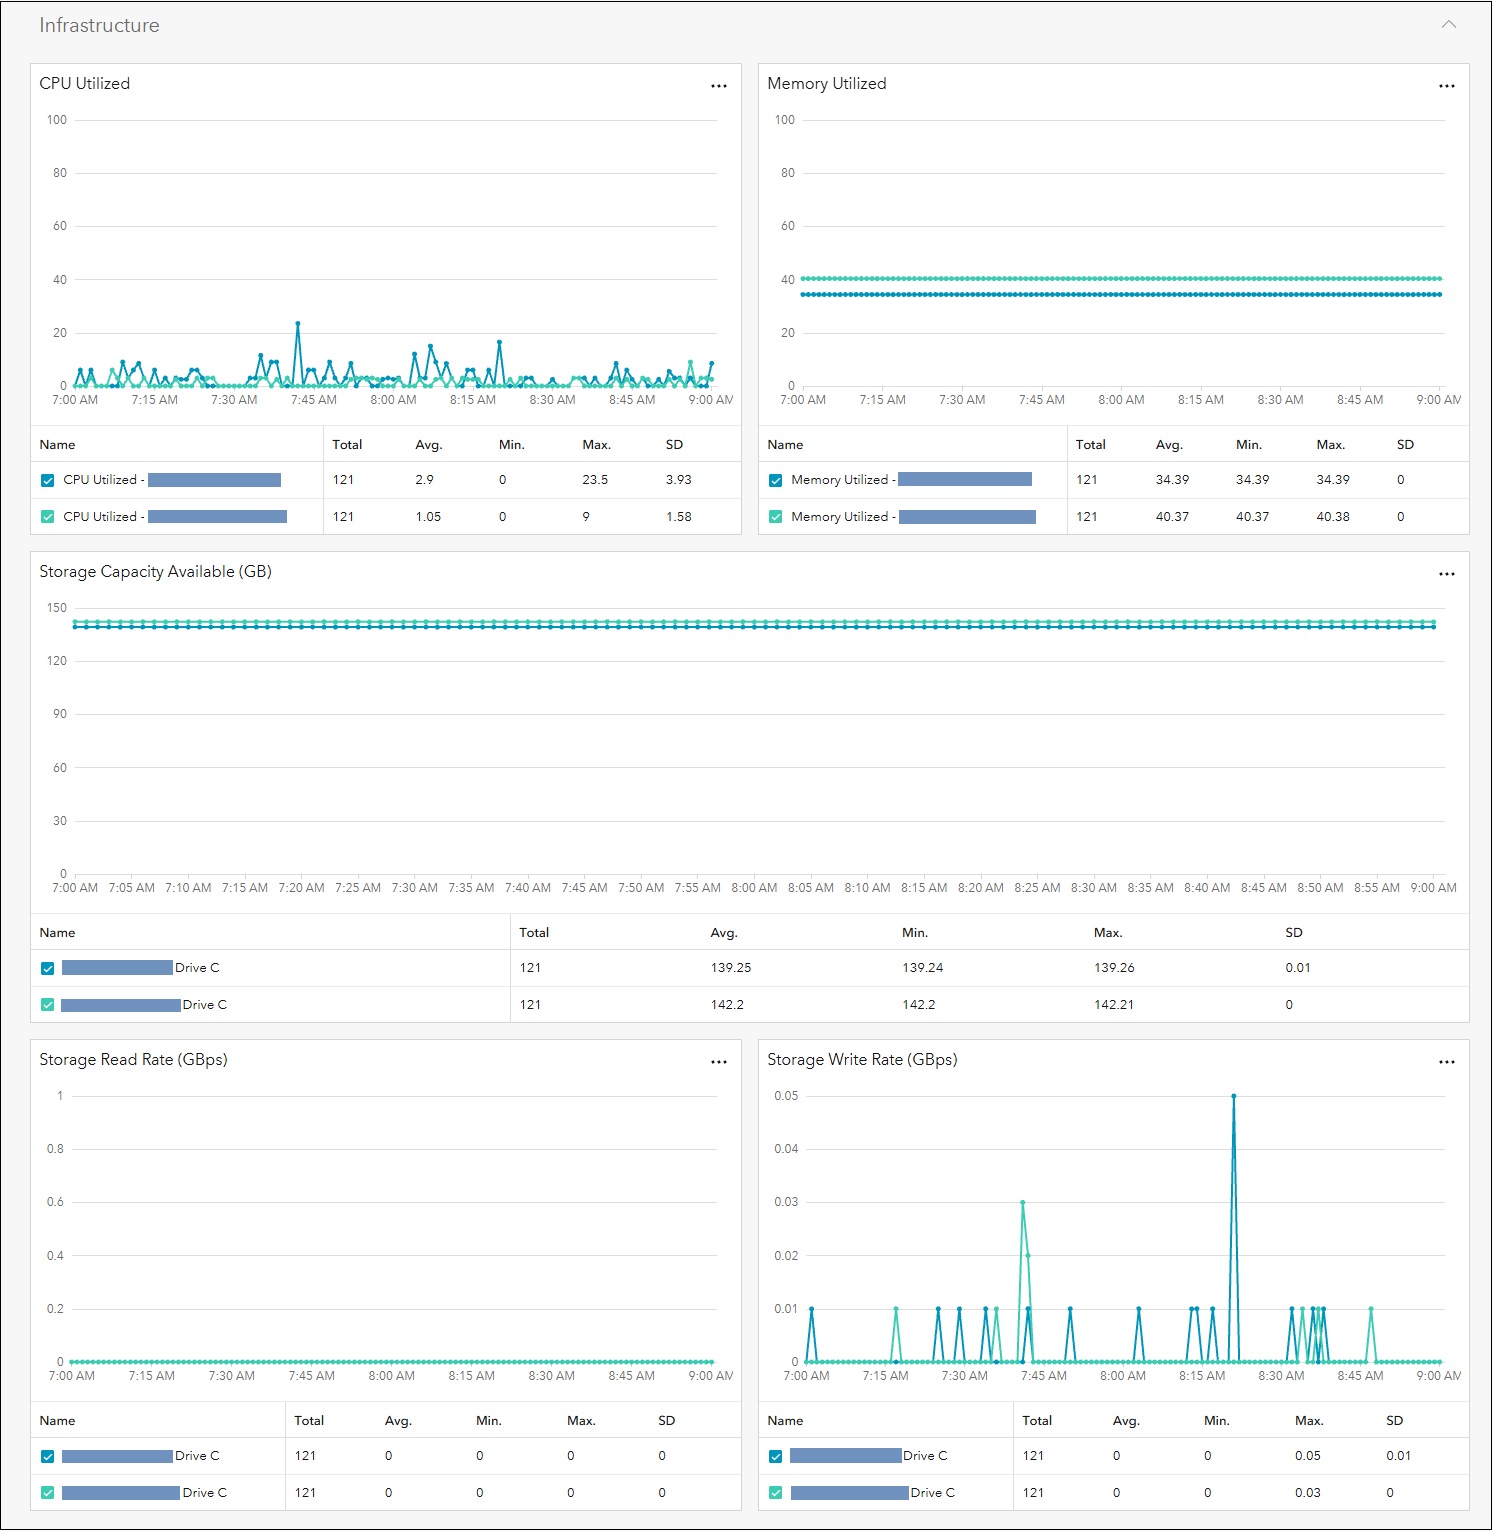
Figure 10: Spatiotemporal big data store infrastructure metrics.
Navigating to the spatiotemporal big data store’s Catalog tab will display all of the dataset components it contains, see Figure 11. From this panel, a specific dataset component can be selected to view its metrics: Total rows, Storage used, Write rate, Write response time, Query rate, and Query response time.
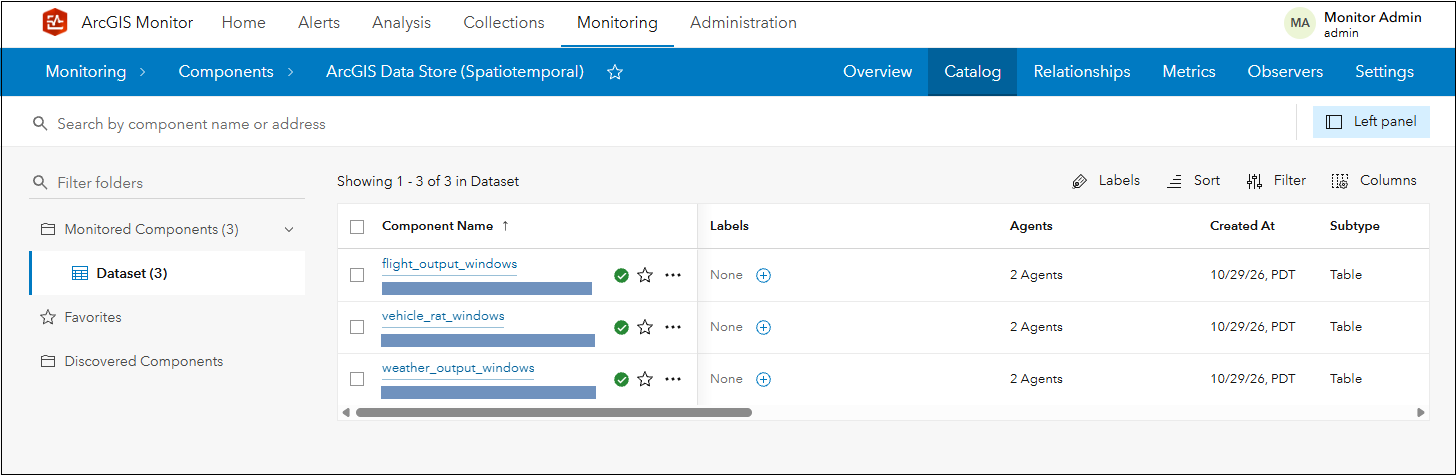
Figure 11: List of dataset components in the spatiotemporal big data store.
Alerts and notifications can be configured for all collected metrics for both ArcGIS Velocity and the spatiotemporal big data store to enable proactive management for system health and performance.
Support for ArcGIS Enterprise on Kubernetes deployments
More organizations are adopting Kubernetes as their ArcGIS Enterprise deployment platform. In ArcGIS Monitor 2026.1, administrators and GIS managers can register and collect KPIs for ArcGIS Enterprise on Kubernetes deployments. A new option is available in the component registration dialog (see Figure 12):
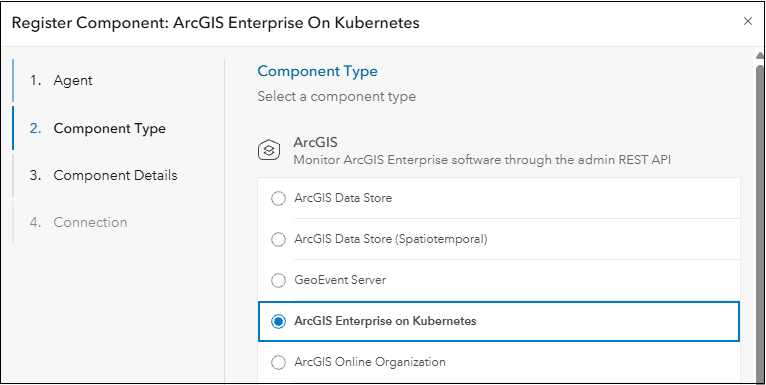
Figure 12: ArcGIS Monitor 2026.1 component registration dialog.
When registering ArcGIS Enterprise on Kubernetes, there are three sets of credentials that can be submitted. The first set of credentials are used to login and access the ArcGIS Enterprise instance and its logs. The second set is credentials for Prometheus (a monitoring endpoint), to allow Monitor to collect service requests, response times, wait times, errors, and instance metrics. The third set includes the Kubernetes API server URL and service account bearer token to the Kubernetes instance, which enables Monitor to collect Kubernetes infrastructure metrics. This includes: the pod phase and count, CPU and memory utilization, ResourceQuota limit utilization, and cluster node utilization. Credentials for both Prometheus and Kubernetes are optional; however, if they are not provided then Monitor will not report on these KPIs. Learn more about registering ArcGIS Enterprise on Kubernetes with ArcGIS Monitor here.
Side note: ArcGIS Enterprise on Kubernetes uses Prometheus, an open-source systems monitoring toolkit as part of its built-in monitoring and metrics collection system. ArcGIS Monitor 2026.1 can utilize the metrics collected by Prometheus.
After registration, a new component type called ArcGIS Enterprise on Kubernetes appears on the Monitoring page, see Figure 13.
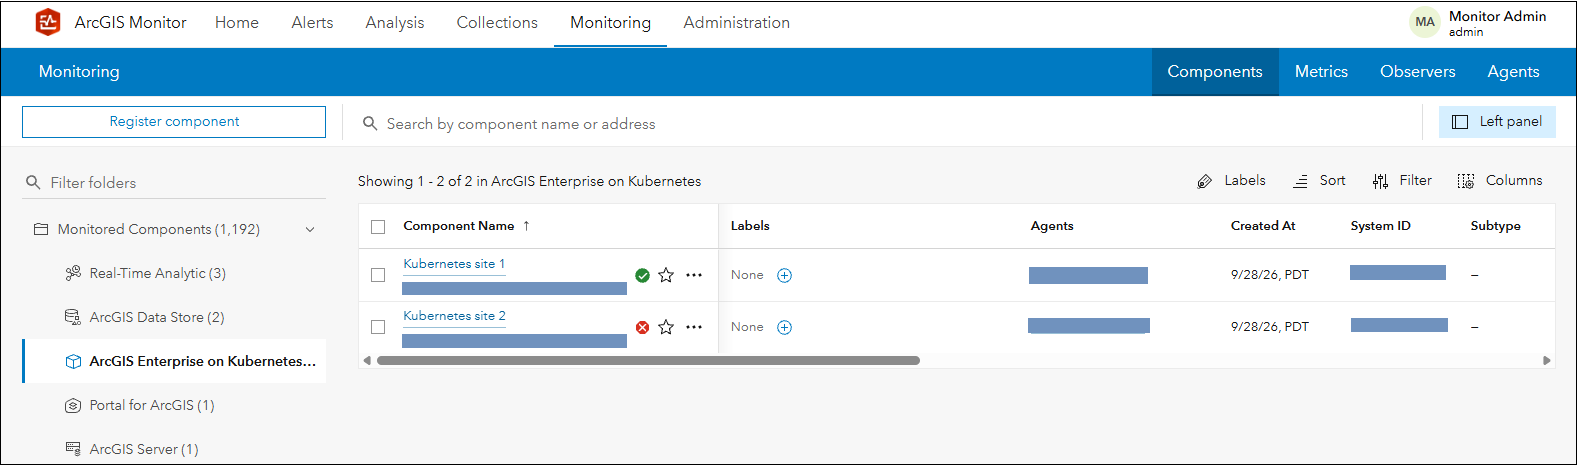
Figure 13: New ArcGIS Enterprise on Kubernetes component type in ArcGIS Monitor 2026.1.
FYI: ArcGIS Enterprise on Kubernetes deploys with a collection of pods within a single namespace in a Kubernetes cluster. A detailed discussion on ArcGIS Enterprise on Kubernetes architecture is beyond the scope of this blog, but you can learn more here.
For the ArcGIS Enterprise on Kubernetes component, the Overview tab is divided into four sections: health overview, application usage, service load and performance, and infrastructure. The health overview section displays alert indicators and all subsystems and services that participate in the Kubernetes cluster visually, see Figure 14.
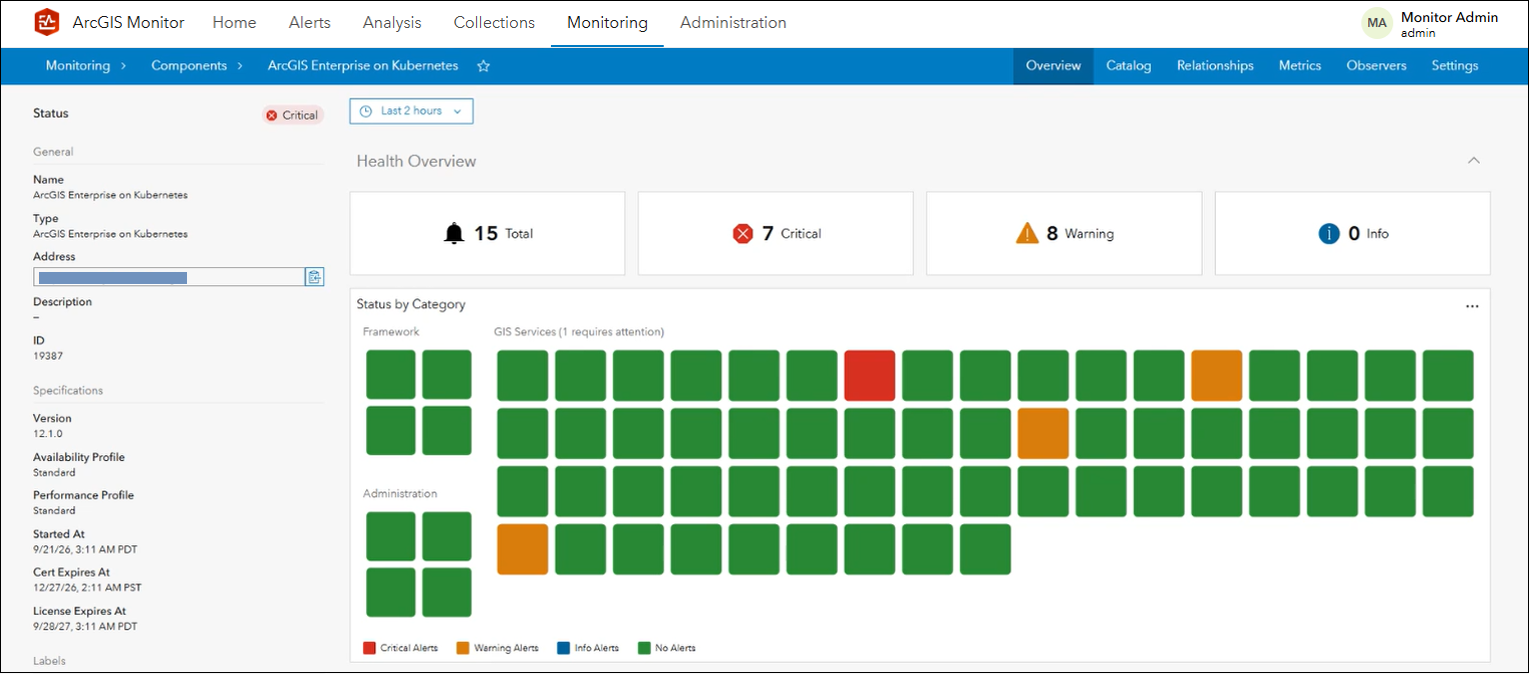
Figure 14: Overview tab for ArcGIS Enterprise on Kubernetes component.
The Status by Category display is separated into three sections: framework, administration, and GIS services. Each square icon represents a pod that comprises the ArcGIS Enterprise deployment. The pods are colored based on their status. Green indicates no alerts, blue indicates info alerts (none shown), yellow indicates warning alerts, and red displays critical alerts. In Figure 14, the ArcGIS Enterprise instance is composed of 68 pods; one pod has a critical alert, three pods have warning alerts, and the remaining have no alerts (e.g., nominal status). Beside the GIS services section title, there is text indicating that one service requires attention.
Figure 15 displays a close-up view of the framework and administration subsystems. The framework category contains pods for ingress controller, services API, help, and apps. The ingress controller pod directs traffic between pods within the cluster. The services API pod supports publishing and caching workflows. Learn more about the framework pods here. The administration category contains subsystems for admin API, portal, manager, and portal API. These pods provide the initial framework to create an ArcGIS Enterprise deployment and can be scaled as the deployment grows. Learn more about administration pods here.
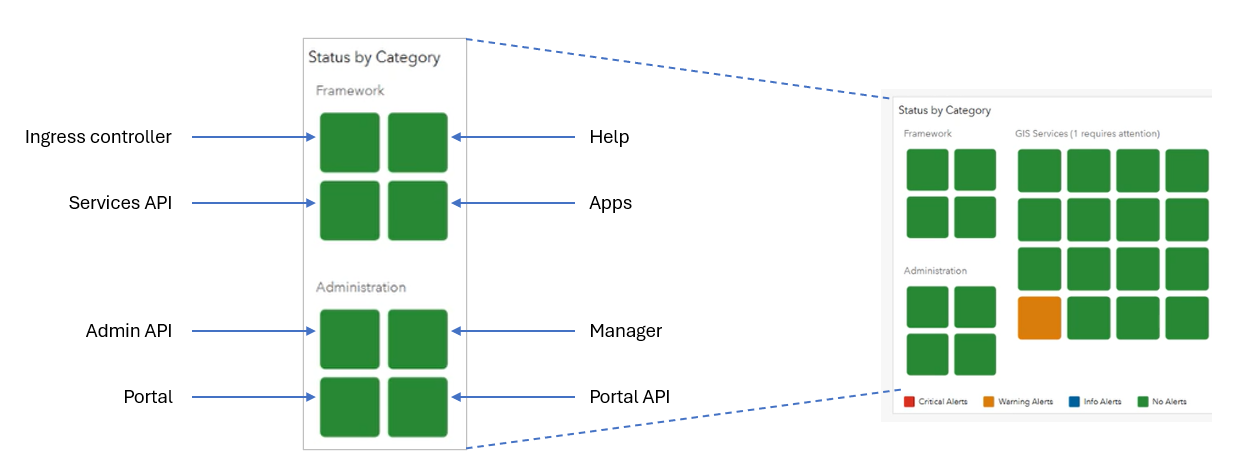
Figure 15: Close up of the Framework and Administration subsystem categories.
The GIS services category displays all the pods that enable services for the ArcGIS Enterprise on Kubernetes deployment. The number of pods in this category will vary depending on the service count. Note that services in a shared instance pool could be spread across several pods, while services with dedicated instances will have dedicated pods. You can hover your cursor on one of the pods to view more information about its status. In Figure 16, it appears the AerialImagery2025 service pod has several critical alerts.
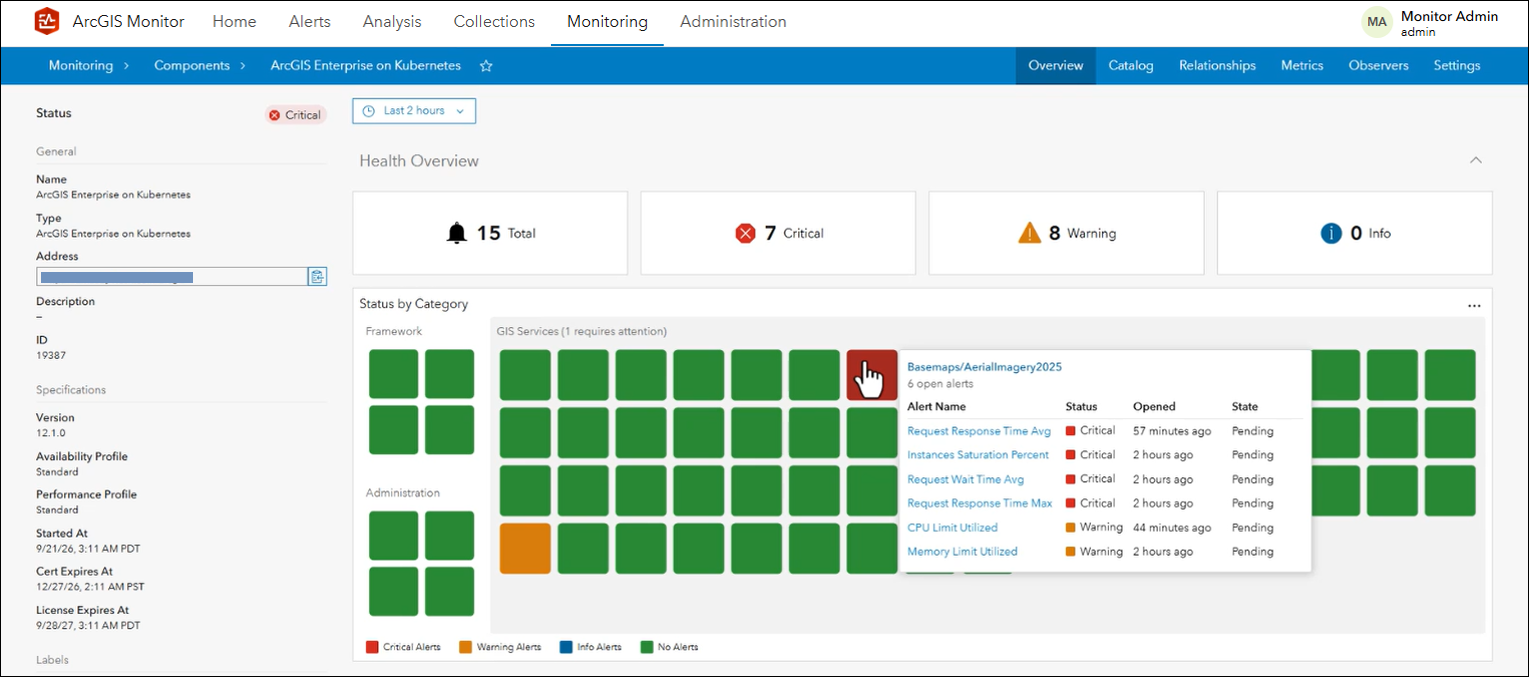
Figure 16: Revealing more information on the service with a critical status.
The application usage section of the Overview tab (see Figure 17) displays the Active Sessions and Active Sessions Time metrics for the top 5 web apps and/or web maps in the ArcGIS Enterprise instance, for the specified time range (e.g. last 2 hours, the default). ArcGIS Monitor collects this data from the ingress controller logs.
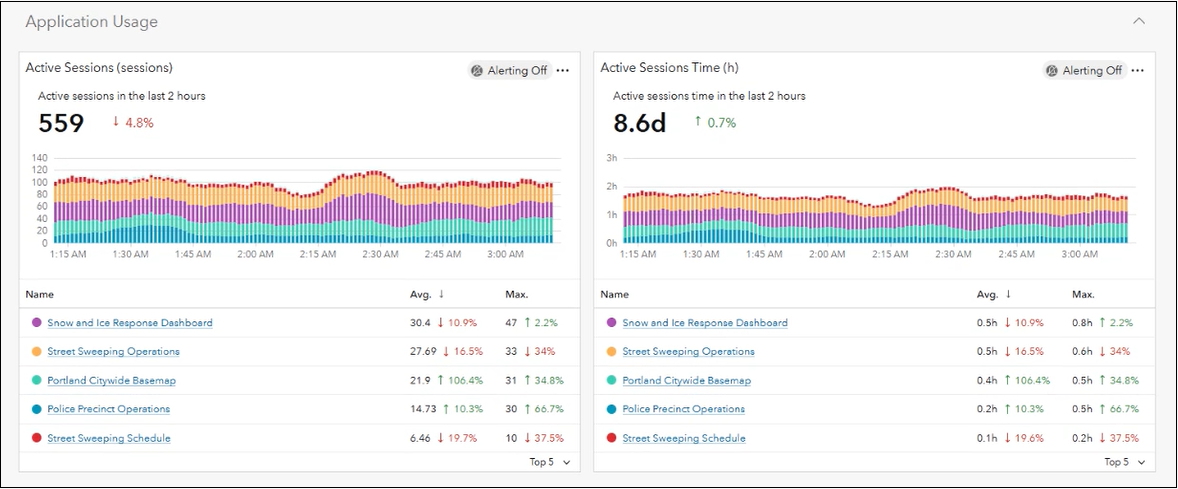
Figure 17: Application Usage metrics for ArcGIS Enterprise on Kubernetes.
Below the serial charts, the top 5 most used web apps and/or web maps are listed for each metric. To the right of the values, there is an indicator showing if usage is increasing (green arrow pointing up) or decreasing (red arrow pointing down) and a percentage. For example, the Police Precinct Operations app has increased by 10.3% and the Street Sweeping Schedule app has decreased by 19.7% compared to the previous time range (2 hours). In the lower right corner of each list, you can change the list to display the bottom 5 (or least used) web apps and/or web maps for each metric.
The service load and performance section displays the Request Rate and Request Response Time Average metrics for the services running on the ArcGIS Enterprise instance, see Figure 18. Underneath each chart, the services are listed along with their respective metric values. Detailed metrics for individual services can be viewed by selecting it from the list. These metrics are enabled in ArcGIS Monitor by accessing the ArcGIS Enterprise on Kubernetes Prometheus endpoint.
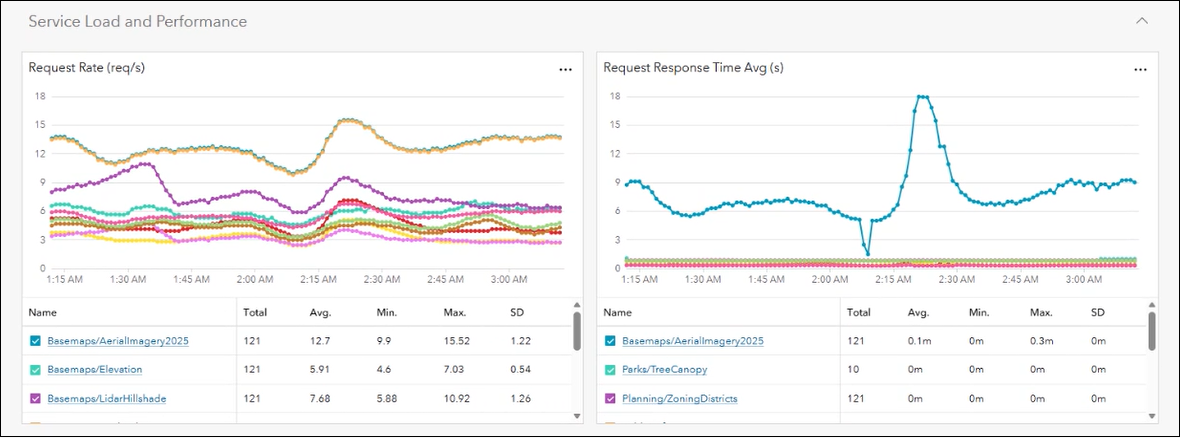
Figure 18: Service load and performance metrics for ArcGIS Enterprise on Kubernetes.
The infrastructure section shows CPU and memory utilized on the namespace and cluster. It also displays the pod count and how many are being utilized, see Figure 19. These metrics are accessed via the Kubernetes API server URL, and you can learn more about these metrics here.
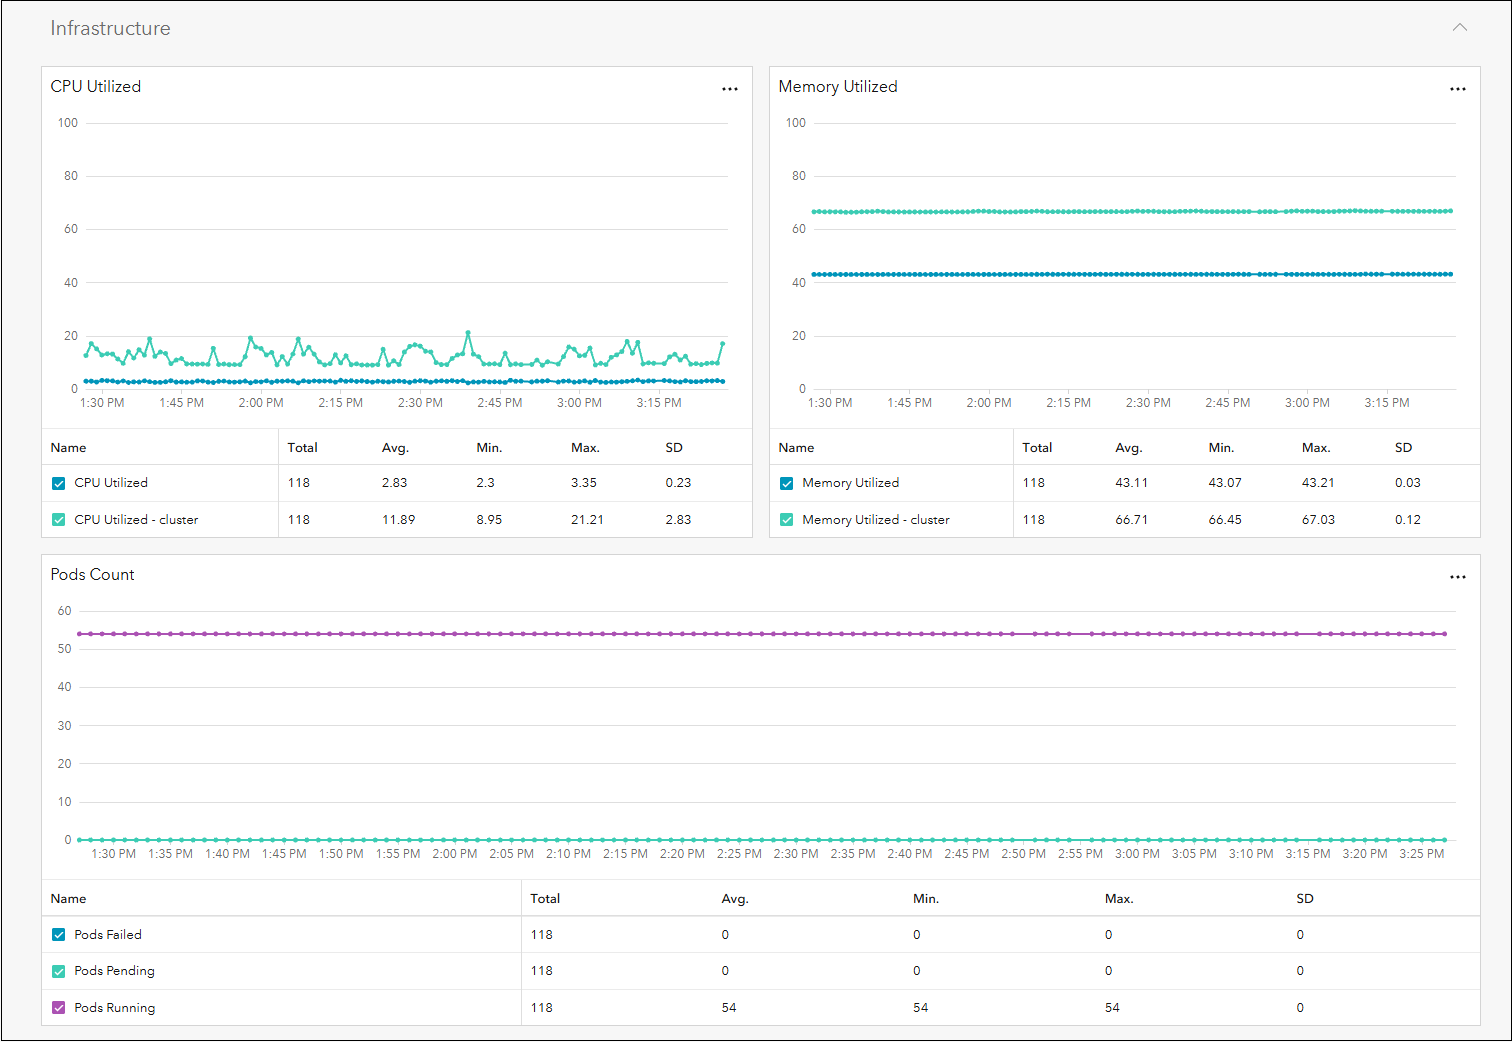
Figure 19: Infrastructure metrics for ArcGIS Enterprise on Kubernetes.
Alerts and notifications can be set for all ArcGIS Enterprise on Kubernetes reported metrics in ArcGIS Monitor. This can help you proactively manage the ArcGIS Enterprise deployment and be notified when certain KPIs exceed acceptable threshold values. Note the observability capabilities from ArcGIS Monitor are not intended to replace the existing observability capabilities in ArcGIS Enterprise for Kubernetes, but supplement them, to provide admins with more visibility into the enterprise GIS.
Navigating to the Catalog tab displays all the services, web apps, and web maps in the ArcGIS Enterprise instance, see Figure 20. Note the screenshot is from a different ArcGIS Enterprise on Kubernetes instance than the one discussed in Figures 14 – 18; this is why the service count is different.
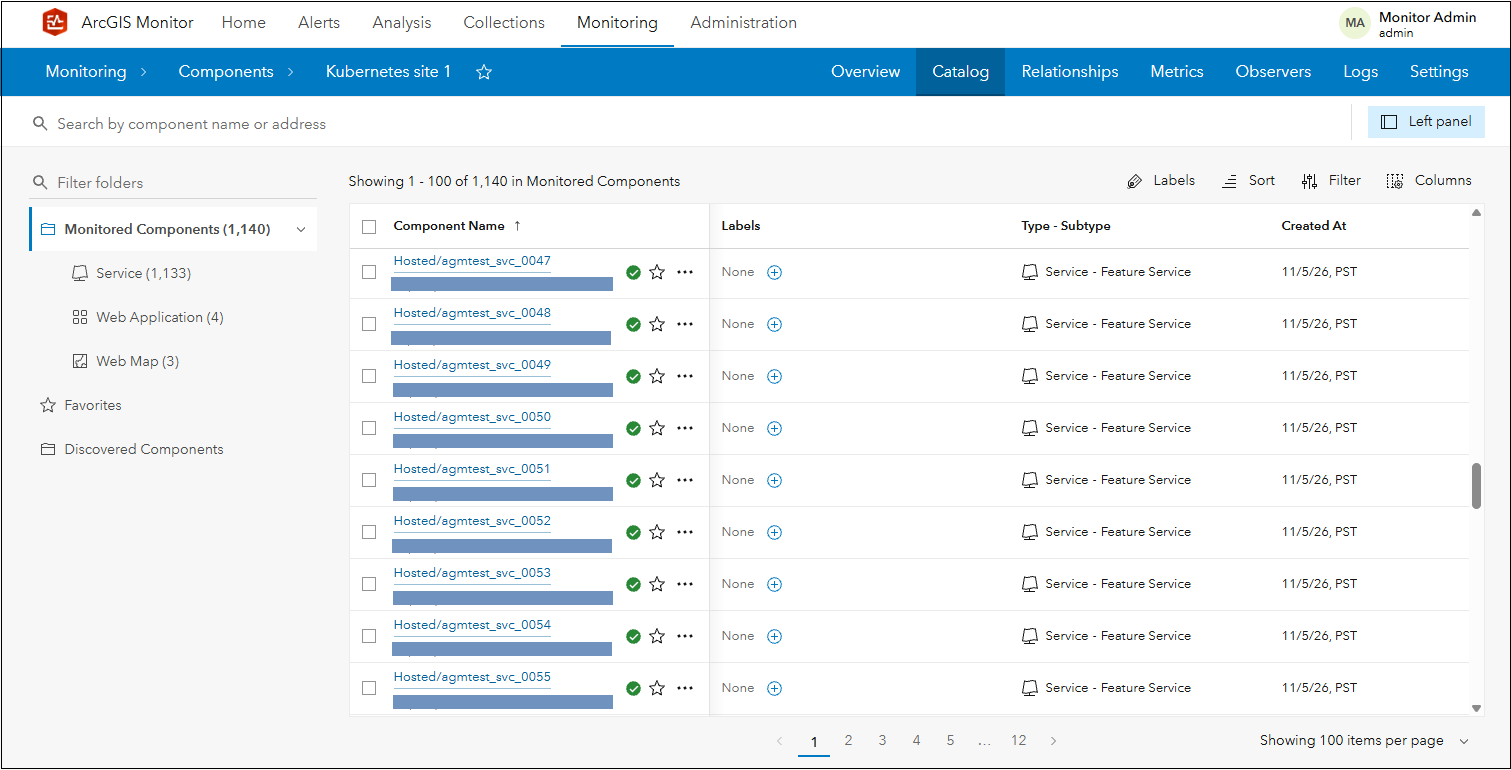
Figure 20: ArcGIS Enterprise on Kubernetes component Catalog tab.
The KPI metrics reported for services, web apps, and web maps are the same as for ArcGIS Enterprise on Windows and Linux deployments. Alerts and notifications can be configured for all of these metrics to help proactively manage the ArcGIS Enterprise instance.
Services from ArcGIS Enterprise on Kubernetes can be identified in ArcGIS Monitor by its attribute information under the Monitoring page > view the service’s Overview tab. On the left side of the tab, under Status > Specifications > pod limits and pod scaling mode are shown, see Figure 21.
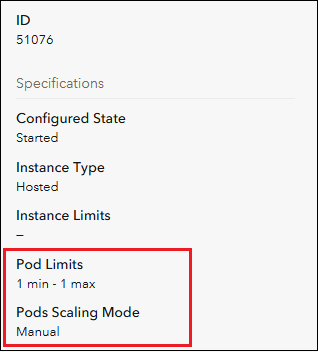
Figure 21: Service overview tab attributes for a service in ArcGIS Enterprise on Kubernetes.
ArcGIS Monitor can also display web app and web map dependencies with component relationship graphs, see Figure 22. Note the distinct ArcGIS Enterprise on Kubernetes icon representing the “base” component on the left side of the graph.
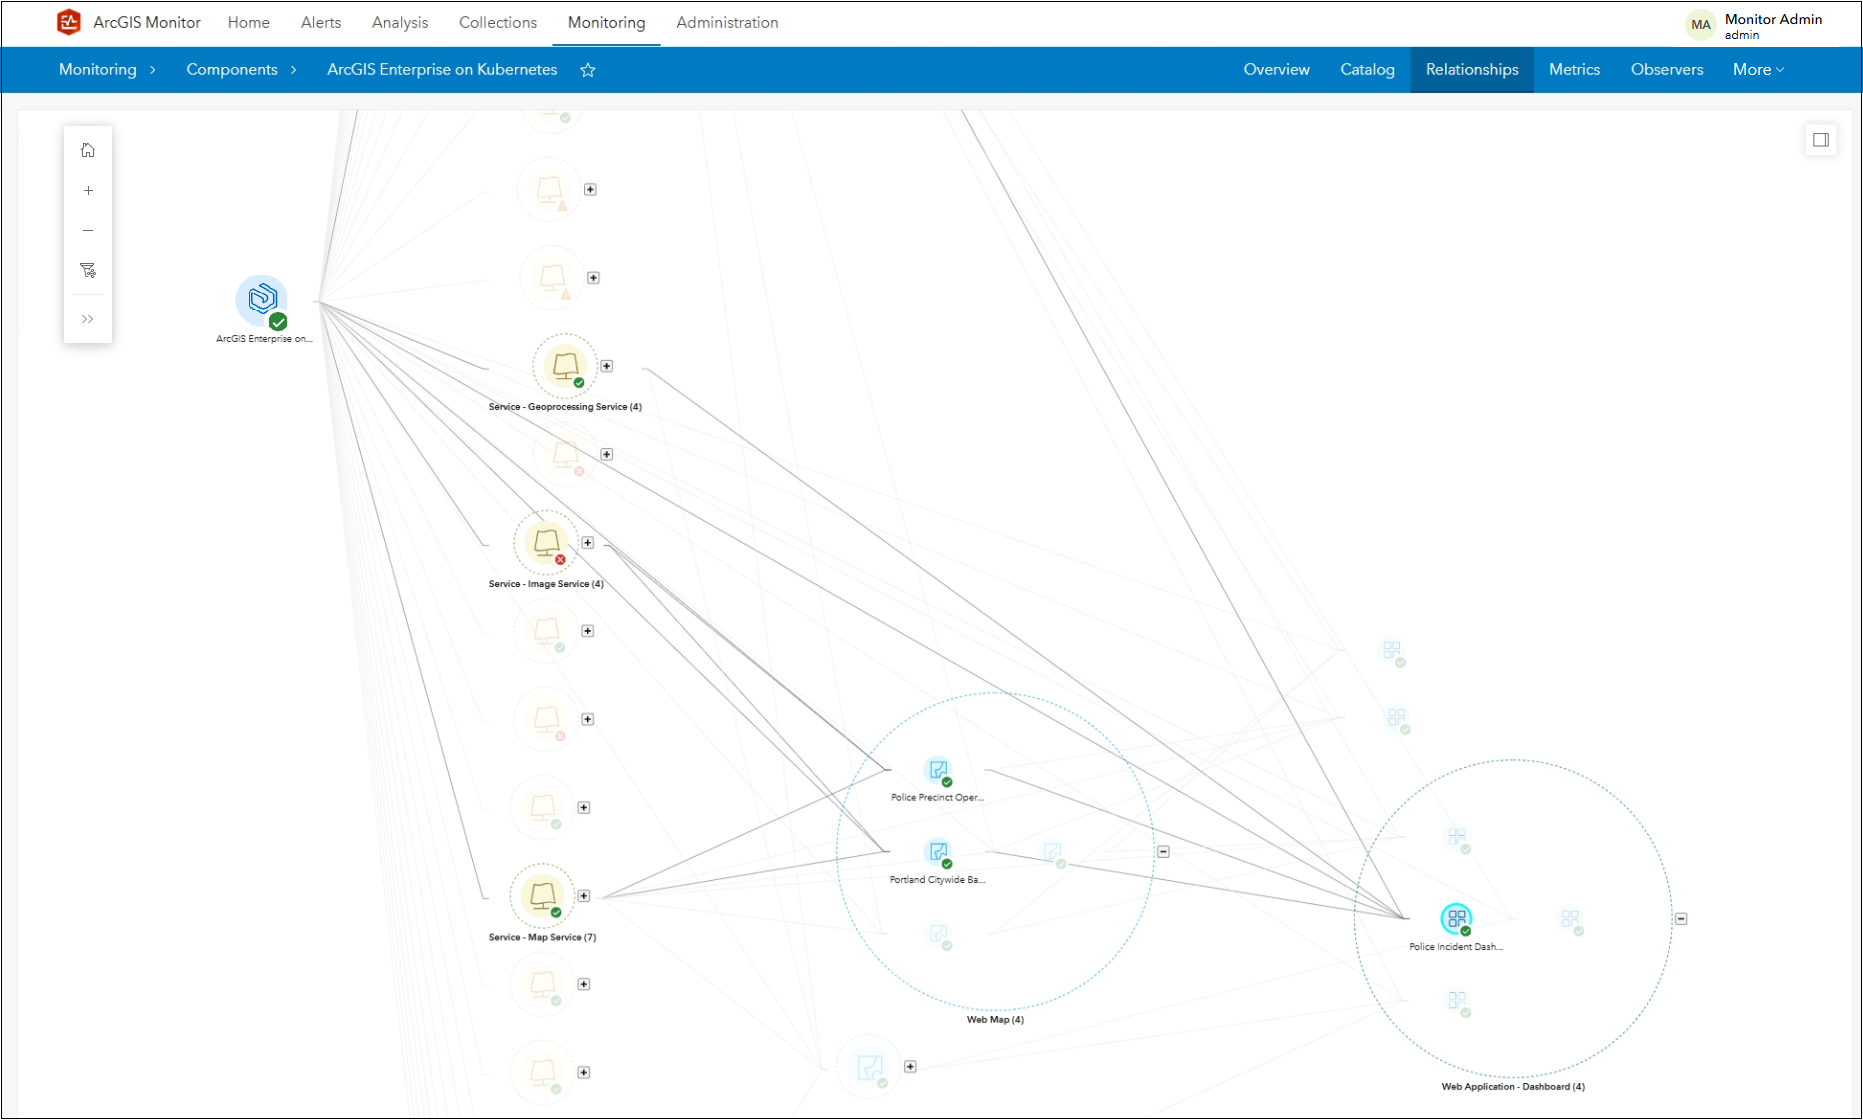
Figure 22: ArcGIS Enterprise on Kubernetes component relationship graph showing web app dependencies.
For some additional guidance on managing ArcGIS Enterprise on Kubernetes, please review these help topics:
- Manage service deployments in ArcGIS Enterprise for Kubernetes
- Service scaling in ArcGIS Enterprise for Kubernetes
Side note: While ArcGIS Monitor 2026.1 can register and collect metrics from ArcGIS Enterprise on Kubernetes, ArcGIS Monitor itself does not run in a Kubernetes environment. Monitor operates in Windows and Linux environments.
Dependencies for referenced services are supported in component relationship graphs
One of the most popular features in ArcGIS Monitor are component relationships graphs, which display a component’s relationship to other components as a tree diagram. Understand how to work with component relationship graphs from this blog. This graphical representation provides a hierarchical view of enterprise GIS assets and makes it easier to identify component dependencies. In ArcGIS Monitor 2026.1, this capability now supports relationships and dependencies for referenced services (services with data sources from enterprise geodatabases) for ArcGIS Enterprise 12.2 and later releases, see Figure 23.
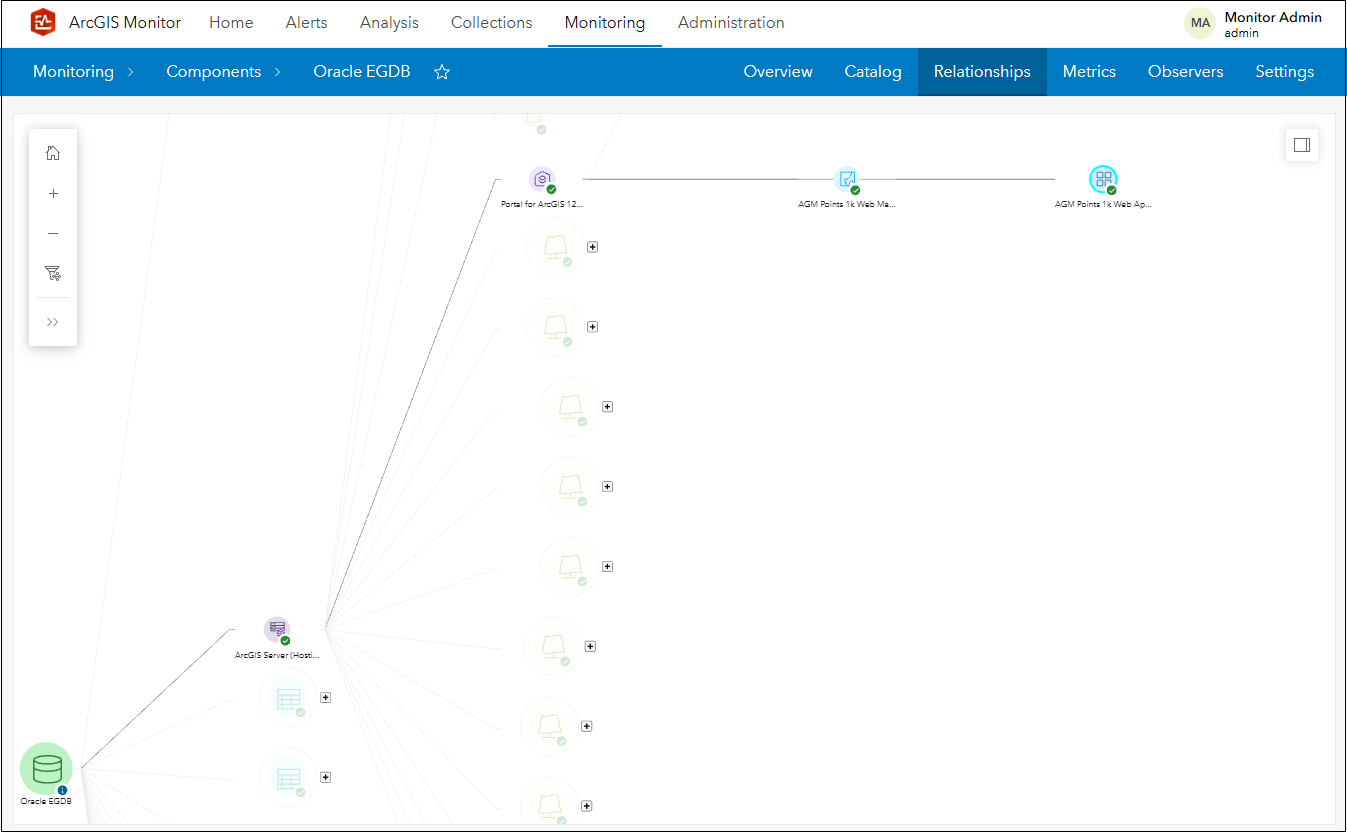
Figure 23: Component relationship graph showing enterprise geodatabase data source.
Artificial Intelligence (AI) Capabilities with Model Context Protocol (MCP) for ArcGIS Monitor – a public beta feature
This last feature enhancement is the start of enabling AI capabilities with ArcGIS Monitor. Model context protocol (MCP) is an open standard that gives AI applications a universal way to securely connect to external tools, databases, and data sources. In Monitor 2026.1, MCP for ArcGIS Monitor is included as a public beta feature, see Figure 24.
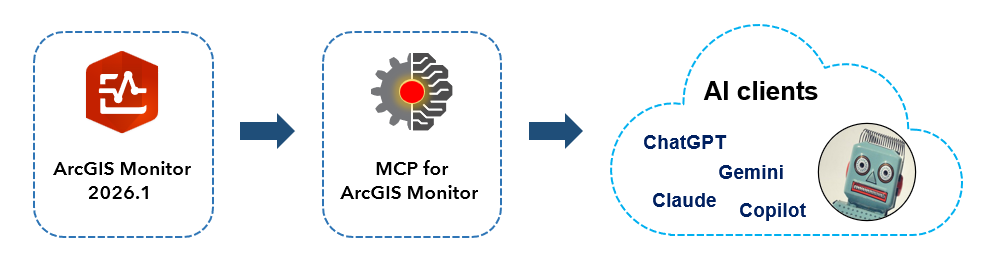
Figure 24: Conceptual workflow using MCP for ArcGIS Monitor 2026.1.
This means that admins can connect an AI to the data collected by Monitor and use natural language to help analyze and process the collected data, enabling them to better understand and identify trends and troubleshoot issues. We encourage you to explore and test out this capability. Your feedback will help us enhance this for the next Monitor release. More information is available in this blog.
Side note: MCP for ArcGIS Monitor is separate and different from MCP for ArcGIS Enterprise.
To learn more and connect with us about ArcGIS Monitor, please visit:
Sincerely,
The ArcGIS Monitor team



Article Discussion: