ArcGIS Monitor provides observability by collecting metrics on the health, performance, and usage of your enterprise GIS. It is designed to help system administrators and GIS managers ensure their ArcGIS Enterprise deployments and underlying infrastructure are working efficiently. Monitor helps reduce and prevent system downtime, resulting in operational cost savings.
For organizations that have multiple ArcGIS Enterprise deployments (e.g., dev | staging | production environments or in different locations) and/or using different release versions, ArcGIS Monitor provides a single console where you can view key performance indicators (KPIs) across all deployments to help you manage and optimize your enterprise GIS and its underlying infrastructure.
ArcGIS Monitor 2026.0 includes two new features to help administrators better manage their enterprise GIS deployments:
- Enterprise portal web app and web map usage metrics
- Enhanced service utilization metrics for web services in multi-machine ArcGIS Server sites
A complete list of updates are listed in the ArcGIS Monitor 2026.0 release notes.
Enterprise portal web app and web map usage metrics
This release continues to expand information collected for web apps and web maps in enterprise portals. A new observer that collects session information was added to both the enterprise portal and ArcGIS Server component types. They scan enterprise portal and ArcGIS Server web server logs for usage information on web apps and web maps.
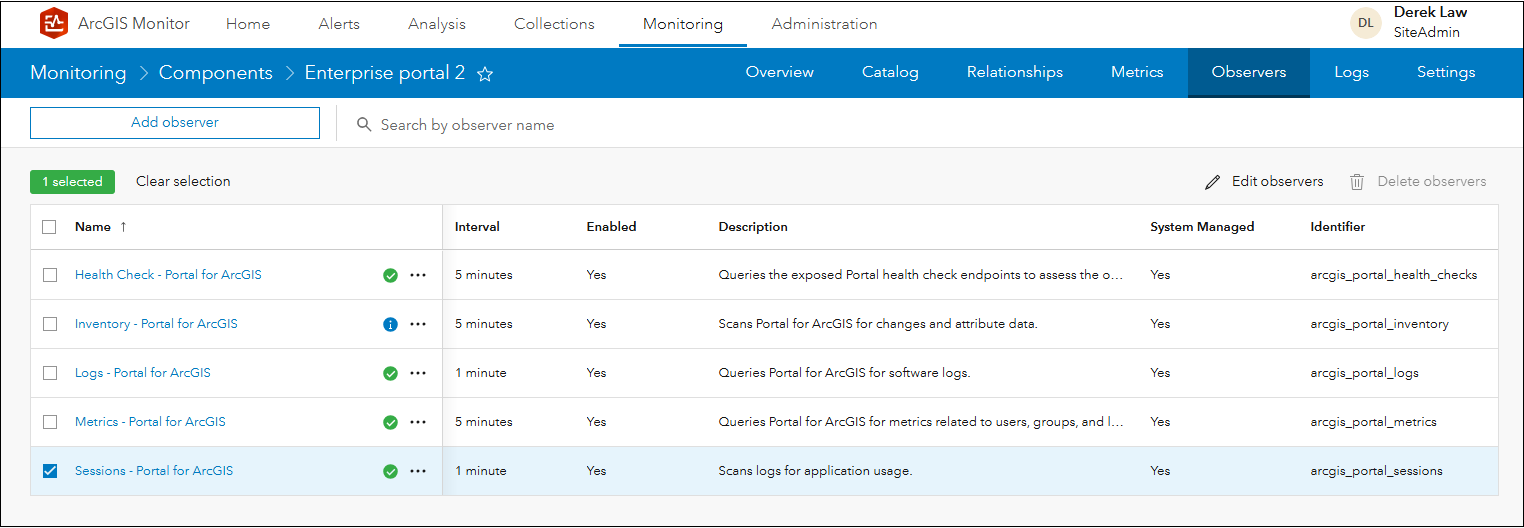
Figure 1: New Sessions observer for enterprise portal components.
The new Sessions observer provides admins with the number of active sessions on a web app and/or web map, and the duration of those sessions. On the Monitoring page, when a web app component is selected, its Overview sub tab will display its usage metrics:
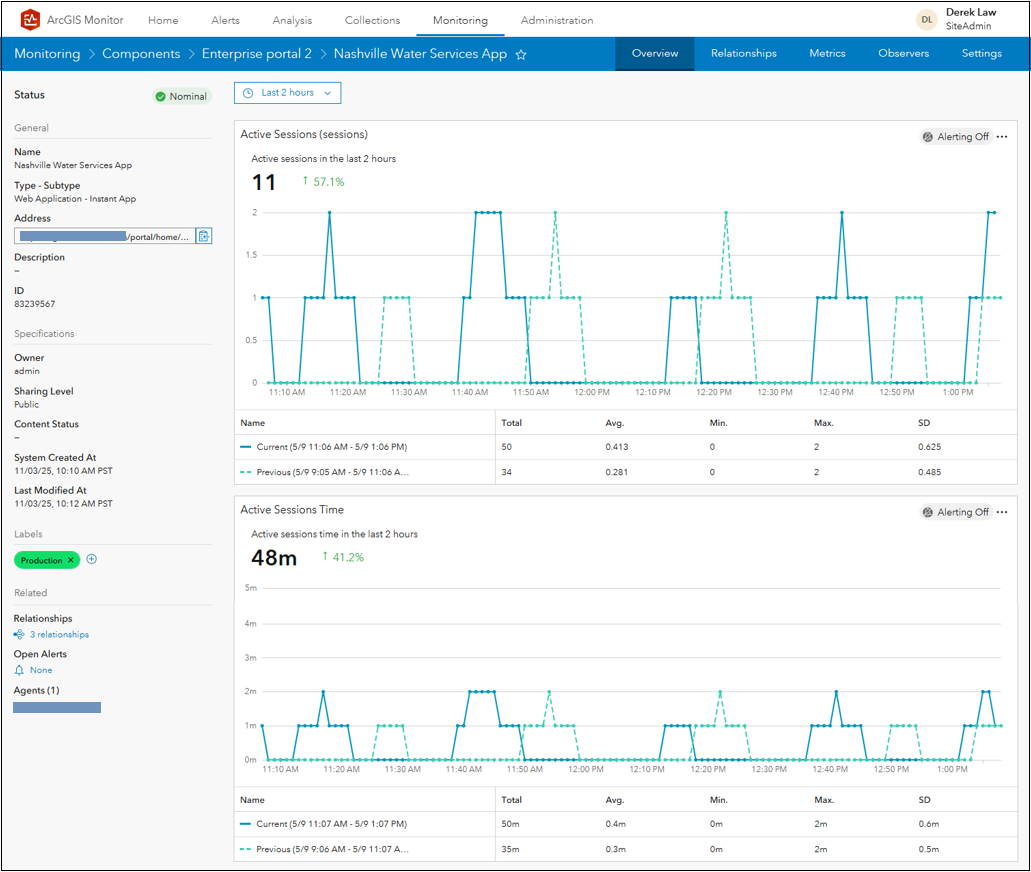
Figure 2: Overview sub tab for the Nashville Water Services App
In Figure 2, the Overview sub tab for the Nashville Water Services App shows two metrics: Active Sessions and Active Sessions Time, with the time range set to the last 2 hours. Active Sessions displays the total number of active sessions for the web app over the time interval. Active Sessions Time shows the duration of all active sessions for the web app over the time interval. In this example, there were 11 active sessions of the app in use, with the session time spanning 48 mins, for the last 2 hours.
In both graphs two data series are shown: the solid blue line represents collected data for the displayed time range (e.g., the last 2 hours: 11:06 am to 1:06 pm) and the dotted teal line represents data collected for the previous time range (e.g., 2 hours before the last 2 hours: 9:05 am to 11:06 am). This is meant to provide a simple comparison of the web app’s usage for the specified time range rendered. Next to the Active Sessions value of 11 is a small green arrow pointing up with a 57.1% value – this indicates web app usage increased from the previous 2 hours compared to the last 2 hours. Next to the Active Sessions Time value of 48 mins is a small green arrow pointing up with a 41.2% value – this indicates that the total session time increased from the previous 2 hours compared to the last 2 hours. These can be helpful indicators if usage is trending up or down within a specified time range.
Both the Active Sessions and Active Sessions Time metrics are also available for web map components. Note that when a web app is accessed, its associated web map is also being used, but a session is not counted for the web map. When a web map is viewed in the enterprise portal Map Viewer, this will count as an active session.
Side note: A “session” is defined as an instance where an end user has directly accessed the web app or web map. Four factors are considered in determining session uniqueness:
- Portal item ID (for the web app or web map)
- Origin internet protocol (IP) address
- Web browser type
- User
The unique combination of these four factors will determine a unique “session” counted by ArcGIS Monitor. For example, when accessing and viewing a web app in a web browser from a single machine: If an end user has accessed the web app in two separate (and different) web browser instances, this would count as two sessions. If an end user has accessed the web app in two separate web browser instances (but using the same web browser) this would not count as two sessions. If an end user has accessed the web app in two different tabs within the same web browser instance, this would also not count as two sessions.
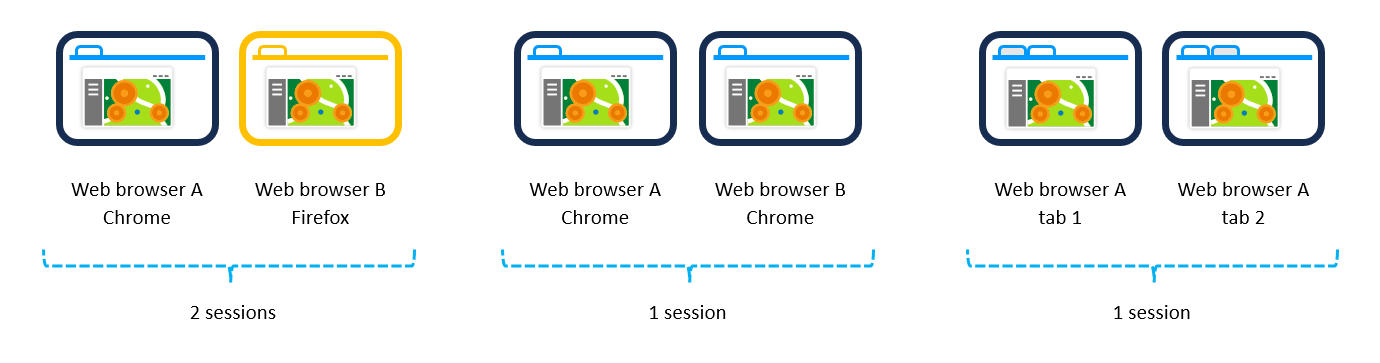
Figure 3: Conceptual diagram showing possible web app sessions
In cases where a web app and/or web map is accessed anonymously (e.g., a publicly shared item with no login needed), this is still counted as a session. Session time is determined by how long the end user has the web browser “open” to access and use the web app and/or web map. Alerts can also be configured on the Active Sessions and Active Sessions Time metrics to notify admins if a web app or web map becomes unexpectedly popular, or if their usage does not meet minimum requirements defined by the organization.
Admins can use these new metrics to better understand how web apps and web maps are being used, which ones are popular, and how long they are typically used. This can help identify unused web apps and web maps that could be retired or improved to help increase usage. They can help identify which information products within the enterprise portal have the most impact to support business workflows.
On the Monitoring page, when an enterprise portal component is selected, its Overview sub tab will also display these new usage metrics:
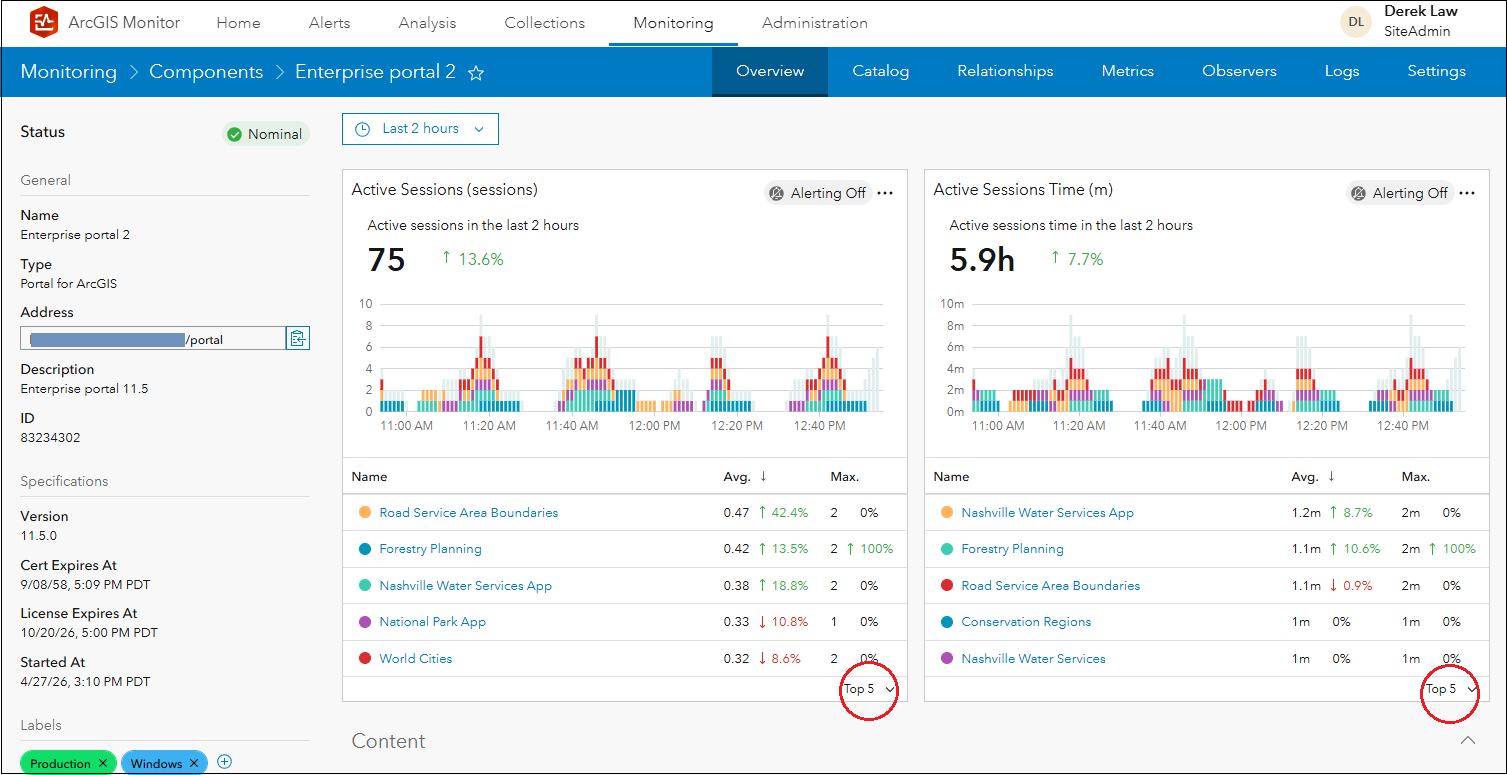
Figure 4: Overview sub tab for Enterprise portal 2 showing top 5 items
In Figure 4, Active Sessions and Active Sessions Time metrics are shown for the top 5 web apps and/or web maps in Enterprise portal 2, for the specified time range (e.g. last 2 hours). In this case, there were 75 active sessions with a total session time of 5.9 hours, in the last 2 hours. Both the number of active sessions and active session time has increased compared to the previous 2 hours, denoted by the green arrows pointing up and percentages to the right of the metric values.
Below the serial charts, the top 5 most used web apps and/or web maps are listed for each metric. Note that for each item in the list, there is an indicator showing if usage is increasing (green arrow pointing up) or decreasing (red arrow pointing down) and a percentage. For example, the Forestry Planning web app usage has grown 13.5% and World Cities web map usage has decreased by 8.6%, in the last 2 hours.
In the lower right corner of each list (red circles in Figure 4), you can change the list to display the bottom 5 (or least used) web apps and/or web maps for each metric.
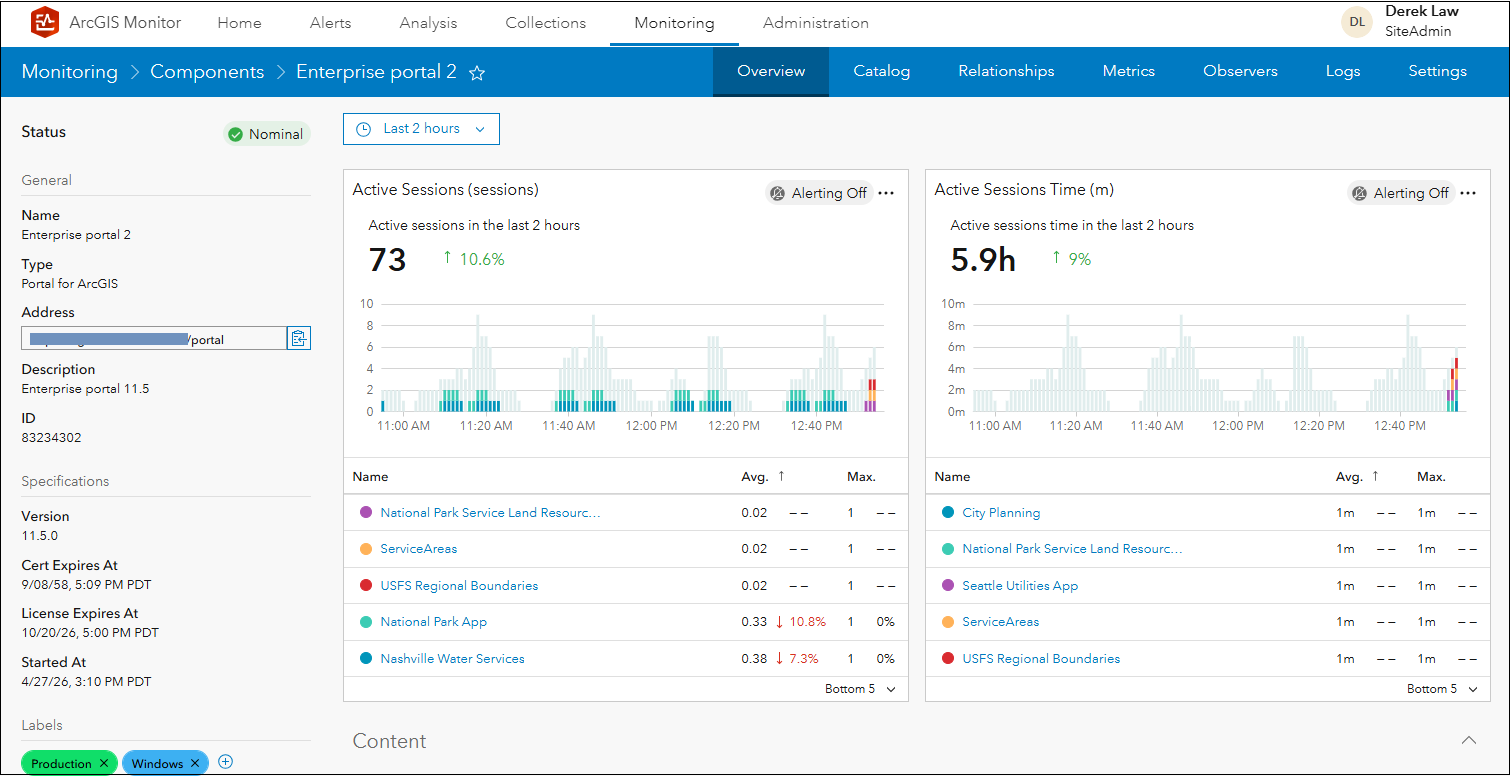
Figure 5: Overview sub tab for Enterprise portal 2 showing bottom 5 items
These two usage metrics provide admins with a better understanding of how web apps and web maps are being used in an enterprise portal. Admins can better determine which information products are being used the most, by how many users, and for how long. This can help them better govern and manage the enterprise portal contents, ensure popular items are well supported by system resources, and retire or improve under used web apps and web maps.
Admins can create analysis views that provide an overview of enterprise portal item usage using these metrics:
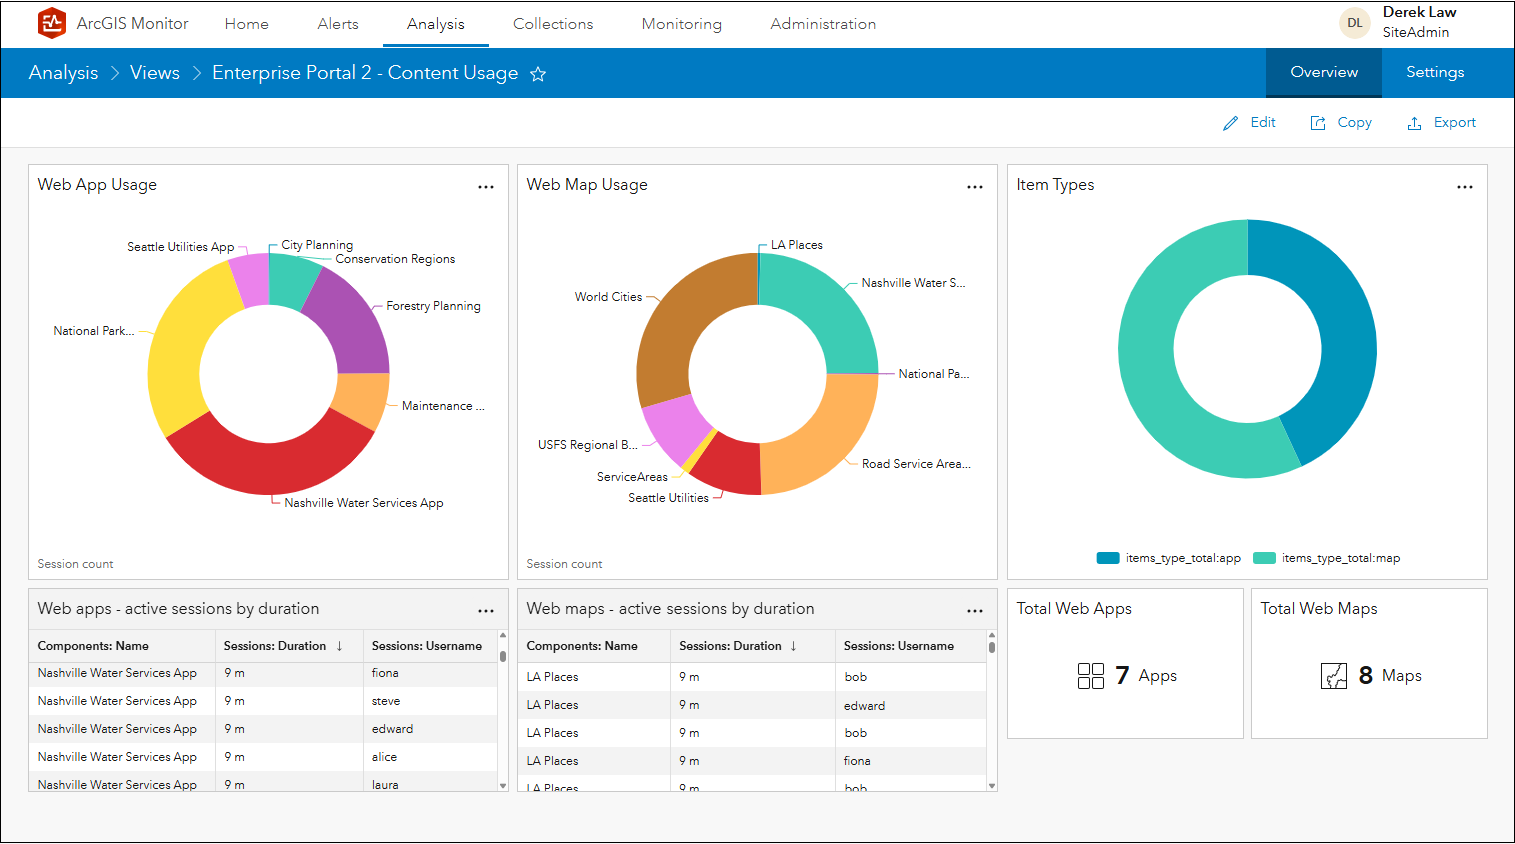
Figure 6: Enterprise portal 2 – Content Usage analysis view
Figure 6 shows an analysis view of Enterprise portal 2 content usage. It has three donut charts showing (left to right): web app session counts, web map session counts, and web apps vs web maps. In the lower section there are two tables showing (left to right): web app active sessions by duration, web map active sessions by duration; and two indicators showing the number of web apps and web maps, respectively. This is intended to spark ideas on how you can develop your own KPIs using these metrics.
Enhanced service utilization metrics for web services in multi-machine ArcGIS Server sites
This enhancement is for ArcGIS Server components that are multi-machine ArcGIS Server sites. The intention is to provide admins with more system resource usage information of services for host machines that participate in a multi-machine ArcGIS Server site.
Figure 7 shows some example ArcGIS Server site configurations. Site A consists of a single host machine, for which this new capability is not really applicable, because all of its services would utilize the host machine’s resources. For sites B and C, this feature would provide metrics on how services would use system resources at the site level and for each individual host machine in the site.
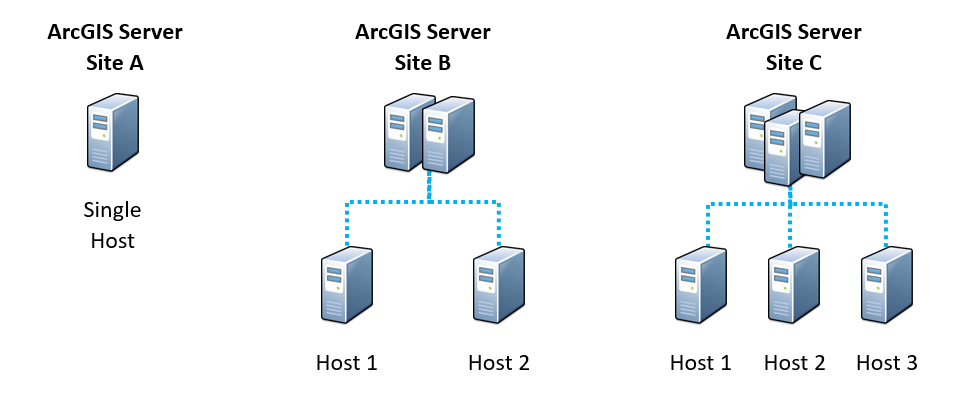
Figure 7: Example ArcGIS Server site configurations
In ArcGIS Monitor 2026.0, three new metrics are available for services that are operating on multi-machine ArcGIS Server sites. They include:
- CPU Utilized: The average percentage of CPU resources used by the service’s ArcSOC processes.
- Instances Total: The total number of instances used by the service.
- Memory Utilized: The average percentage of memory used by the service’s ArcSOC processes.
Note: these metrics only apply to services with a dedicated instance type. Services with a shared or hosted instance type are not supported.
For example, Figure 8 shows the component relationship graph of SampleWorldCities service. It is hosted on GIS Server 6 which is a multi-machine ArcGIS Server site; it has two host machines. This deployment is similar to the ArcGIS Server Site B configuration in Figure 7.
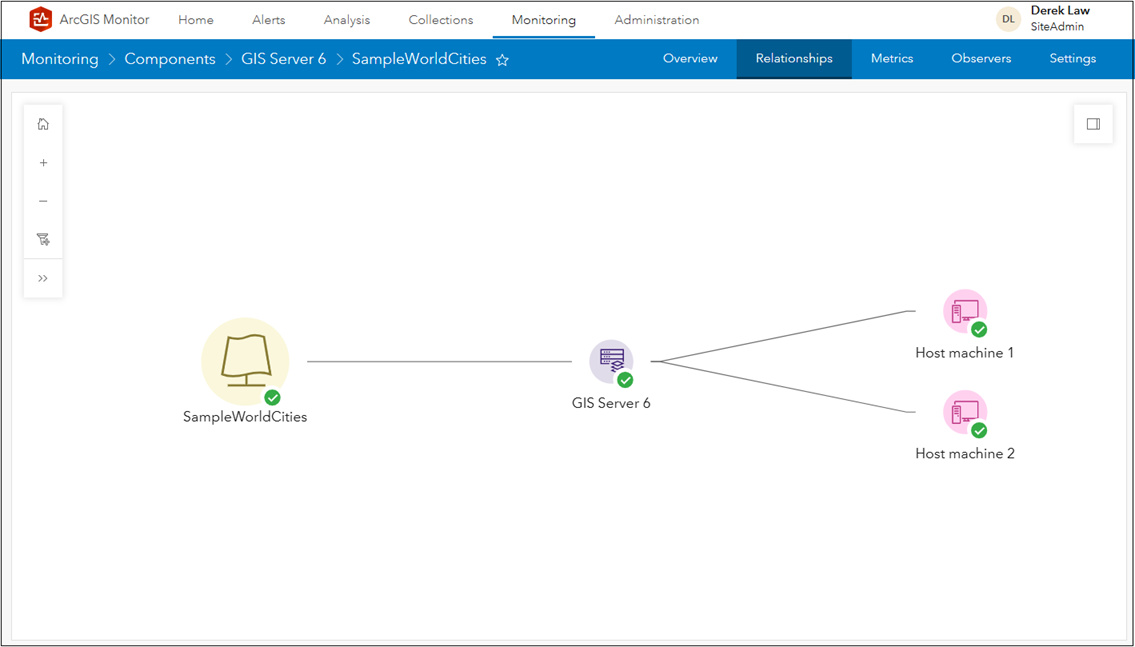
Figure 8: SampleWorldCities service relationship graph
On the Monitoring page, when the SampleWorldCities service is selected, its Metrics sub tab shows several new metrics:
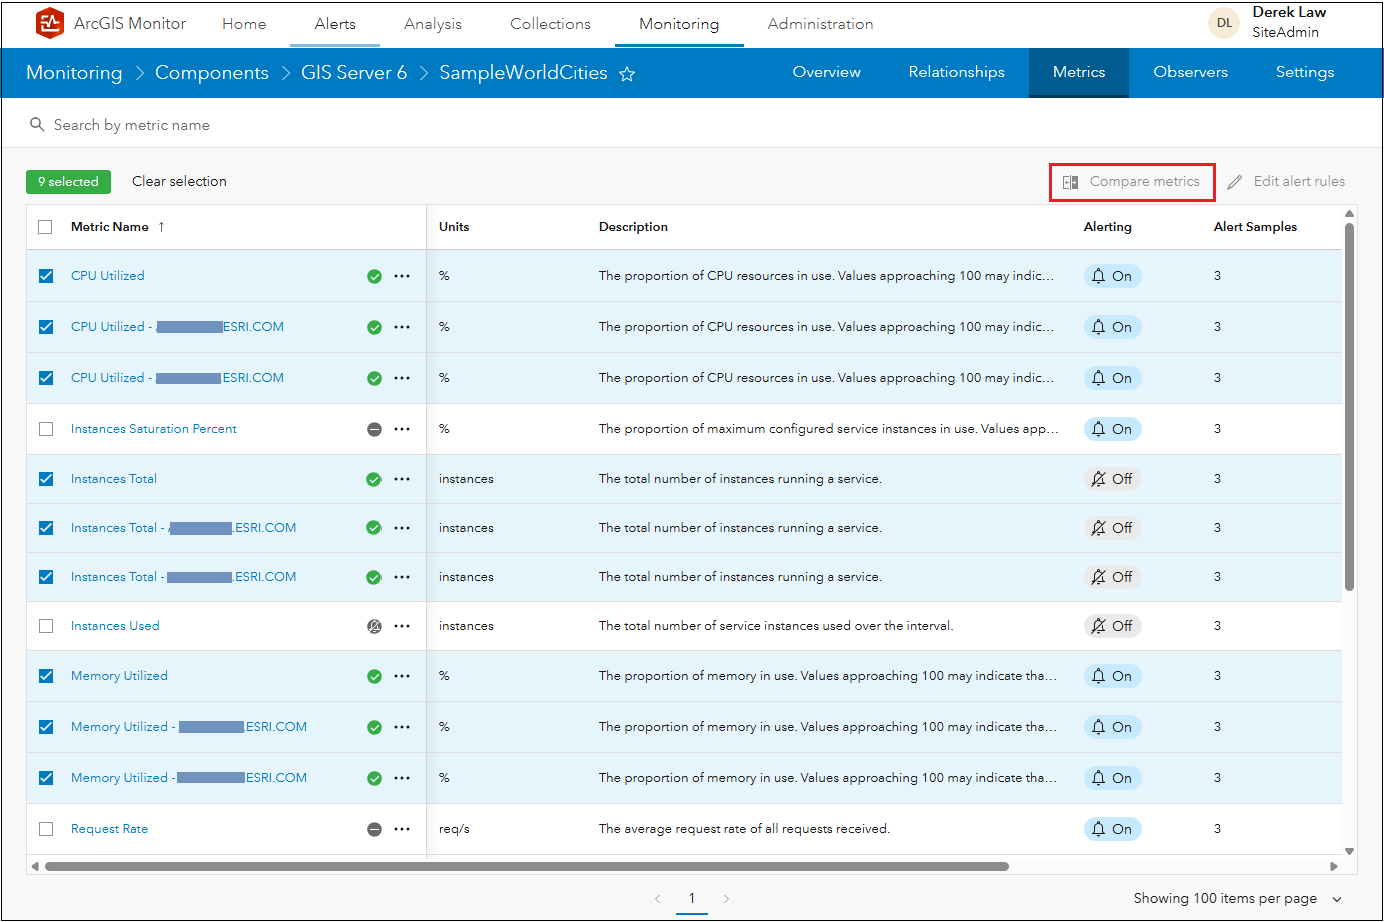
Figure 9: SampleWorldCities Metrics sub tab
The three new metrics (described earlier) are shown; they represent the KPIs for the service relative to the ArcGIS Server site. In addition, a separate metric is reported for each host machine that participates in the site. In this case, the ArcGIS Server site (GIS Server 6) is composed of two host machines, so there is a metric reported for each host machine. The metric name includes the machine name (e.g., CPU Utilized – [host machine name]).
For example, for the CPU Utilized metric, SampleWorldCities has the following metrics:
- CPU Utilized: The average percentage of CPU resources used by the service’s ArcSOC processes across all host machines in the site.
- CPU Utilized – Host machine 1: The percentage of CPU resources used by the service’s ArcSOC processes on this machine.
- CPU Utilized – Host machine 2: The percentage of CPU resources used by the service’s ArcSOC processes on this machine.
Each metric can be viewed in more detail and you can set alerts to enable proactive management.
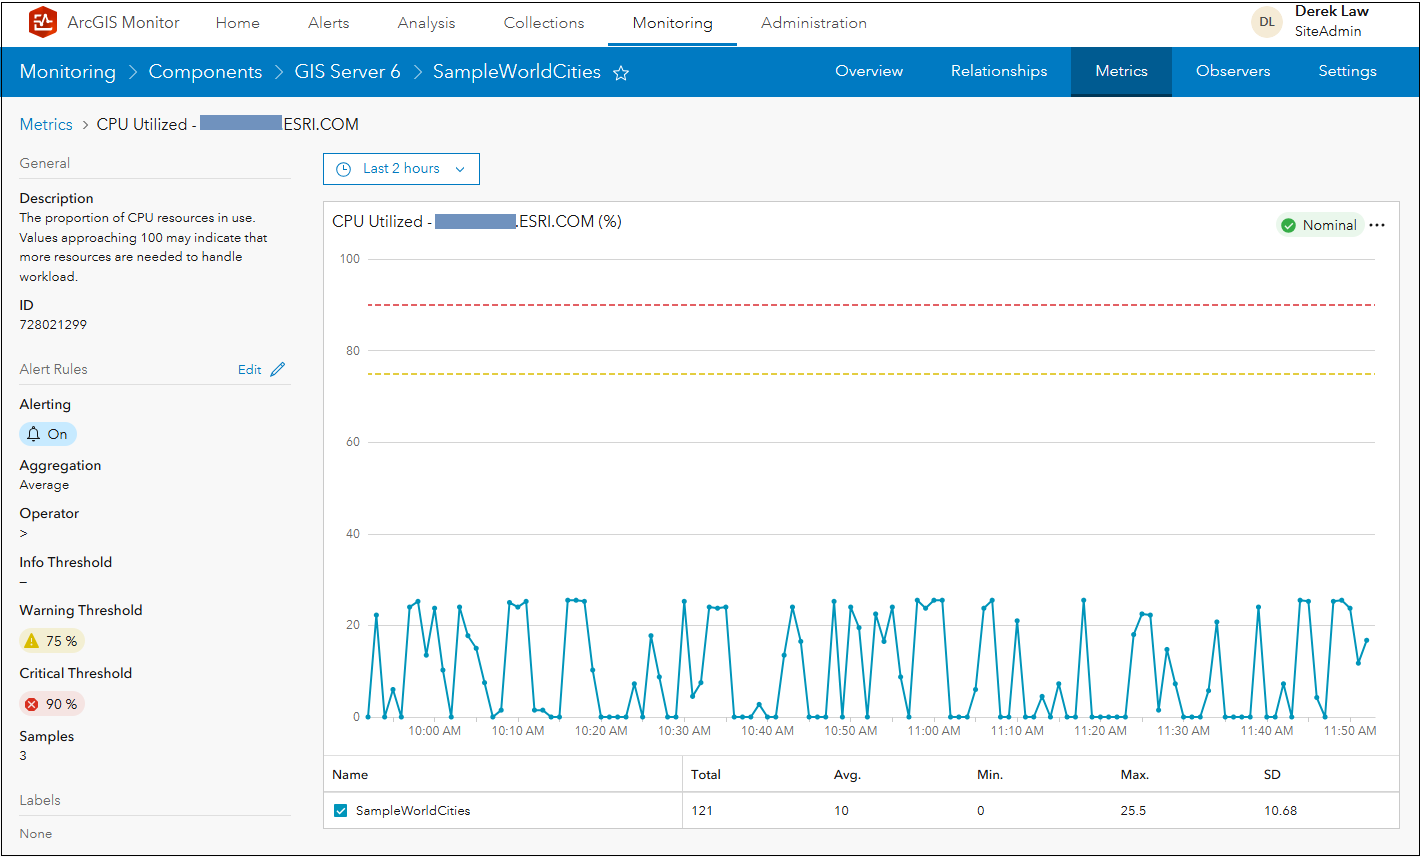
Figure 10: SampleWorldCities service CPU Utilized – Host machine 2 metric
These new metrics can help admins better understand how system resources are being used by services, separated out by host machines that participate in the ArcGIS Server site. If system resources on one of the host machines is being used more than another, admins could adjust and re-allocate system resources to better support the demands on the service and balance load across all hosts within the site.
You can easily create a new analysis view that compares metrics between the Server site and its participating host machines. Select the metrics on the Metrics sub tab, then click the Compare Metrics button (red rectangle in Figure 9) and you can quickly display a comparison chart. You could also generate an analysis view of the chart, see Figure 11.
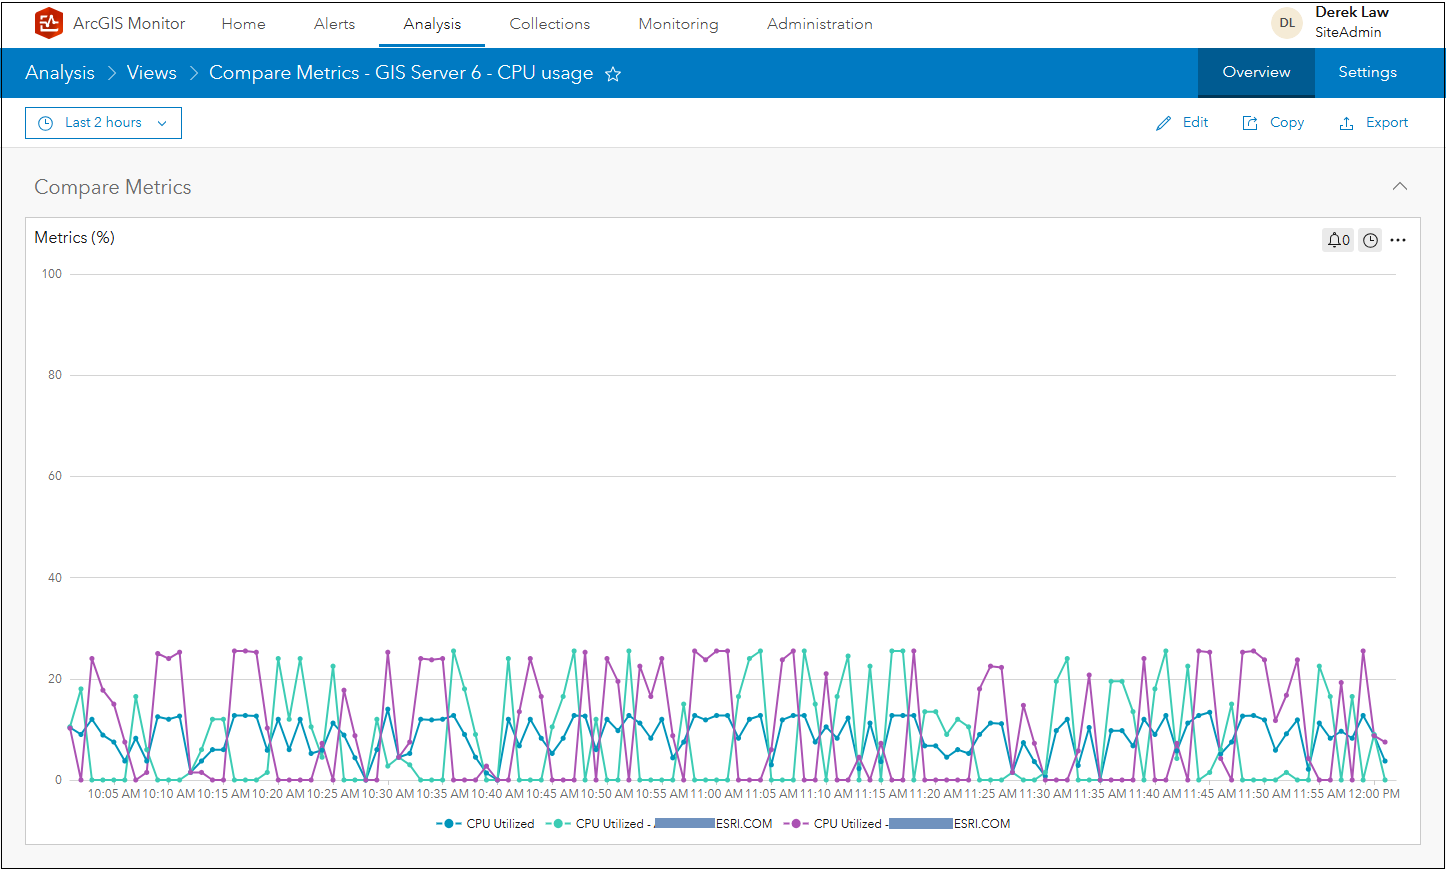
Figure 11: Analysis view comparing CPU usage for GIS Server 6
ArcGIS Monitor Community
One of the most popular ways to learn more about observability for ArcGIS and how to use ArcGIS Monitor are the user group meetings. These sessions are presented by ArcGIS Monitor users and experts who share their knowledge and experiences using the product.
Esri Partners Leveraging ArcGIS Monitor for Observability
Tuesday June 9, 2026 at 9 am PST
In this sixth user group meeting, technical experts from Esri partners will share their experiences using ArcGIS Monitor. Cloudpoint Geospatial will provide strategies and tips for proactive management of an enterprise GIS, while dymaptic will discuss leveraging AI to extend ArcGIS Monitor. Register to attend.

To learn more and connect with us about ArcGIS Monitor, please visit:
- Product Page
- ArcGIS Monitor – Essential Resources
- ArcGIS Monitor user group meeting recordings
- Help documentation
- Esri Community
Sincerely,
The ArcGIS Monitor team



Article Discussion: