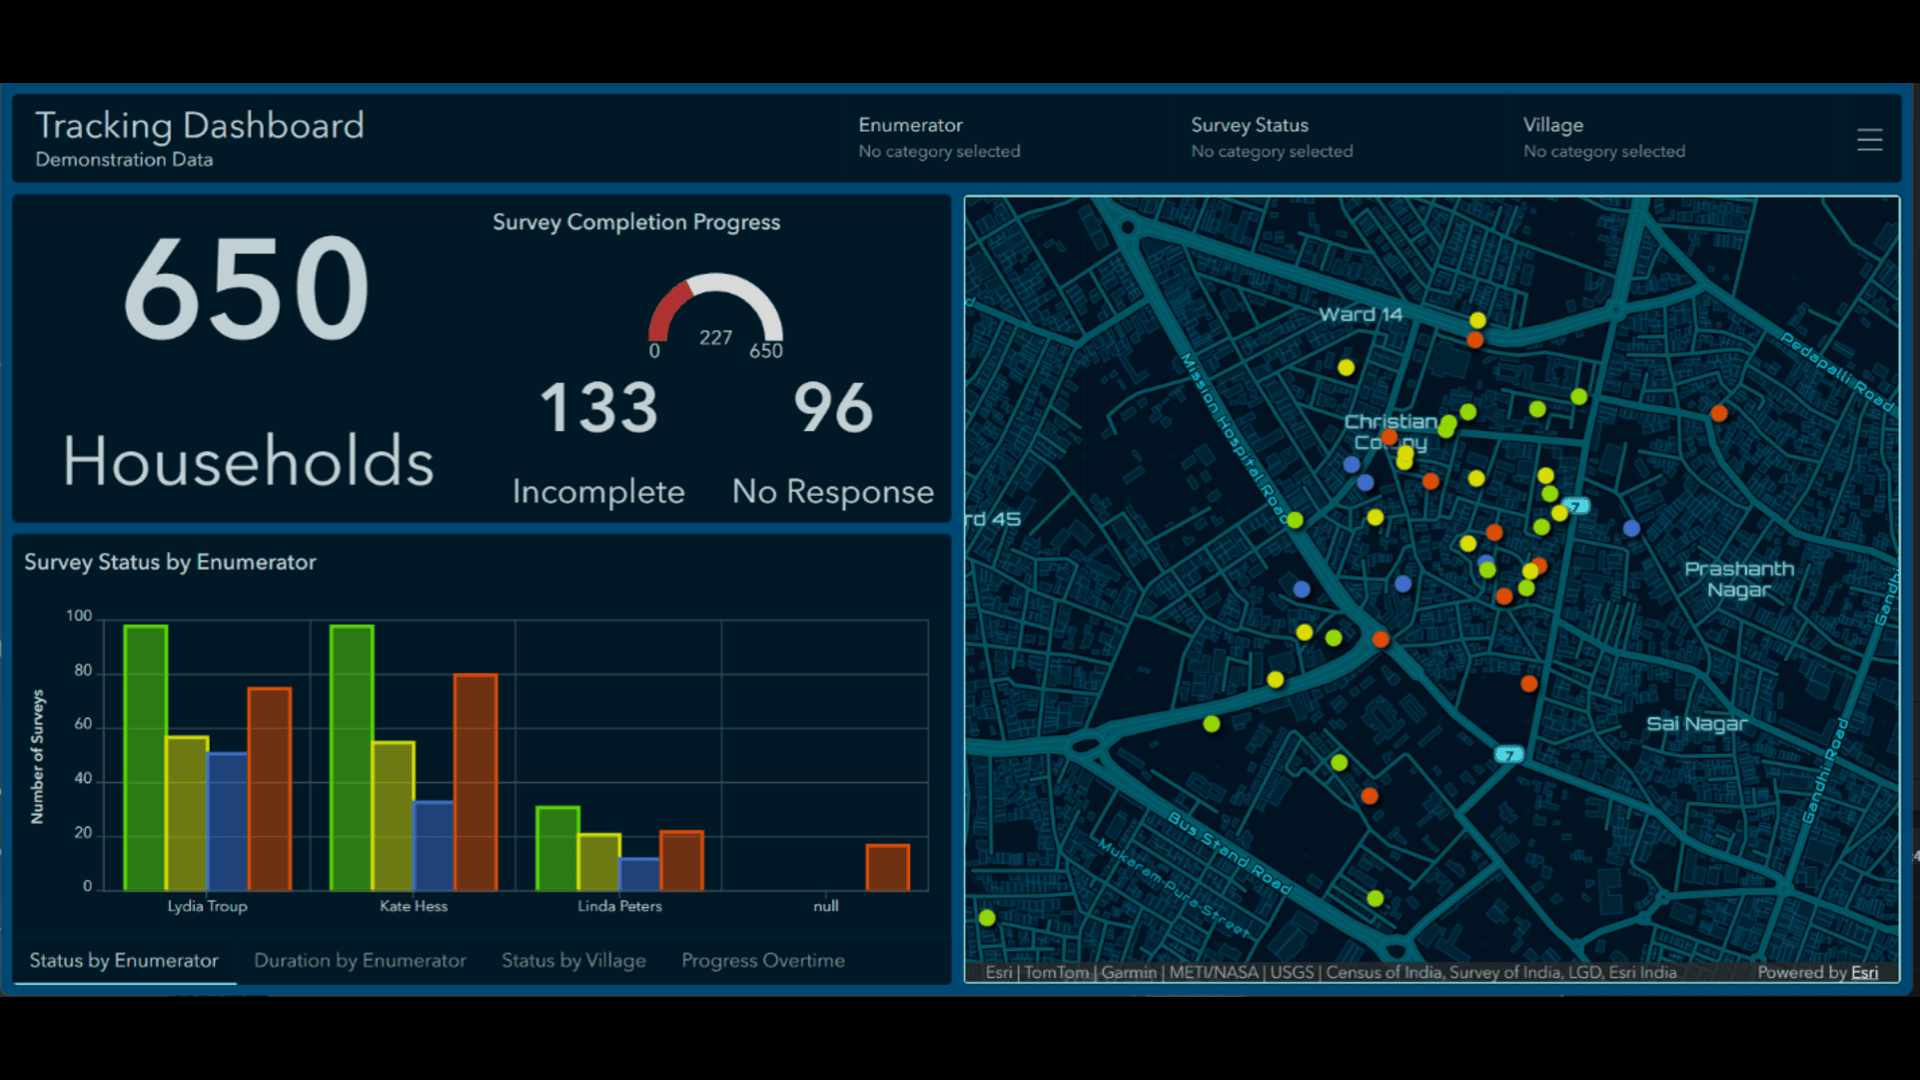
Whether you’re conducting a population census, agricultural census, household survey, or another large-scale field operation, one of the biggest questions during data collection is simple: How are we doing?
Supervisors need to understand what is happening across their assigned areas to identify where enumerators are struggling to get participation, and census managers need a national picture of collection progress.
With ArcGIS Dashboards, managers can track progress throughout collection and identify issues early enough to take corrective action, instead of waiting for end-of-day reports.
What metrics are tracked?
Typical metrics tracked in census operations fall into several categories: collection progress, contact and response outcomes, enumerator and supervisor performance monitoring, and data quality indicators. Metrics like refusal rates and completion rates help to track overall progress. Enumerator specific metrics like survey duration and completed interviews are used to detect fraud.
These indicators are often summarized at multiple administrative levels, including Enumeration Areas (EAs), supervisor areas, districts, provinces, and national totals.
Why monitor spatially?
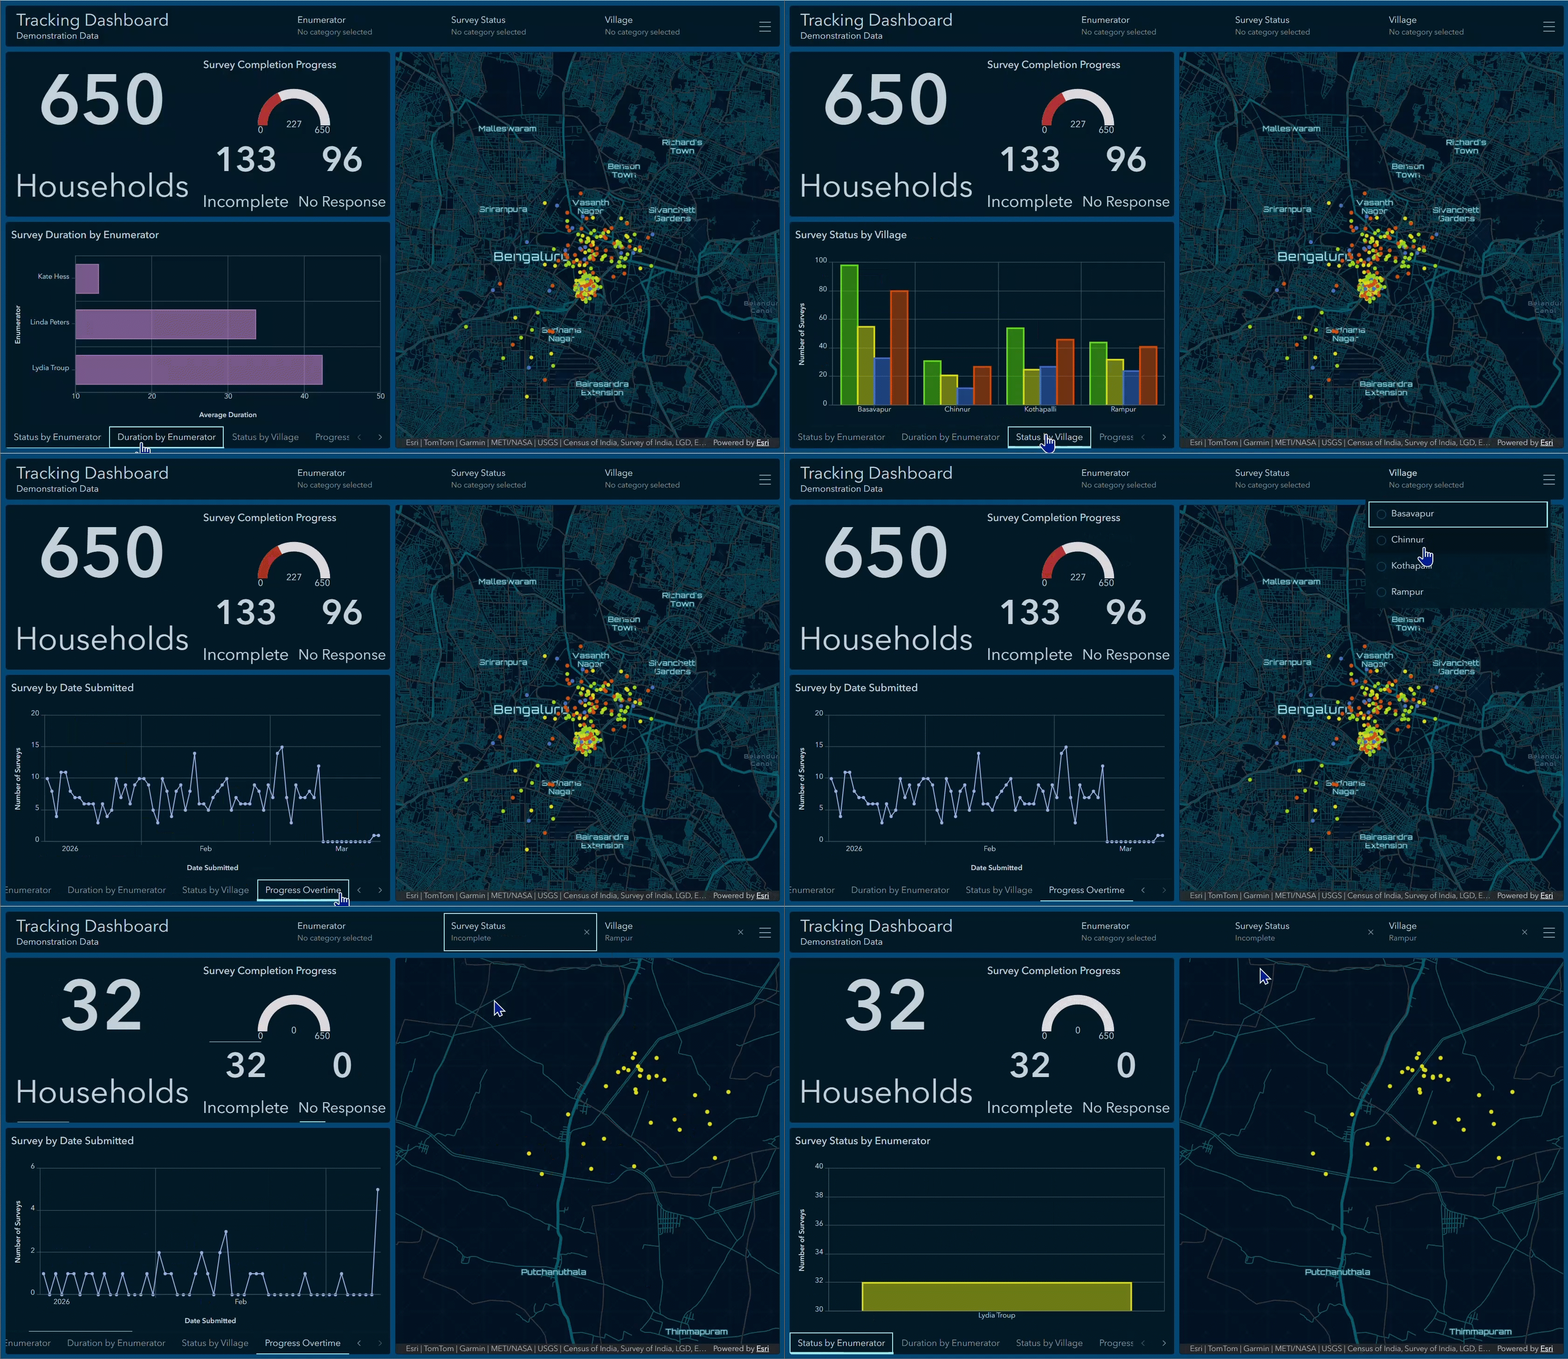
Geography provides important context that is often missing from traditional reports. A table showing completion rates is useful, but a map can quickly reveal where collection is progressing well and where additional attention is needed. Visualizing indicators spatially can identify clusters of refusals, areas with limited field activity, or regions where additional resources may help response rates.
Below we will cover how you can monitor field enumeration done in Survey123/Field Maps, other field tools like CSPro or Survey Solutions, or custom field applications.
Monitoring ArcGIS Field App Enumerations
Collecting data in ArcGIS (with Survey123, or Field Maps) is the simplest way to use ArcGIS Dashboards to track progress. Your data is collected, tracked, and analyzed all in ArcGIS. As surveys are completed in the field, they are stored in ArcGIS feature layers. These layers are used directly in ArcGIS Dashboards to create a real-time view of collection activities.
The sample dashboard below also allows supervisors to edit surveys from the office. For instance, a supervisor can send a suspected fraudulent survey back to the enumerator to revisit, or assign it to a new enumerator.
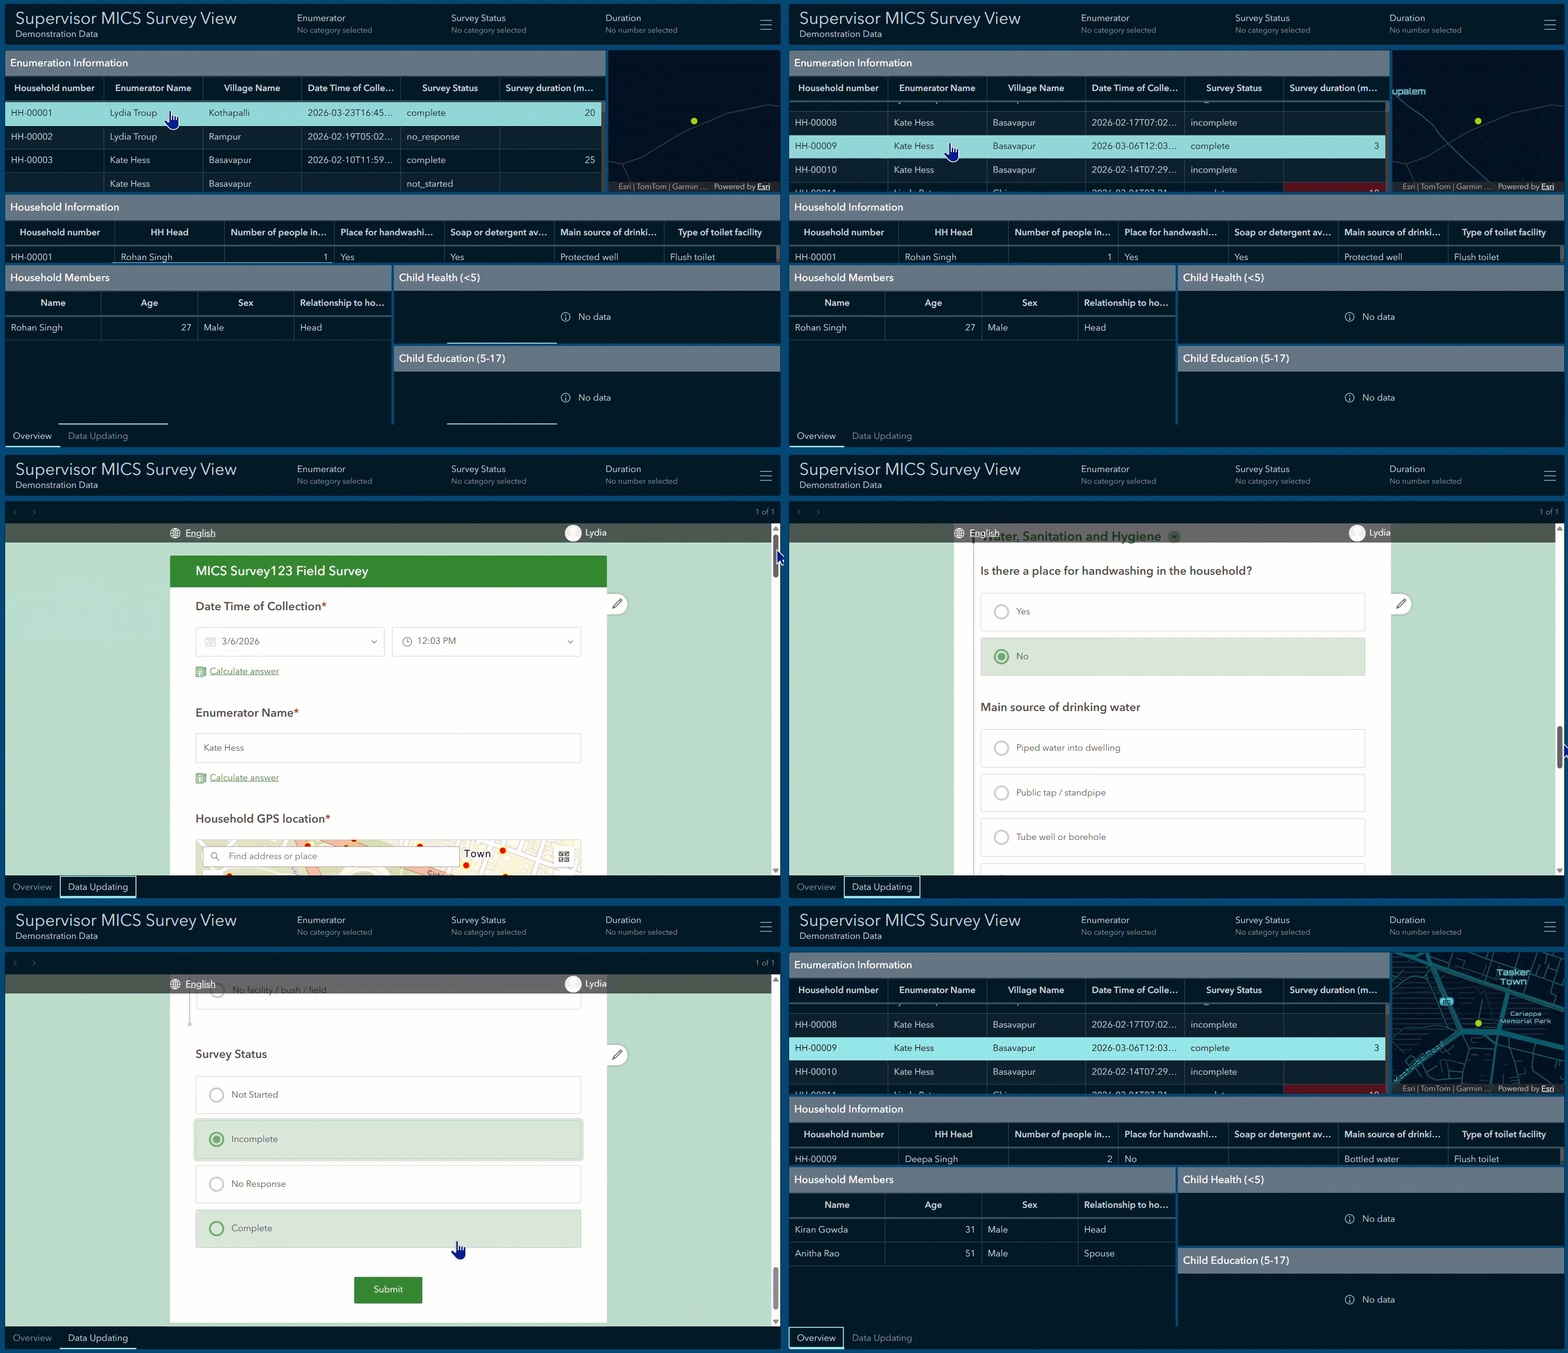
Additionally, view layers can preserve the sensitive nature of household level data. View layers are essentially stripped down layers of the collection layer, enabling the removal of names and other sensitive information as needed. Another option is to aggregate data with analysis tools; showing administrative level data instead of individual data. In this example we don’t have names/sensitive information in the dashboard.
Monitoring CSPro and Other Collection Systems
Not every organization uses ArcGIS tools for data collection. Many national statistical offices rely on platforms such as CSPro or internally developed applications.
ArcGIS Dashboards can be integrated with these systems through a relatively simple ETL (Extract, Transform, Load) workflow. Below we’ll take a look at how Esri Partner TeamDev integrated CSPro with ArcGIS Dashboards for household censuses in Albania and Moldova (2023 and 2024 respectively).
When using CSPro, data is typically collected in the field and synchronized through CSWeb, where survey submissions are stored in a MySQL database. Scheduled exports can then be generated and enriched with geographic information and operational indicators before publishing to ArcGIS Online or ArcGIS Enterprise as feature services.
The exact implementation will vary from organization to organization, but the overall pattern is usually the same:
Collect → Export → Transform (add geography) → Publish → Monitor
Organizations may implement these workflows using ArcGIS Pro ModelBuilder, Python scripts, data interoperability, cloud-based processing environments, or other tools already in use within their existing infrastructure.
Examples from Albania and Moldova
In Albania, they ran two ETL models. The first writes directly into the Enterprise geodatabase. It updates the collected data and aggregates it at three nested levels: from supervisor to enumerator passing through controller.
The trick is the use of the editor tracking: the model disables it, updates the data, then re-enables it, so the ‘creator’ field always stays the same. This is crucial because each level has its own dashboard and filters the view by URL parameter against that creator field. This means that each user only sees the data they own. Conversely, a supervisor sees all the work of their controllers and enumerators and so on, cascading down, enforcing data security.
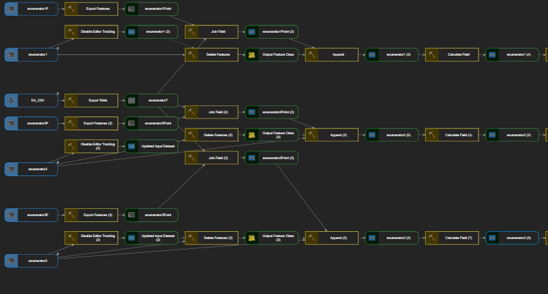
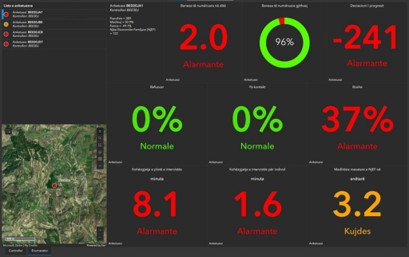
Albania’s second model is simpler and was used as well in Moldova: it overwrites all the data in a hosted layer with no owner distinction. Owner information is left out to create a global view of the whole collection for management to use.
To see TeamDev talk more about this, check out our recent webinar here.
Although CSPro is a common example, the same approach can be applied to many other collection systems like Survey Solutions. Survey Solutions stores data in PostgreSQL and can be integrated using a similar workflow. Custom survey applications and proprietary census systems can often be connected through exports, APIs, or scheduled database processes.
Conclusion
Whether data is collected using Survey123, Field Maps, CSPro, Survey Solutions, or another platform entirely, the monitoring requirements are largely the same. Supervisors need to understand what is happening in the field, managers need visibility into collection progress, and leadership needs a clear picture of overall operational status.
ArcGIS Dashboards provides a way to bring those indicators together in a geographic context, helping organizations move beyond spreadsheets and static reports toward a more complete, live view of collection activities. While population and housing censuses are an obvious use case, the same approach can be applied to agricultural censuses, household surveys, labor force surveys, establishment surveys, and other large-scale field operations.
If you’re an NSO working on spatially enabling your census, explore more resources and examples here.
Thank you to TeamDev for their collaboration on this article.

Article Discussion: