Many of us start the day with the same routine (after making coffee): checking the weather forecast. Why? Individually, it determines everything from what we wear outside, if we bring the umbrella, and the small talk in the elevator. Professionally, it determines if we need to activate the Emergency Operations Center, what will be the working conditions for teams in the field, and if we need to take any special precautions.

Reliable and accurate weather information is critical not just for planning our days, but also for protecting lives and property, rerouting commerce and logistics around the world, and identifying vulnerable assets as inclement weather approaches. These assessments underscore why having weather information available in a GIS is becoming increasingly more necessary.
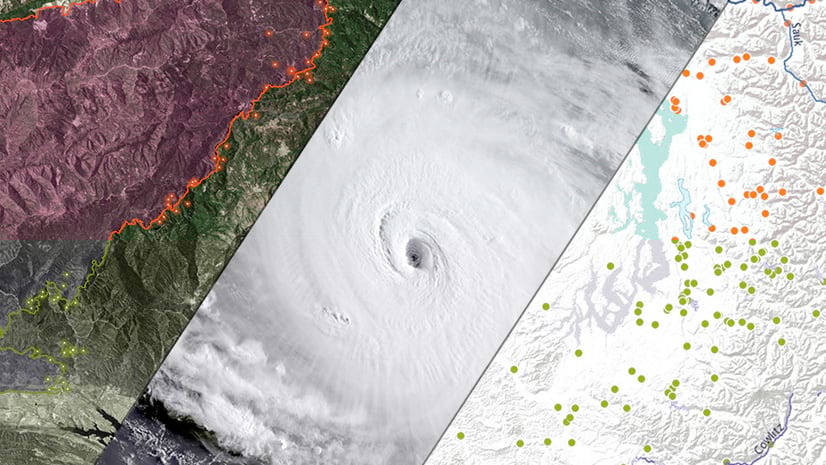
For many years, Esri’s ArcGIS Living Atlas of the World has been providing a wealth of real-time weather information for the U.S. and the world from official data generated by the National Weather Service, NASA, USGS and other authoritative organizations. Esri has been evolving these weather and disaster services to meet the ever-increasing demand for the information while also leveraging our ever-improving technology.

A New Set of Weather Services
A series of new real-time weather maps and layers have been made available to the public. Instead of the older map service technology, these new layers are hosted as feature services, which include several key improvements:
- These new services no longer require subscriptions. This free and open data continues Esri’s commitment to supporting emergency management and disaster preparedness around the world.
- These services will auto-scale within the Microsoft Azure cloud architecture to meet high-demand events, such as landfalling hurricanes.
- The new services will update displays automatically in the browser without any interaction to override a cached display.
- Improvements in hosted feature layer technology allow for more informative web maps by allowing users to create unique displays and popups from attributes across the different layers using FeatureSets.
- More close integration across the ArcGIS platform, including more clear workflows in ArcGIS Pro, Online, Insights, Operations Dashboards, etc.

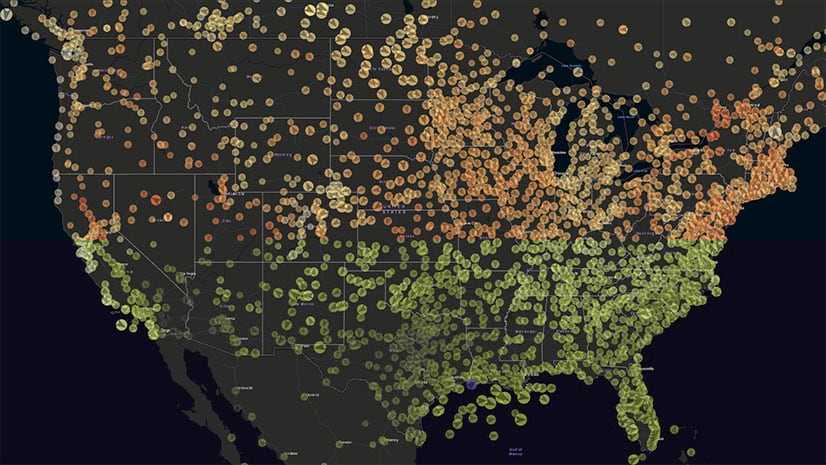
The first batch of these services are now available and include:
- USA Weather Watches and Warnings
- USA Short-Term Weather Warnings
- USA Storm Reports
- Current Weather and Wind Station Data
- Active Hurricanes
- Recent Hurricanes
- Satellite (MODIS) Thermal Hotspots and Fire Activity
- National Weather Service Wind Forecast
- National Weather Service Wind Gust Forecast
- National Weather Service Wind Direction Forecast
- National Weather Service Precipitation Forecast
- National Weather Service Snowfall Forecast
- National Weather Service Ice Forecast
- National Weather Service Smoke Forecast
While the heritage map service versions of these feeds will continue for the next year as you make the transition, you should begin moving to the feature service versions now before the map services are deprecated.
Stay tuned as we continue to release other improved services throughout the year, including Recent Earthquakes, USA Fire Activity, USA Drought Intensity, and even some completely new offerings. Additionally, we’ve been developing some new web maps, applications and dashboards that leverage these services with improved symbology and user experiences.
For comments or questions about this blog, please visit our Esri Public Safety GeoNet site.


Commenting is not enabled for this article.