Although many of us who work with GIS spend most of our time dealing with data that’s represented in rasters and vectors, lines and polygons, some of my favorite maps are sprinkled with patterns of dots — points of color that might seem random but that can represent all sorts of things, from historical sites to fire hydrants, from boundary markers to polling locations. Some maps use dot densities to represent the distribution of features or phenomena, like income levels or ethnicity. And sometimes dots on a map can represent individual humans.
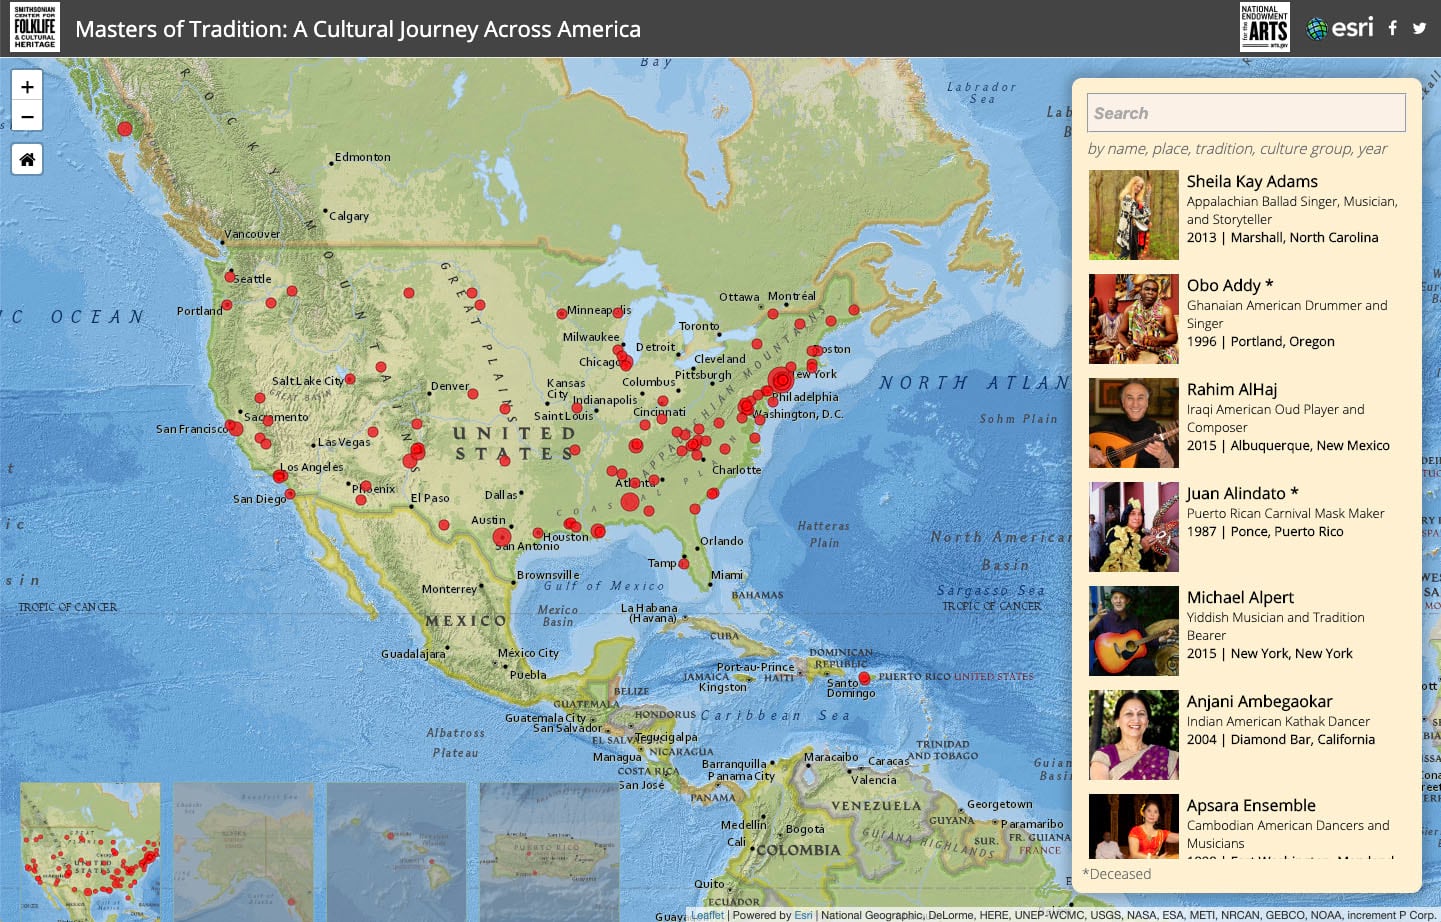
A couple of years ago, my colleague, developer Lee Bock, and I had the pleasure of collaborating with Marjorie Hunt, a folklorist at the Smithsonian Institution’s Center for Folklife and Cultural Heritage, on a dot map of some very special human beings. Masters of Tradition: A Cultural Journey Across America, includes an interactive map that provides access to multimedia profiles of scores of National Endowment for the Arts National Heritage Fellows.
We all know that geographic information systems can perform a myriad of sophisticated tasks — revealing interrelationships, visualizing change over time, predicting future trends, facilitating infrastructure management, and much more. GIS can also perform simpler tasks. In this case, it locates the home communities of human carriers of rich cultural traditions.
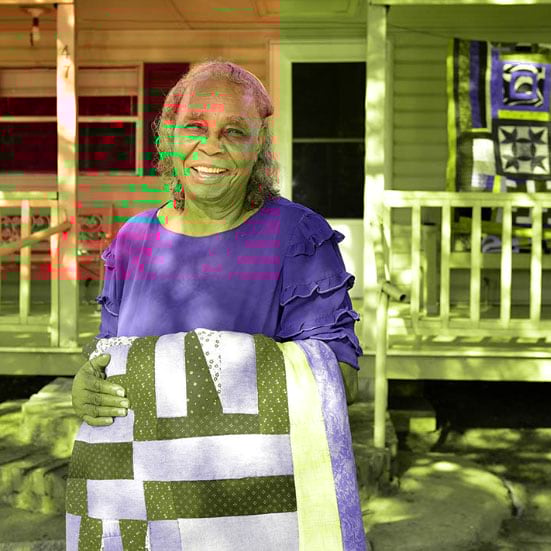
Since 1982, the National Endowment for the Arts has honored hundreds of artists and craftspeople, recognizing outstanding individuals who represent and sustain a wide diversity of cultural traditions. They include Navajo basket makers, Japanese American drummers, African American quilters, Appalachian storytellers, Hawaiian hula masters, a Tlingit woodcarver, and an Iraqi American oud player. Within the map, you can find portrait images, photographs of objects, videos and audio of performances, and biographical sketches.
In honor of the 40th anniversary of the National Heritage Fellows program, we’ve just completed updating and expanding the map to profile more than 150 masters of tradition.

Some GIS professionals might be tempted to see the Masters of Tradition display as just “dots on a map” — a seemingly random pattern that’s not particularly revealing or insightful, and that provides few hints of a larger pattern. They might have suggested that we create a heat map of Heritage Fellow occurrence, or that we locate the artists against a polychrome background of predominant ethnic groups. But it’s likely that neither would have provided important additional insights, and both would have unnecessarily complicated a celebratory story.
Sometimes dots on a map are more than just dots on a map. In this case, the map, and its icons, provide a home base — a common ground — on which to convene an extraordinary group of cultural leaders and exemplars. Consider this scattering of dots as a glimpse at the endlessly rich tapestry of American culture, where each individual, each community, adds its own threads to the rich and varied fabric that is American life. Or, to employ another metaphor, we can imagine these dots as a tiny sampling of a vast pointillist painting, where every one of us represents a speck of color — a dot — across a spectrum of traditions that combine to create a whole that is far greater than the sum of its individual dabs of pigment.
That’s the magic at which the dots on this map hint: out of this dizzying variety of backgrounds and traditions emerges a uniquely American culture that’s enriched, not muddied, by diversity.
At a time when prejudice and fear of the unfamiliar are on the rise, these dots on a map are a reminder that there’s endless joy, beauty, and fun in diversity, and that our nation is strengthened by its immigrant communities — whether those immigrants arrived via an Ice Age land bridge, or crossed the Atlantic or the Rio Grande fleeing poverty and persecution, or endured unimaginable suffering in the hold of a slave ship. We hope you enjoy this cultural journey across America.


Great story map! Is this a custom story map app? It doesn’t look like any of the templates available in the new ArcGIS Story Maps.
Hi Dara,
Glad you like the story map! Yes, I’m afraid it’s a custom effort, and isn’t available for others to use.
Allen