Authored by: Tomas Dorelis, Digital Solutions Engineer, UAB Kretingos vandenys
Water management company dispatch centers operate 24/7, but during weekends or at night, usually only technical personnel are on duty. If an accident occurs outside of working hours, providing high-quality information to the public becomes a challenge—it requires additional communication or IT specialists. In Lithuania, UAB Kretingos vandenys has created a system that fundamentally changes this paradigm: By utilizing spatial analysis and secure artificial intelligence, a single dispatcher can accomplish in a few minutes what previously required an entire team.
The Dispatcher Communicates with the Map
The core of the new system is a chat-based interface integrated directly into the ArcGIS Dashboards environment. This makes it feel like the dispatcher is communicating directly with the system.
The process starts simply: The dispatcher specifies the incident and shares its approximate location in the chat window—for example, “Disruption at Taikos St. 10-80.” At this point, the large language model (LLM) steps in, performing the initial analysis of the query.
After receiving the results of the analyzed query, the system performs a spatial analysis:
- Checking the specified address range against geographic information system (GIS) data
- Identifying all objects (houses, businesses) that are provided with services in that zone
- Marking the affected objects on the map
- Gathering precise statistics and reports to be sent to Lithuania’s National Energy Regulatory Council (VERT)

Critical functions of the system include not only registering service failures but also accumulating real-time statistics. The system automatically calculates how many objects (buildings) with valid service contracts are within the accident zone and precisely determines how many residents are living in them.
This radically changes the reporting to VERT. Previously, the head of the company’s drinking water department first collected all information regarding service disruption incidents and then analyzed it manually. This analysis involved visually counting the affected buildings on a map and multiplying them for an estimated resident count. At the end of the year, compiling this information required two full working days, yet the resultant data was strictly preliminary due to a lack of precise demographics. Retrieving historical data, physically counting buildings, and calculating the impact duration required disproportionate time investments that scaled directly to the incident’s size. This inefficient process is now optimized. The system records the exact time from the beginning to the end of the disruption for each unique object, while simultaneously counting the number of registered residents. All data is recorded in a separate data layer and directly linked to specific incidents within the task management system. This enables the fast and simple generation of accurate reports for VERT while establishing a reliable historical baseline, unlocking new opportunities for future data utilization.
Annual reports are no longer a tedious obligation but instead are an automatically generated, highly accurate dataset that allows the objective evaluation of service reliability.
Security by Design: Strict Data Control over AI Autonomy
While autonomous AI agents are a major trend in the tech market, Kretingos vandenys deliberately chose not to implement them. This decision was based not on doubts about the AI’s ability to perform tasks but rather on the absolute necessity to maintain strict control over the data fed to the artificial intelligence.
- Data governance over autonomy—Autonomous agents typically require broad, open-ended access to systems and databases to make decisions and execute multistep tasks. By replacing the agent concept with the n8n deterministic automation platform, the company dictates exactly which specific data points are extracted and shared.
- Absolute General Data Protection Regulation (GDPR) compliance—This architecture guarantees that only public nonsensitive information—such as the street name, fault type, and estimated repair time—is transmitted to the external LLM. Personal data—including surnames and phone numbers—never leaves the company’s secure internal servers.
- The LLM as an isolated text processor—Instead of allowing AI to navigate systems independently, the workflow utilizes a basic LLM purely as an isolated tool. The LLM receives a strictly controlled dataset and instructions (prompts) to generate grammatically correct, uniformly structured texts for public announcements, ensuring high-quality communication without exposing the underlying subscriber databases.
From Manual Message Writing to Automated Article Publication
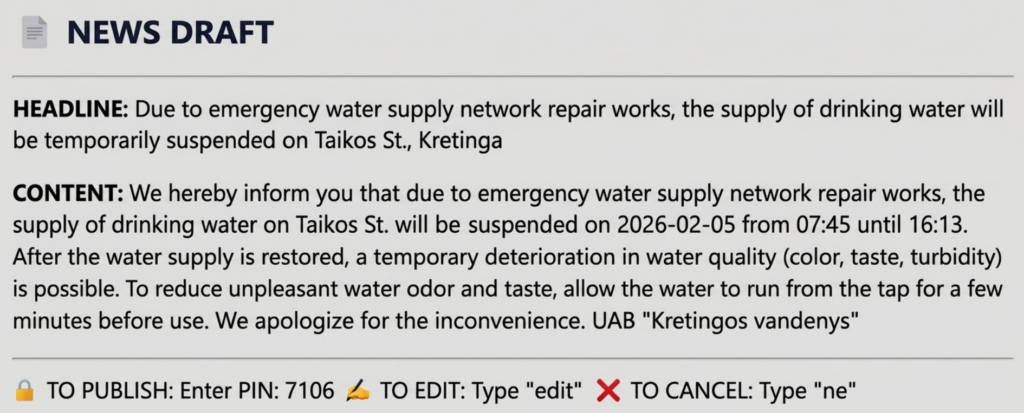
One of the greatest innovations is the automated execution of public relations (PR) functions. When the dispatcher selects a registered job ID from the task management system, the system offers to generate public announcements.
The LLM, utilizing strict instructions (prompts), forms grammatically correct, uniformly structured texts designed for the company’s website and Facebook page. As a result, the company maintains the following:
- Uninterrupted public information during weekends and holidays—Communication specialists typically do not work during these times, making the prompt publication of announcements complicated in the past. Now the dispatcher, even when working alone, resolves this issue independently and professionally.
- Control—Before publication, the dispatcher always retains the ability to manually adjust the text, but experience shows this is almost never necessary.
Customer Experience: A Personalized Message Rather Than a General Announcement
In parallel with public information, the system radically changes individual customer notification. By selecting the same disruption ID, the dispatcher can initiate the dispatch of short message service (SMS) messages and emails.
This is not a mass notification to the entire city. The system, using subscriber management system data that is updated every morning, sends messages only to those subscribers who are within the zone determined by spatial analysis. The resident first receives specific information (“DISRUPTION: Taikos St. 78. Due to emergency failures, there will be no water from 02-26 08:00 to 02-26 16:30”) and later a notification that the problem has been resolved.
Dynamic Visualization with Arcade: Synergy Between the Chat Tool and the Map
In the Esri ArcGIS ecosystem, the value of data depends directly on the speed and clarity of its visualization. To maximally facilitate the dispatchers’ work, complex ArcGIS Arcade scripts are integrated into the ArcGIS Dashboards environment, working in complete synergy with the automated chat interface.
When a dispatcher performs an action via the chat window—such as registering a new failure report or initiating the notification process—the database updates instantly. Simultaneously, Arcade expressions capture these changes to dynamically update the information panels. Both the textual information and the changing colors within the List tool unambiguously indicate the exact communication status:
- Whether customers have already been informed about the start of the disruption
- Whether a notification about resolution has been sent
- Through which specific channels (SMS, email, website, or social networks) notification was executed
This visual feedback is critical in operational work. It allows the dispatcher to assess the situation at a glance, ensures that residents are reached through all possible communication channels, and strictly prevents human errors—such as accidentally sending duplicate messages.
Public Map: Isolated Data via Hosted Feature Layers
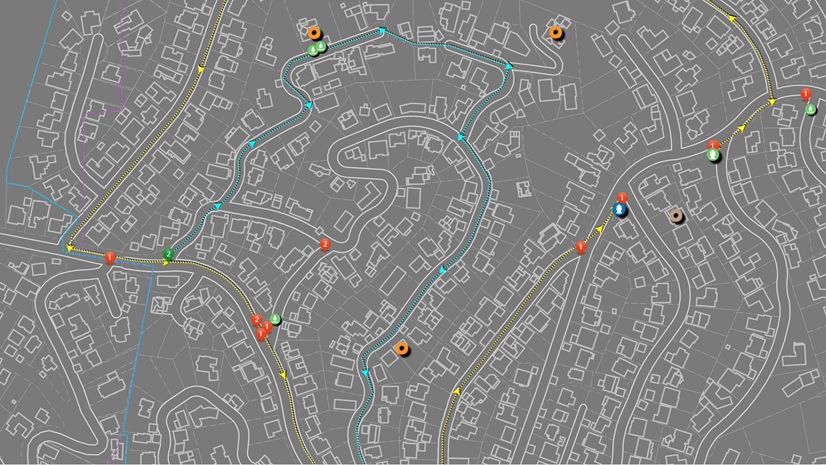
In parallel with internal processes, the same fault registration data processed by the chat system is immediately used to create an interactive public map, where residents can monitor current and planned service disruptions. Here again is strict application of the principle of security by design.
For public display, direct operational data is not used; instead, specially restricted ArcGIS hosted feature layers (views) are utilized. This architecture ensures that:
- Users see only what is necessary—The public map displays strictly isolated information—the affected objects (represented as points on the map), the street name, and the estimated resolution time.
- Sensitive data remains locked—All internal subscriber data, contact information, technical crew comments, and infrastructure vulnerabilities remain strictly separated in the base layer, from which public access is blocked. This eliminates the risk of accidental data leaks or unauthorized data downloads.
Additional Value: Combatting Unauthorized Connections
The system also features a powerful statistics module. By specifying a settlement and street, the tool:
- Calculates the number of official service contracts on the street
- Indicates the number of declared residents there
- Isolates buildings that physically exist and have residents but lack valid service contracts
- Marks buildings without service contracts on the map
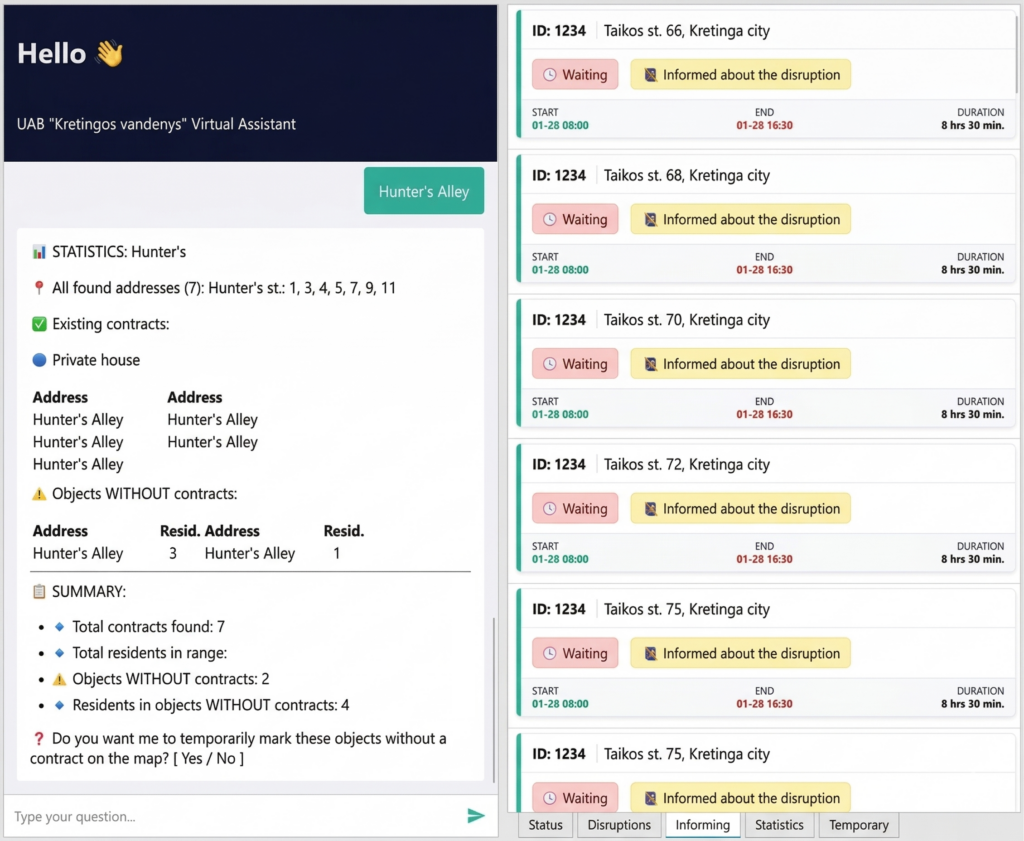
This functionality allows for more accurate planning of accident mitigation but also effectively identifies possible unauthorized connections and determines potential future consumers. Although staff had applied similar methods in the past, they were working with static data that was difficult to update. This new method provides access to the latest available data, consequently saving time when verifying data accuracy.
The Missing Foundation: Automated Daily Data Synchronization and Reverse Engineering
The spatial analysis and automated communication framework relies on one critical requirement: up-to-date data. Historically, direct integrations between specialized subscriber management systems and GIS platforms are considered cost prohibitive, with development expenses far exceeding the operational benefits. Furthermore, official API integrations for the company’s existing billing systems were not natively supported or available.
To bypass these limitations, the data extraction was achieved through reverse engineering. By introducing third-party technology—the n8n automation platform—as intelligent middleware, the company circumvented the need for expensive custom vendor developments and achieved what was previously deemed impossible. This fully automated synchronization workflow eliminates manual database exports and acts as the engine running under the hood before a dispatcher ever interacts with the map.
How the Synchronization Process Works
Every morning at 7:00 a.m., a scheduled trigger initiates a multibranch workflow that bridges the company’s internal databases with the ArcGIS environment:
- System authentication via reverse engineering—Since official APIs are absent, the workflow uses reverse-engineered authentication to securely sign in to the company’s subscriber management system and its dedicated subsystem. It automatically requests and downloads the latest data records concerning infrastructure objects, active service contracts, and payer contact details.
- Data transformation and cleansing—Raw tabular data is rarely GIS ready. The system intercepts the data and runs a transformation script. It standardizes date formats and utilizes logic to parse complex Lithuanian addresses (e.g., separating village names from house numbers, stripping out apartment numbers) to prepare them for high-accuracy mapping.
- Direct ArcGIS integration and automated geocoding—Once the data is structured, the workflow connects to ArcGIS REST API via a secure token to update the core datasets. As the system automatically publishes and overwrites the hosted feature layers, it executes a geocoding process. This translates the cleaned, text-based addresses into precise spatial coordinates (X/Y) on the map, effectively bridging the gap between flat billing data and actionable spatial intelligence.
- Persistent coordinate standardization—The workflow actively queries the database for newly uploaded records missing explicit spatial data (X/Y coordinates). Once the GIS server geocodes these addresses, the workflow extracts the generated geometry and writes the exact coordinates permanently into the dataset. This ensures that downstream processes can access coordinates instantly without repeatedly querying the GIS server.
The Business Value
By the time dispatchers begin their shift, the map is already populated with the absolute latest customer contracts, missing-contract flags, and contact information. This zero-touch data pipeline guarantees the accuracy of the statistics module and ensures that the LLM sends personalized notifications only to current residents, completely validating the use of the middleware approach.
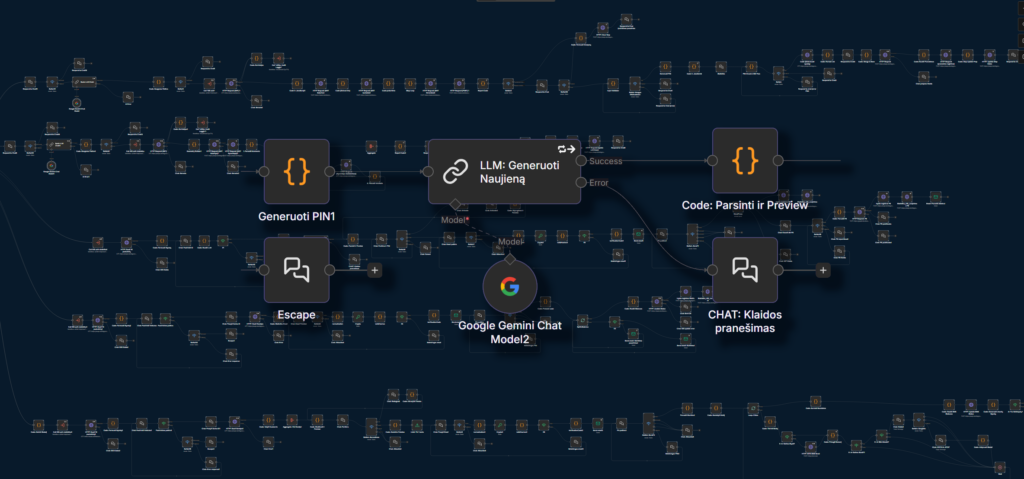
Complex on the Inside, Simple on the Outside: 245 Logical Nodes Just Six Clicks Away
Although a complex architecture consisting of 245 logical nodes operates in the background, the process is maximally simplified for the dispatcher. At each stage (identification/publication/notification), they need to perform no more than six actions in the chat window—mostly just confirming a generated action or canceling it.
Several safeguards are implemented to ensure security:
- Double authentication—Prevents unauthorized personnel from submitting information to the public space (e.g., mass SMS dispatch).
- Random PINs—For critical actions, the system generates a random PIN that the dispatcher must enter. This protects against an accidental mouse click.
- Loop-escape mechanisms—This ensures that the dispatcher does not get stuck in an endless waiting cycle if one of the processes (e.g., entering wrong PIN) fails.
Technological Independence and Open Source Capabilities
The example of UAB Kretingos vandenys demonstrates that modern dispatch systems do not require massive investments, complex licensing models, or large IT departments. The most striking metric of this project is its timeline: The entire system—from reverse-engineered data pipelines to the AI-integrated chat interface—was built and deployed by a single individual in just 10 weeks. This rapid deployment was achieved by utilizing AI as an active development assistant and applying a deep understanding of process architecture. The n8n automation platform (a tool based on open-source technology) served as the architectural core, seamlessly integrating GIS, the subscriber database, and the LLM into a unified mechanism.
This signals a paradigm shift for the water management sector. By combining flexible open-source solutions with AI-accelerated development, companies can independently engineer custom-tailored tools. This approach not only optimizes capital expenditure but also secures operational agility, granting the freedom to iterate and improve processes internally to meet the company’s evolving needs.

Stay Connected with Esri’s Water Team
ArcGIS is an extensive information system that enables modernization of workflows with easy-to-use applications for the field and office. Strengthen your organization with geospatial solutions that will increase efficiency and provide insight for decision-makers.
Visit the Esri Water Utilities web site for more information.
Subscribe to the Water Industry newsletter “Esri News for Water Utilities and Water Resources“
Learn more about how GIS supports digital transformation.