ArcGIS helps stormwater staff improve data accuracy, streamline reporting, and gain operational insights
For stormwater programs, regulatory compliance depends on accurate data, consistent inspections, and the ability to quickly produce documentation for annual reporting. For the City of Pomona, California, managing compliance activities across two watersheds and hundreds of miles of stormwater infrastructure had become increasingly difficult using paper forms and spreadsheets. By implementing ArcGIS, the city transformed its approach to stormwater asset management, inspections, and National Pollutant Discharge Elimination System (NPDES) reporting.
Today, geographic information system (GIS) technology serves as the central system for managing inspections, tracking maintenance activities, supporting reporting requirements, and helping decision-makers prioritize investments that protect the community and improve water quality.
Managing Stormwater Compliance Across Two Watersheds
The City of Pomona’s Water Resources Department is responsible for stormwater compliance activities throughout a community that is largely designated as disadvantaged. The city operates under two permits covering the Santa Ana and San Gabriel watersheds, requiring ongoing inspections, maintenance, debris removal, and regulatory reporting.
The stormwater system includes the following:
- 1,271 city-owned stormwater inlets
- 103.47 miles of drainage infrastructure
- 12.19 miles of open channels
- 208 trash capture devices
- Multiple discharge points and monitoring locations
To maintain compliance, staff inspect and clean stormwater assets based on risk and permit requirements. Priority assets receive multiple inspections during the wet season, while lower-priority facilities follow less frequent schedules. A key reporting requirement is documenting the amount of debris removed from the stormwater system, including trash collected from channels and capture devices, while also identifying infrastructure that may require repair or rehabilitation.
Moving Beyond Paper-Based Workflows
Before implementing GIS, stormwater compliance activities relied heavily on paper forms, handwritten field notes, and spreadsheets. Field crews completed inspections manually, and staff dispatched work based on paper maps and institutional knowledge. Information was often stored in multiple locations, making it difficult to track completed work and compile reporting data.
The process presented several challenges:
- Paper records could be misplaced or damaged.
- Data existed in multiple systems.
- Tracking inspection history was difficult.
- Staff struggled to determine what work had been completed and what remained outstanding.
- Part-time operations staff faced high turnover.
- Annual reporting required significant manual effort.
At the time, Pomona managed separate compliance reports for multiple permits. Preparing each annual report could take approximately two months as staff sorted through paperwork, compared records, and manually compiled information.
As regulatory requirements evolved, city staff recognized the need for a more efficient and defensible process.
Establishing a GIS Foundation
In 2021, the City of Pomona began a major effort to digitize its stormwater infrastructure. Prior to that initiative, much of the system had not been captured in GIS.
To support the effort, the city worked with Draw Tap GIS, an Esri partner that has Esri’s State and Local Government Specialty designation and is based in Fullerton, California. Draw Tap GIS provides GIS consulting services to local government, public safety, and utility agencies, helping organizations implement the ArcGIS platform to improve operational efficiency and enterprise engagement. The company is committed to configuring ArcGIS solutions first and customizing second, enabling clients to accelerate deployment while leveraging proven industry best practices.
The project was led by the Draw Tap GIS team:
- Patrick Ward, MS GIS, GISP, President
- Rosemary Carvajal, MS GIS, GIS Manager
- Anjan Rana Magar, MS GIS, GIS Specialist
- Timothy Broz, MS GIS, GIS solution Specialist
Working closely with City of Pomona staff, the Draw Tap GIS team helped implement ArcGIS Enterprise and develop a comprehensive GIS framework supporting stormwater asset management, inspections, maintenance tracking, and compliance reporting. The following City of Pomona staff members participated in and shaped the project:
- Chris Diggs, Water Resources Director
- Jorge Anaya, Senior Water Resources Engineer
- Nichole Horton, Principal Water Engineer
- Julie Carver, Environmental Compliance Supervisor
- Alex Curry, Water Operations Crew Chief
- Charles Spencer, Stormwater Maintenance Technician II
- David Carbajal, Stormwater Maintenance Technician I
- Damien Dominguez, Stormwater Maintenance Technician I
- Anthony Ortega, Management Analyst
The initial focus was on collecting data and establishing a digital foundation for future asset management activities.
“Most of the infrastructure was not digitized,” explained Anthony Ortega, City of Pomona Management Analyst. “The primary goal was capturing the data and creating a GIS presence.”
As the GIS program matured, staff expanded their work beyond asset mapping to develop inspection and maintenance workflows that support compliance activities and operational decision-making. With support from Draw Tap GIS, the city leveraged ArcGIS Enterprise, ArcGIS Field Maps, ArcGIS Dashboards, and automated workflows to create a more connected and efficient stormwater management program.
Connecting Field Operations with ArcGIS
Pomona initially used ArcGIS Survey123 for inspection activities and then transitioned to ArcGIS Field Maps to create a more integrated field experience.
Working closely with field crews, City of Pomona GIS staff designed smart forms that reflected actual maintenance workflows and inspection needs. The collaborative approach ensured that the technology would support daily operations rather than creating additional work for crews.
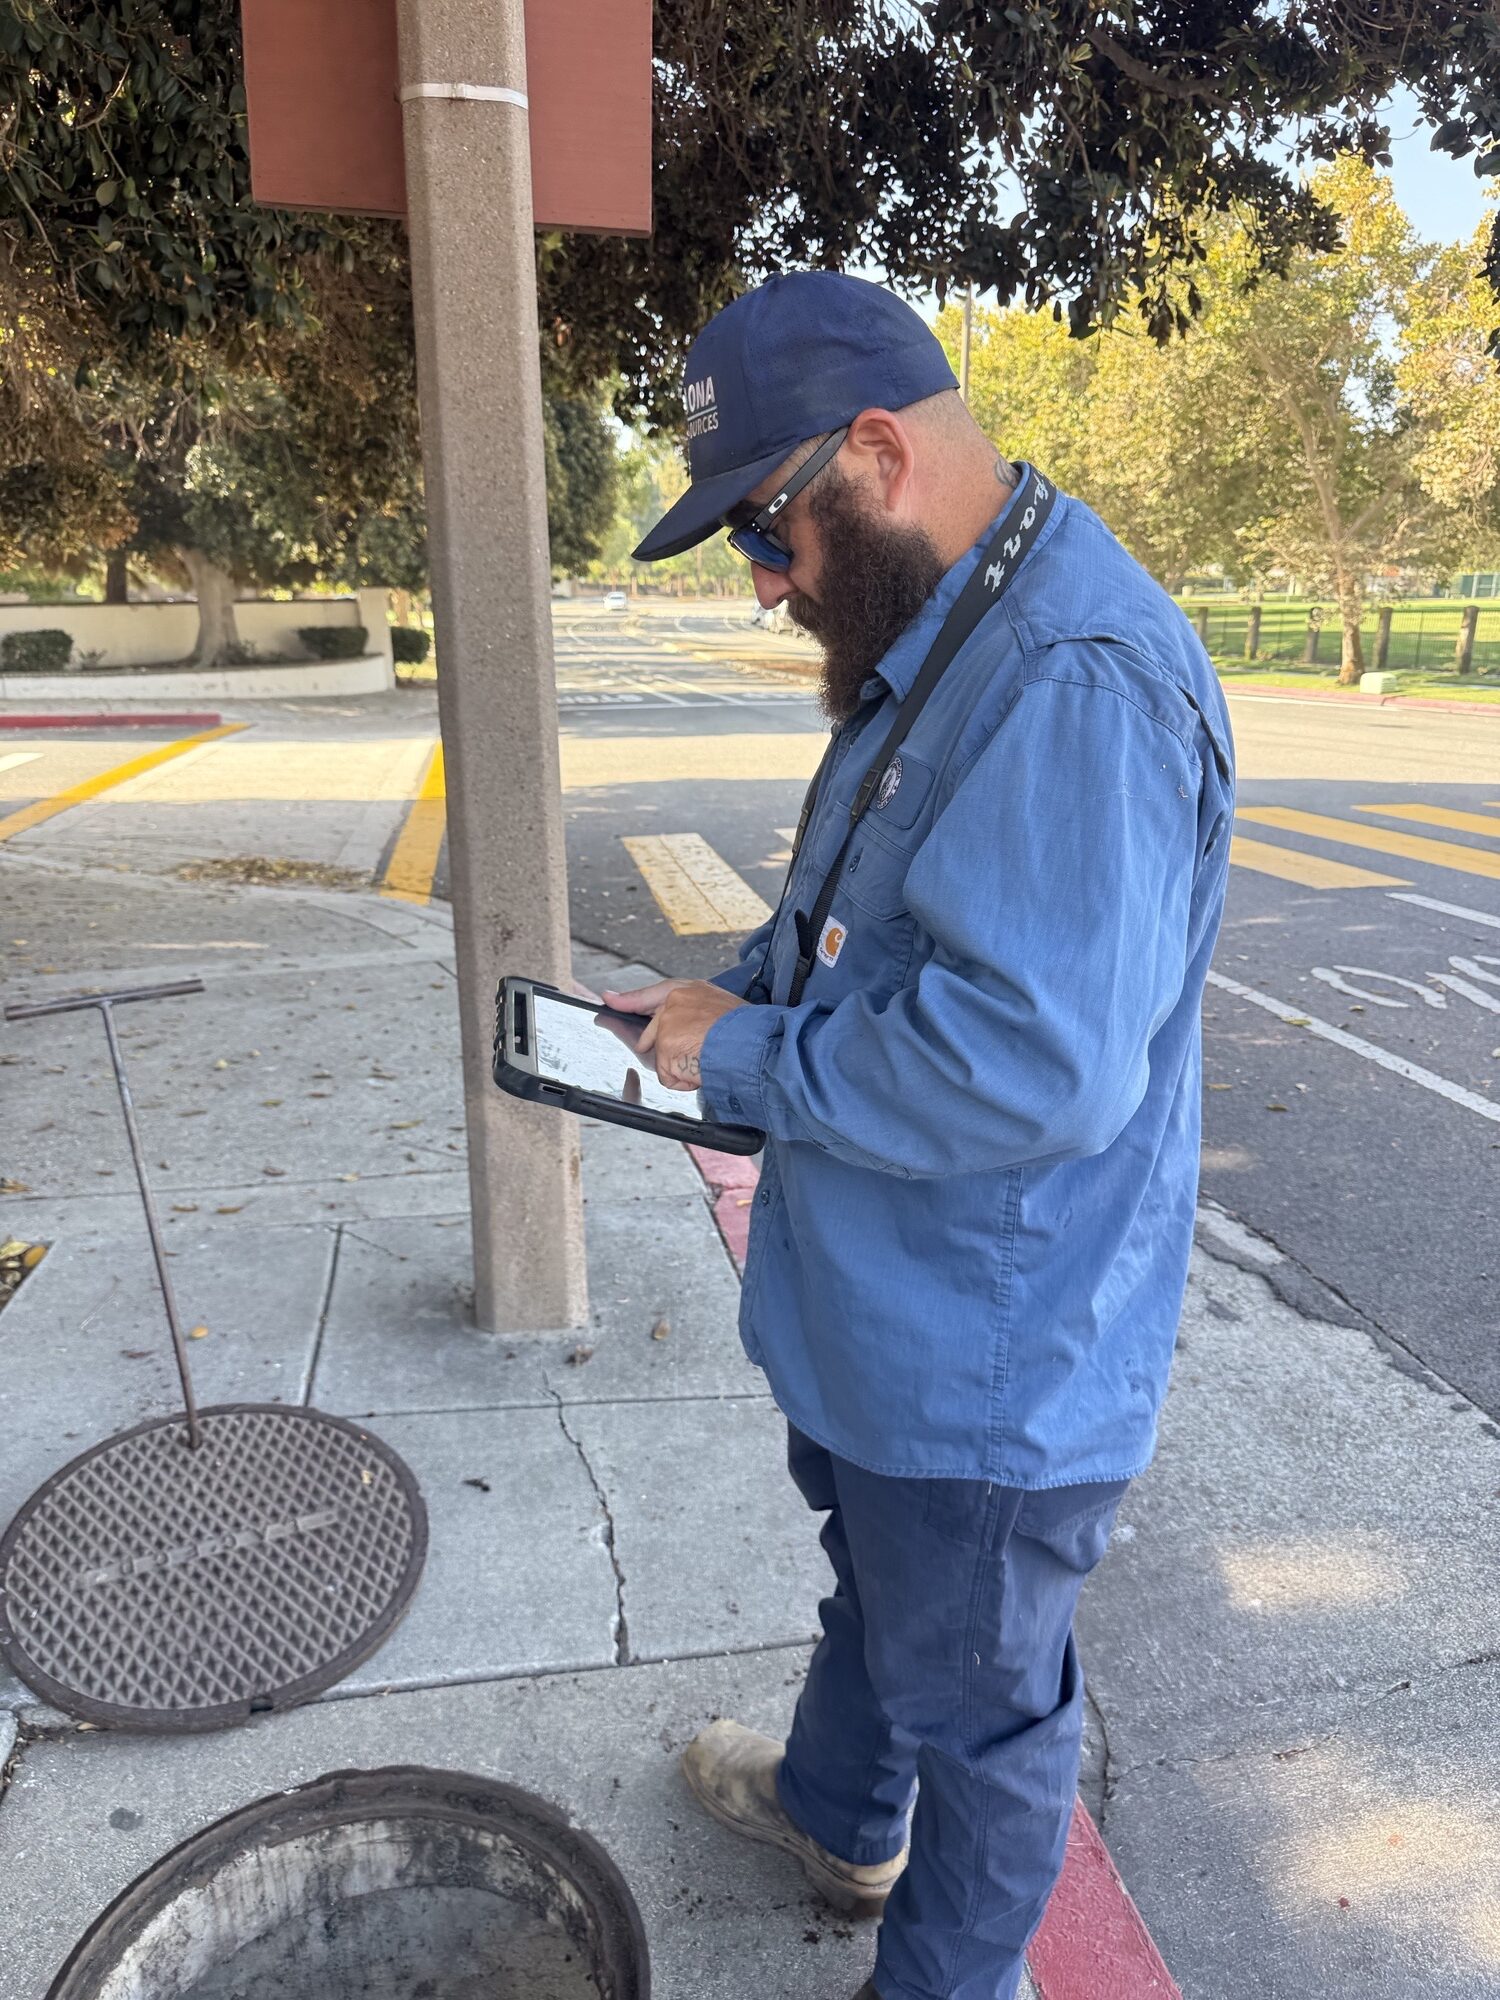
Today, field personnel use iPads running ArcGIS Field Maps to access assets, record inspections, document maintenance activities, and capture photos directly from the field.
Here is what the GIS-based workflow now manages:
- Storm drains
- Inlets
- Open channels
- Trash capture devices
- Discharge points
- Stormwater maintenance hot spots
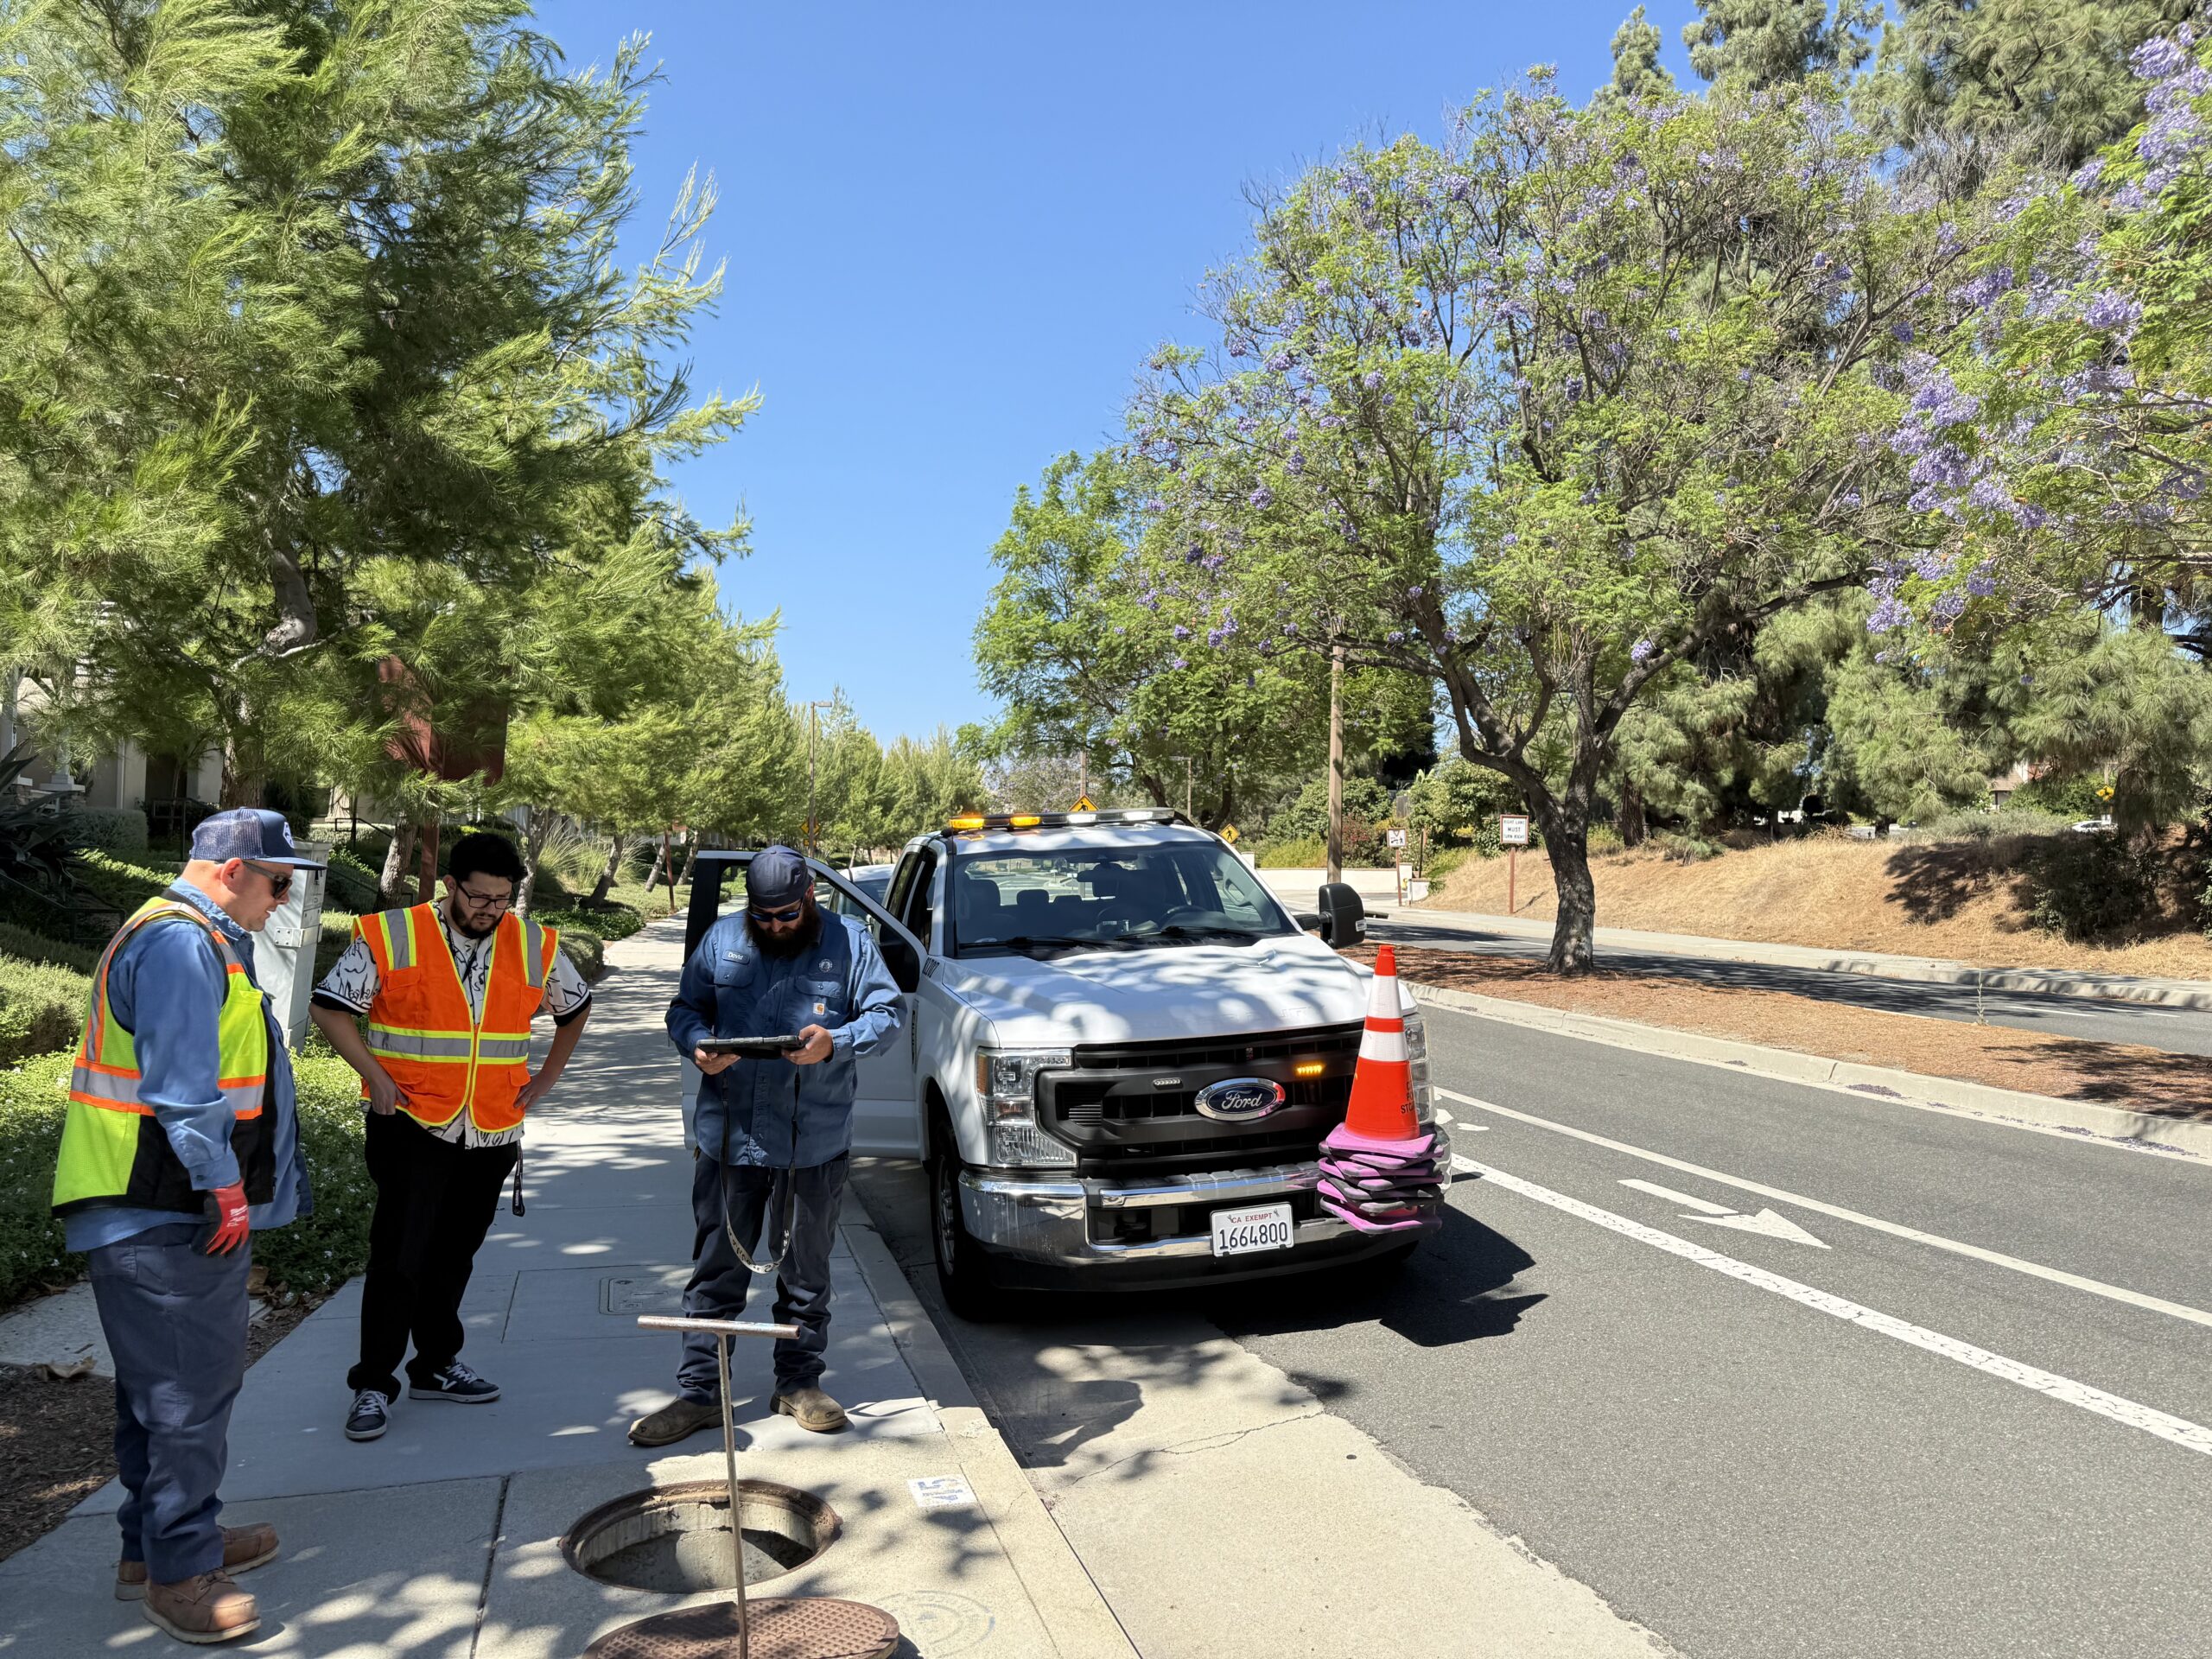
Attribute rules automatically update maintenance status based on inspection submissions, helping staff identify assets that still require cleaning or follow-up activities.
Turning Inspection Data into Actionable Insights
A major advantage of the city’s GIS implementation is improved visibility into system conditions and maintenance activities. Interactive dashboards provide real-time access to inspection data, allowing staff and managers to monitor progress, evaluate workloads, and identify areas requiring attention. Historical inspection records are available directly within maps, giving crews immediate access to previous observations, comments, photographs, and maintenance history.
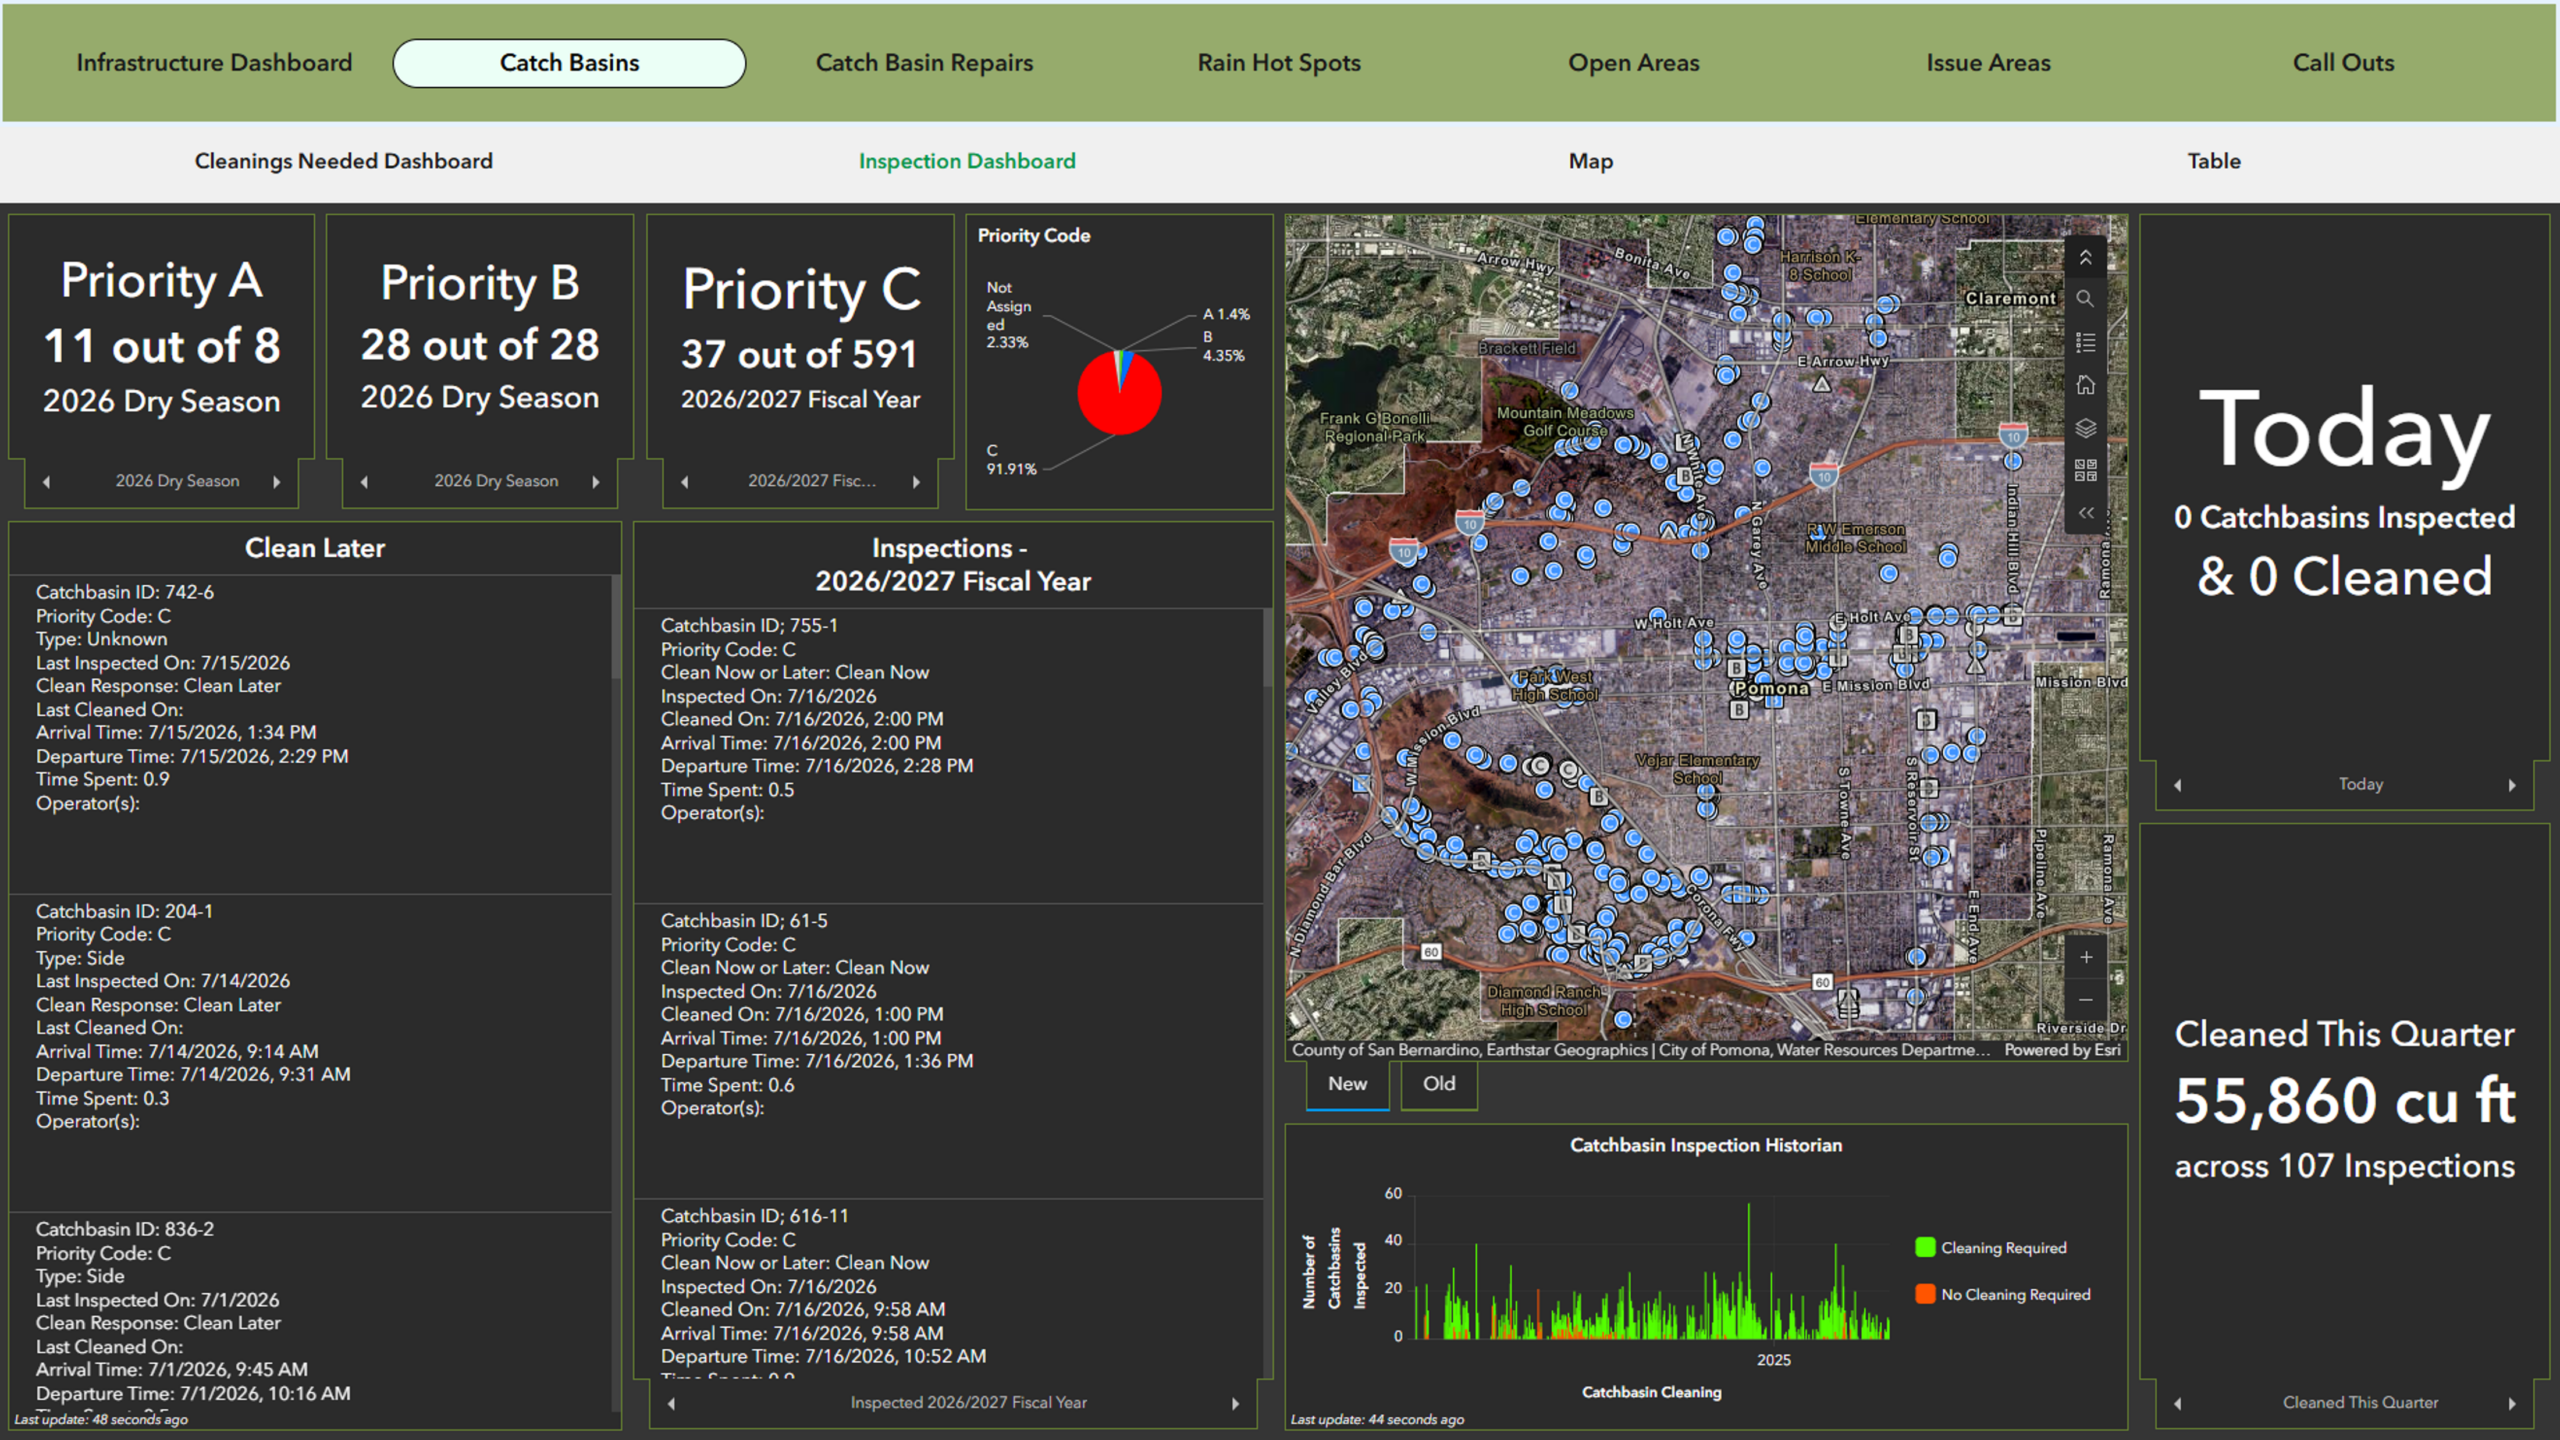
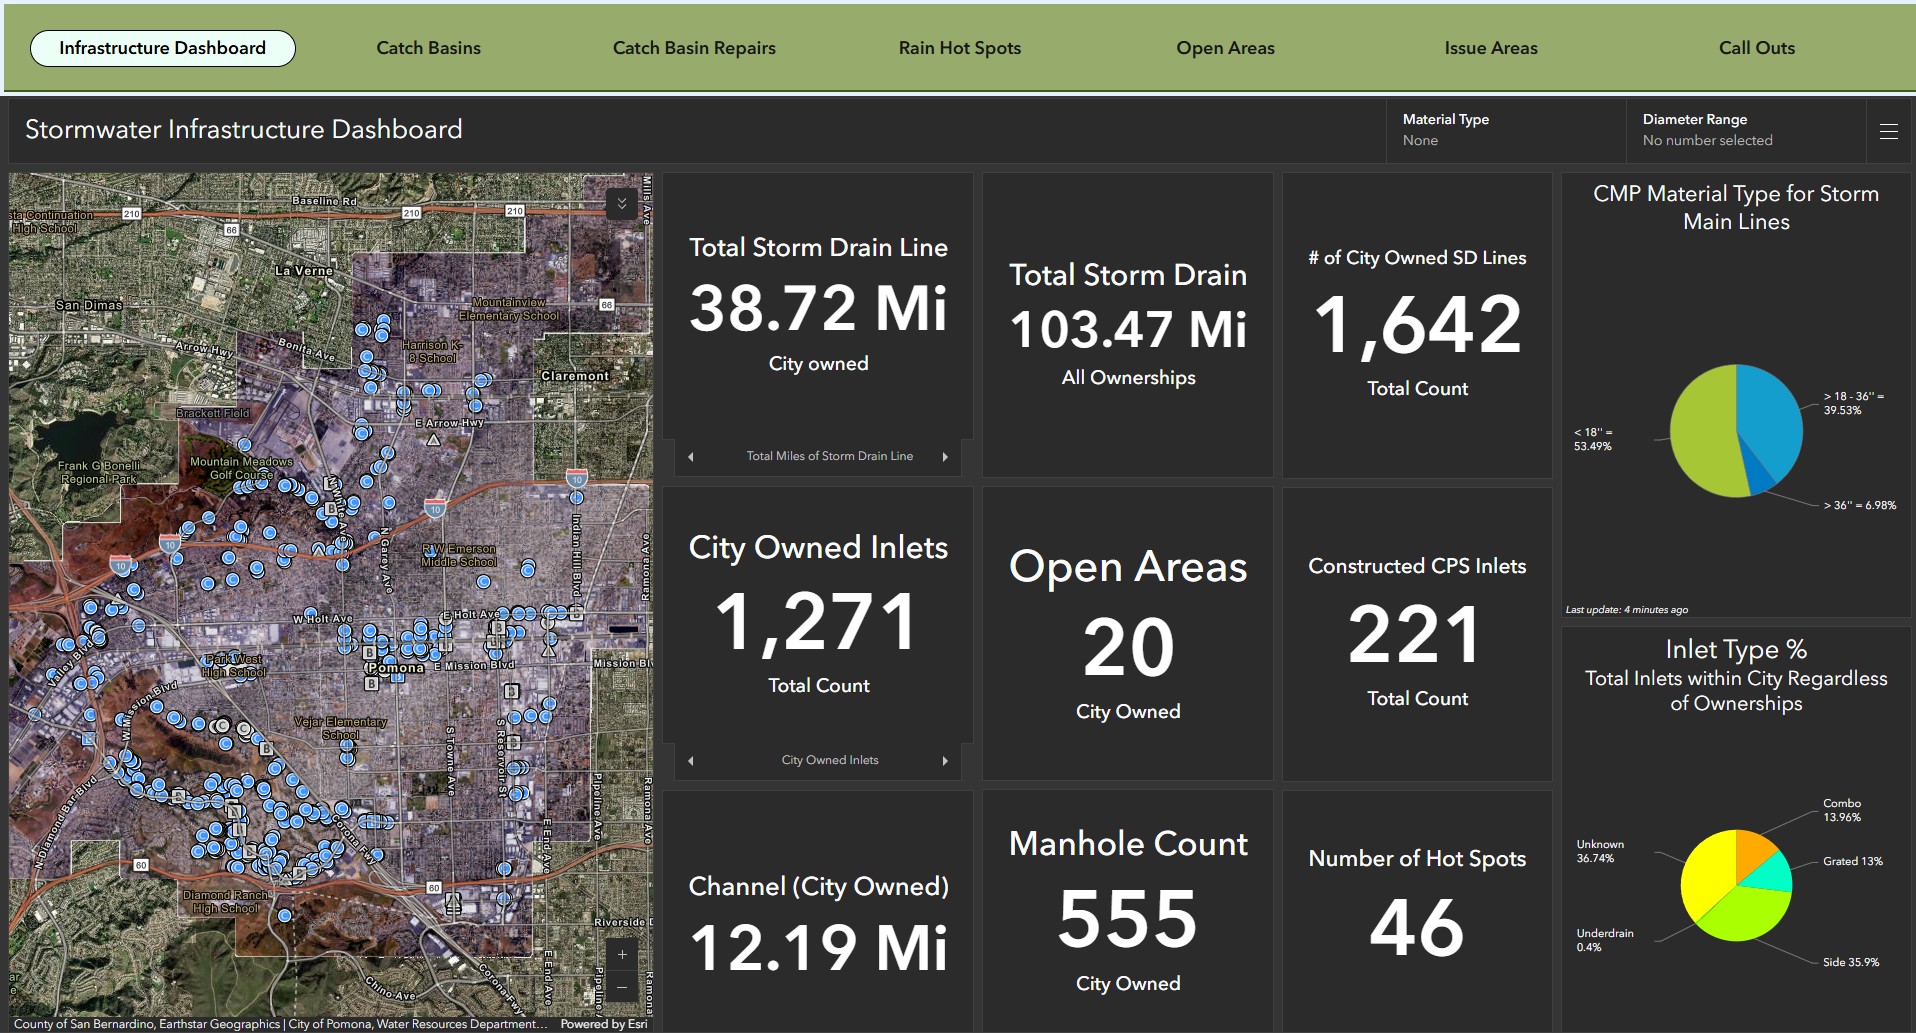
City staff utilize ArcGIS Dashboards for system insight as well as oversight of infrastructure inspections.
The system helps staff answer critical operational questions:
- Which assets have been inspected?
- Which locations require cleaning or follow-up?
- Where are maintenance hot spots showing up?
- How much debris has been removed?
- What assets may require repair or rehabilitation?
Photographs collected during inspections provide before-and-after documentation that supports reporting requirements and helps verify maintenance activities.
Streamlining Annual NPDES Reporting
Perhaps the greatest benefit has been the impact on regulatory reporting.
Previously, preparing annual reports required extensive manual review of paper records and spreadsheets. Today, GIS staff can quickly extract inspection and maintenance data directly from ArcGIS, significantly reducing the effort needed to produce permit reports.
The city now uses dashboard exports and GIS-based data summaries to generate the following:
- Inspection totals
- Maintenance records
- Volume of debris removal
- Asset status reports
- Historical activity summaries
According to staff, reporting timelines have been shortened by months.
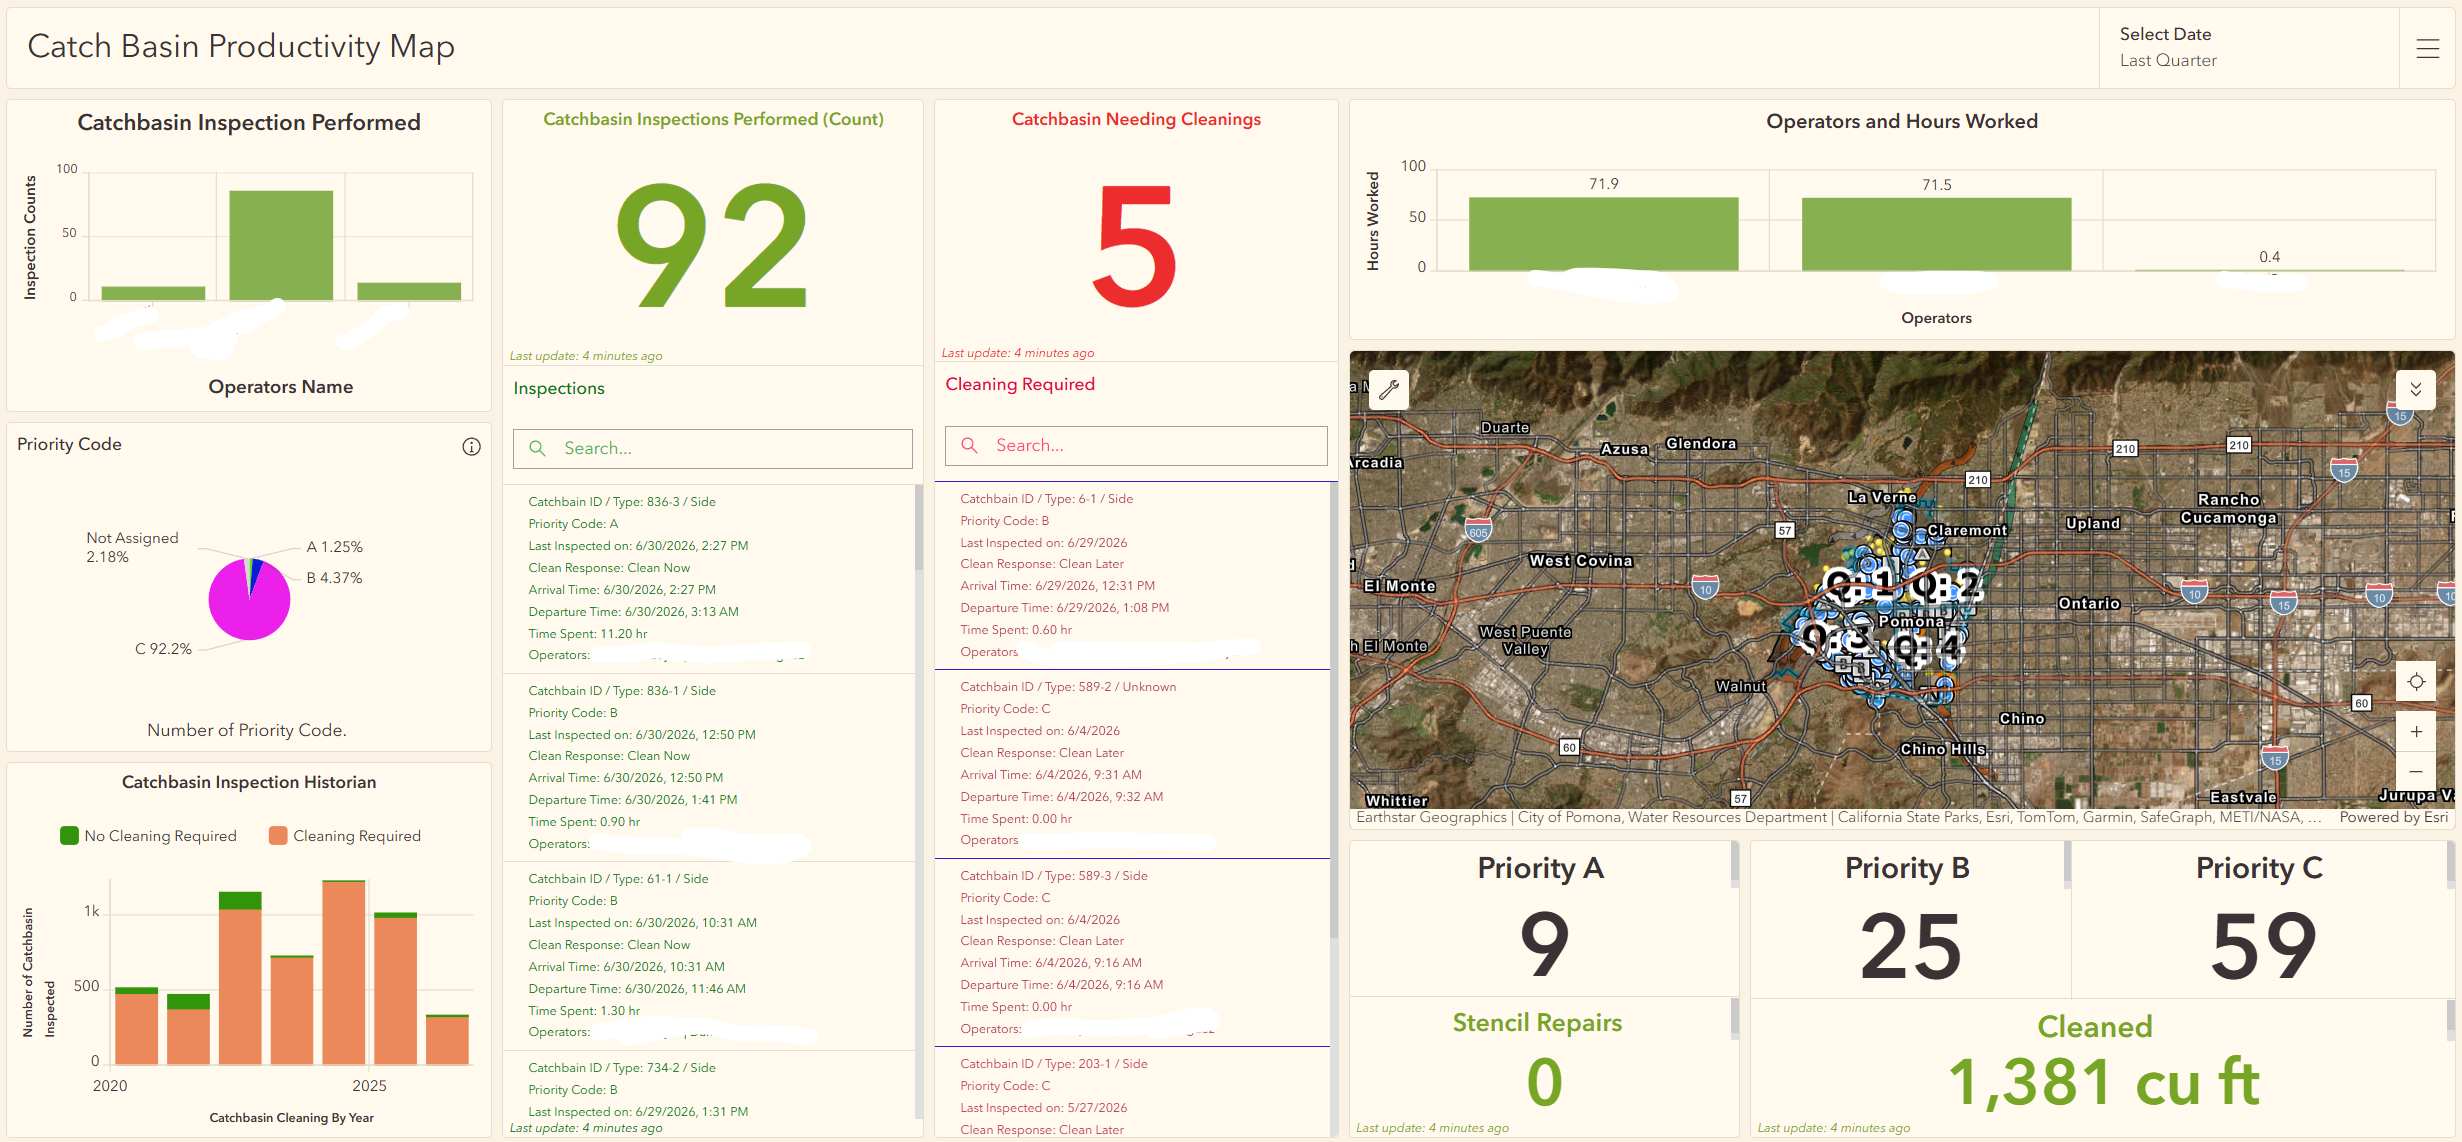
What once required extensive paperwork review can now be accomplished through data exports and automated summaries, allowing staff to focus more time on compliance activities and less time on report preparation.
Improving Data Quality and Accountability
The city’s GIS program has also dramatically improved confidence in its stormwater data.
Early data collection efforts showed significant gaps and inconsistencies, with only an estimated 25 to 30 percent of infrastructure information considered accurate. Through focused quality assurance processes, collaboration between engineering interns and field crews, and ongoing GIS refinement, data accuracy has steadily improved. Today, the city estimates that asset information and inspection records are approaching 90 to 100 percent accuracy.
Several practices contributed to this improvement:
- GIS-based quality assurance workflows
- Error-tracking dashboards
- Field verification processes
- Standardized domains and data-entry controls
- Collaboration between GIS staff and field personnel
The result is a more reliable and defensible data repository that supports compliance reporting and operational planning. Read more about this effort in this ArcGIS StoryMaps story, hosted by the City of Pomona: City of Pomona: Smart Stormwater Monitoring.
Supporting Better Decisions Across the Organization
Beyond achieving compliance benefits, the GIS program is helping the city make more informed business decisions. Managers now have greater visibility into staff workloads, maintenance demands, and infrastructure conditions. The data helps justify equipment purchases, staffing requests, and budget priorities.
GIS also strengthens communication between operations staff, management, city leadership, and elected officials. By providing clear evidence of maintenance activities, debris removal efforts, and infrastructure needs, City of Pomona staff can more effectively communicate resource requirements and demonstrate the value of stormwater investments.
Lessons Learned
According to city staff, one of the most important lessons learned was the value of staff involvement throughout implementation.
Field crews played a critical role in shaping workflows, providing feedback, and ensuring that the system supported daily operations. Their buy-in helped drive adoption and improve data quality. The city also discovered that GIS provides far more than a compliance tool. It creates a foundation for accountability, asset management, operational efficiency, and community protection.
For organizations considering a similar modernization effort, Pomona’s advice is straightforward: Involve staff early, focus on data quality, and build workflows that support both compliance and operations.
Looking Ahead
The City of Pomona continues to expand its GIS capabilities. Future plans include automating additional workflows and leveraging ArcGIS Field Maps to further improve task management and operational efficiency.
As regulatory requirements become increasingly complex, the city is building on a strong digital foundation that supports compliance today while positioning the organization for more advanced asset management and infrastructure planning in the future.
By transforming paper-based processes into a GIS-driven workflow, the City of Pomona has improved reporting efficiency, increased data accuracy, and gained the operational insight needed to better protect water quality and serve its community.
“GIS has brought efficiency, accountability, and effectiveness to our NPDES compliance program. I have high confidence that the reporting accuracy provided is the best that could be offered compared to the pen-and-paper method. The worrying of paper integrity and the quickness of reporting has never been easier for day-to-day work. GIS provides readily available information when reporting for our two NPDES permits with simple filtering and data that was previously gathered. Compliance management would look very outdated with months needed to perform what we do now in mere minutes. Accuracy and accountability risks have been reduced with this approach. I do not see a compliance strategy without GIS.”—Anthony Ortega, Management Analyst, City of Pomona
Photos provided by City of Pomona staff member Maxus Wong.
Stay Connected with Esri’s Water Team
ArcGIS is an enterprise geospatial platform that enables modernization of workflows with easy-to-use applications for the field and office. Strengthen your organization with geospatial solutions that will increase efficiency and provide insight for decision-makers.
Visit the Esri Water Utilities web site for more information.
Join the Water Utilities Community
Follow #EsriWater on social media: X | LinkedIn
Subscribe to the Water Industry newsletter “Esri News for Water Utilities and Water Resources“