Authored by: Peter Vitt, Senior GIS Project Manager, Santa Ana Watershed Project Authority
The Santa Ana Watershed Project Authority (SAWPA) was formed in 1975 as a Joint Powers Authority under California law. SAWPA’s mission is to develop and maintain regional plans, programs, and projects that protect the Santa Ana River (SAR) Watershed while maximizing the beneficial uses of its water resources in an economically and environmentally responsible manner.
A longtime threat to the SAR Watershed’s water resources is the invasive plant species Arundo. Arundo is an invasive grass species pervasive in the stream channels of the SAR Watershed. It was likely introduced to the watershed for erosion control along irrigation channels. Arundo is problematic because it uses a lot of water, replaces native habitats, and presents a fire hazard due to its very dense growth pattern.
A study by the California Invasive Plant Council (Cal-IPC) in 2011 estimated approximately 1,400 acres of Arundo within the watershed. Past and present Arundo removal efforts conducted by Resource Conservation Districts and other agencies have removed significant amounts of the plant from the watershed. But because of the dense root structure and fast-growing nature of the plant, it is difficult to eradicate. Since it had been nearly 15 years since the last Arundo estimate was conducted, SAWPA wanted to do a watershed-wide assessment to evaluate the current magnitude of the problem and get an idea of how effective ongoing removal efforts have been in reducing its presence.
Challenge
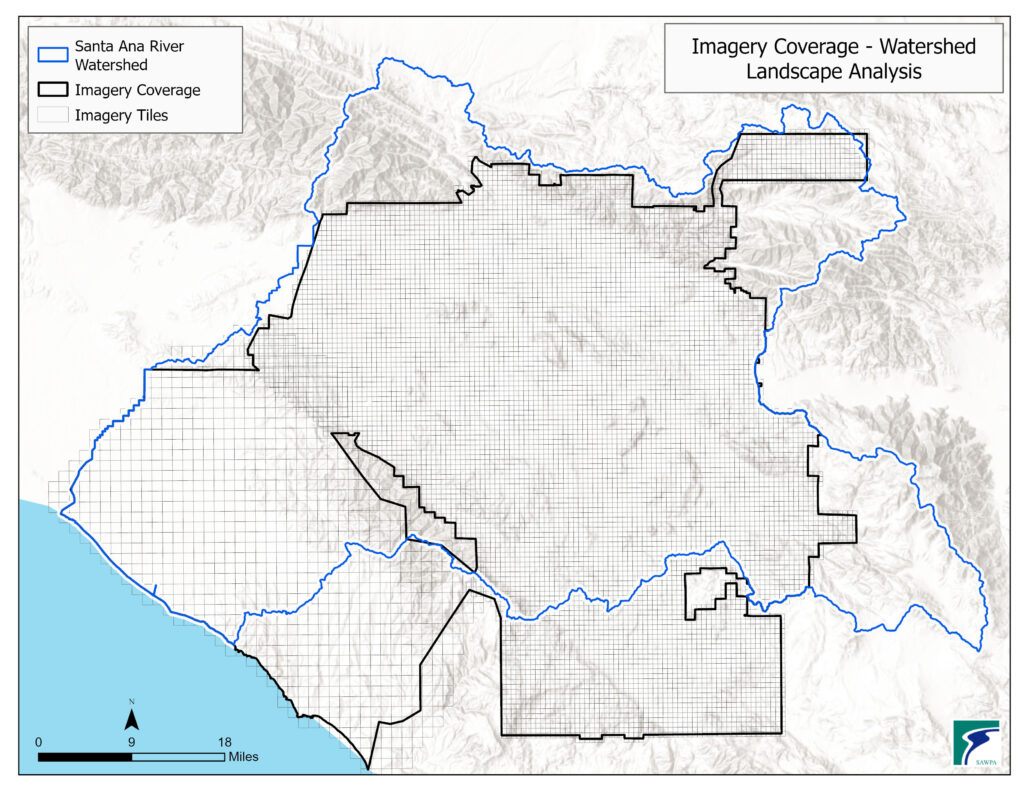
The watershed is very large and encompasses approximately 2,800 square miles across four counties in Southern California, including western Riverside and San Bernardino Counties, northern Orange County, and a slice of southeastern Los Angeles County. Because of the watershed’s large size, SAWPA did not have the time or resources to do field investigations, and digitizing Arundo plants from aerial imagery across such a large area would not have been accurate or timely.
Solution
The solution was to employ Esri’s deep learning tools in ArcGIS Pro to identify Arundo on imagery and limit the assessment area to places where Arundo was likely present.
Identify Areas for Analysis
Areas for analysis included those where Arundo was most likely to be found and where it has historically been found in the watershed. These included:
- Stream channels.
- Areas where Arundo was previously identified and/or removed by Resource Conservation Districts or other agencies.
- Areas where significant Arundo was identified in the Cal-IPC 2011 Study.
- Groundwater recharge basins.
We used the Santa Ana River Regional Water Quality Control Board’s Basin Plan to identify major stream channels and identified smaller stream channels from aerial imagery and the USGS National Hydrography Dataset flowline GIS layer. The Santa Ana Watershed Association (SAWA) provided GIS layers of Arundo removal sites, and SAWPA member agencies provided GIS layers for groundwater recharge basins.
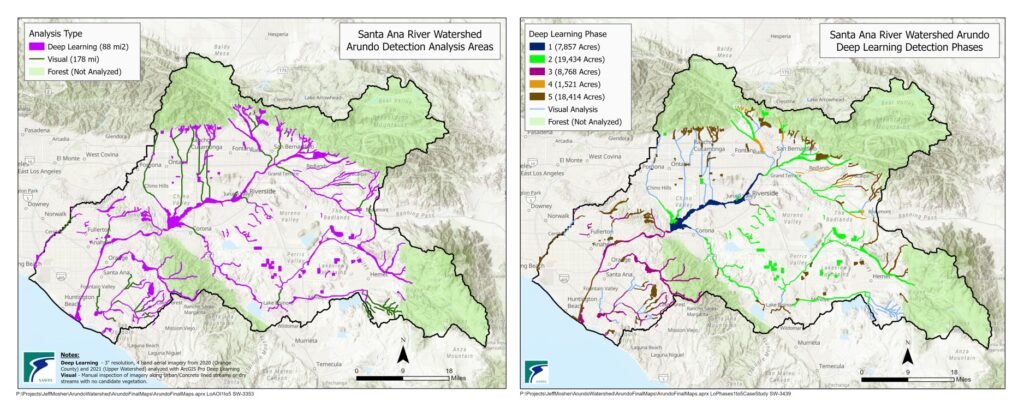
The project was divided into five phases based upon geography and area type. In addition to deep learning analysis, we conducted a visual inspection of the imagery for Arundo along concrete-lined stream channels and dry streambeds with little or no vegetation.
Imagery, Hardware, and Software
We had three-inch resolution four-band aerial imagery for the watershed from a previous landscape analysis project we did with the US Bureau of Reclamation (USBR). This imagery consisted of more than 8,500 tiled GeoTIFFs collected in 2020 and 2021.
Initially, hardware consisted of a Dell workstation with an IntelÒ XeonÒ W-2225 CPU @ 4.10 GHz processor, 64 GB of RAM, and a 5 GB graphics card. We did some deep learning processing tests to get an idea of how well the hardware configuration would perform and found that this configuration was too slow. We increased the RAM to 256 GB, and most importantly, upgraded the graphics card to an NVIDIA GeForce RTX 4090 with 24 GB of memory. After switching to the new hardware configuration, we found that a process that might have taken 10 to 12 hours under the former configuration was reduced to one to two hours using the new hardware configuration.
The software used was ArcGIS Pro, the ArcGIS Pro Image Analyst extension, and ArcGIS Pro deep learning framework library installers.
Pre-Arundo Analysis Tasks
There were a few tasks we needed to complete before beginning the deep learning Arundo analysis. The first was a deep learning model type assessment to see which model types would perform best at identifying Arundo. The model type is essentially the algorithm the software uses to train your model. We tested four model types: U-net, DeepLab, PSPNet, and MMSegmentation within a four-mile square area and ran QC checks to see which model types worked best. Results of the QC tests indicated that U-net and DeepLab worked the best at identifying Arundo. We created a total of seven models for identifying Arundo in the watershed—with most of them using the U-net model type. The second pre-analysis task was to break the large analysis area into smaller, more manageable area of interest (AOI) units. AOIs were built based on location, similar ground conditions, and similar imagery collection dates. AOIs were grouped this way because the Arundo could look different depending on lighting, ground conditions, atmospheric conditions, and the amount of water in the vegetation. The final pre-analysis task was to merge imagery tiles together for each AOI.
Arundo Analysis
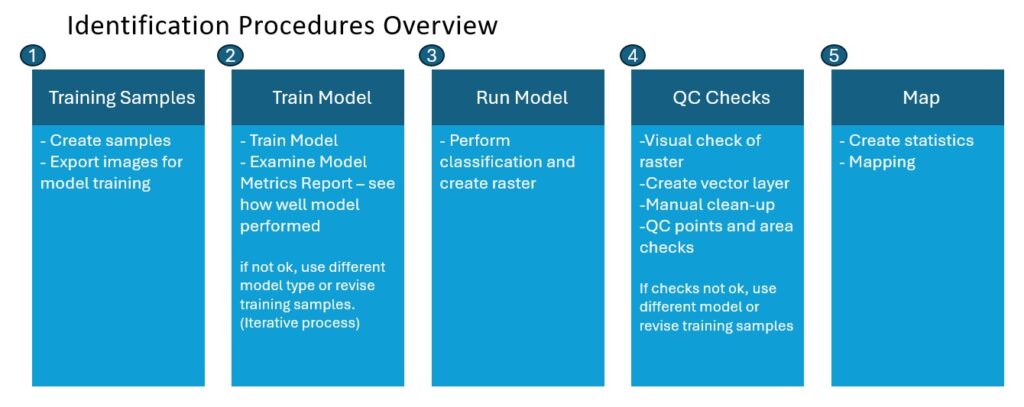
Our steps for identifying Arundo in imagery using deep learning are outlined below:
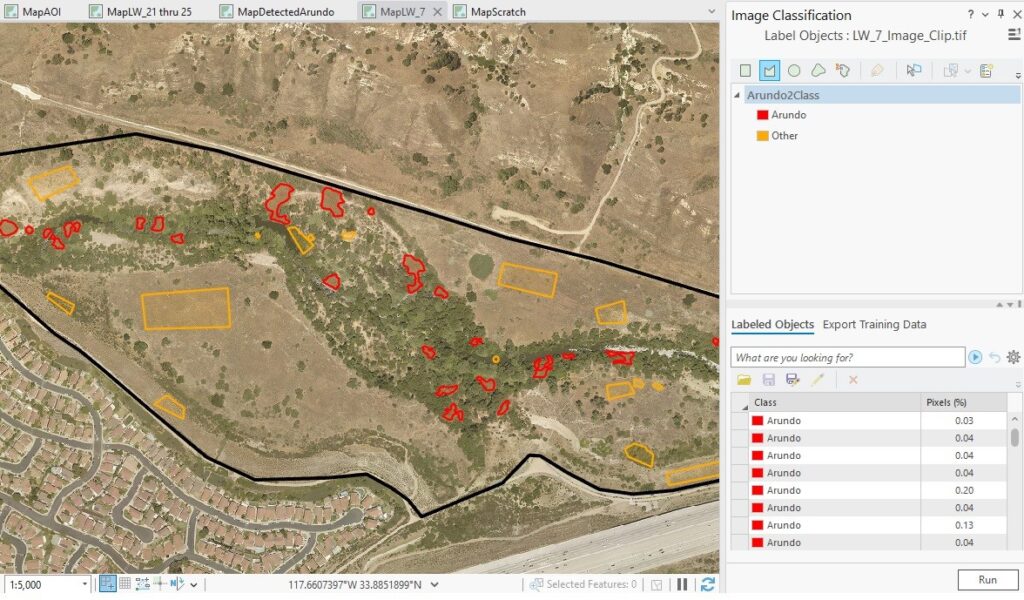
- Training samples—used the “Label Objects for Deep Learning” tool to draw training samples on top of the imagery. It was especially important that we collected different examples of Arundo and that we were very precise when we drew samples. We created a total of seven models for the watershed, with each model having between 100 to 250 training samples. We used the “Export Training Data for Deep Learning” tool to export image chips for model training. We consulted with Orange County Water District and SAWA environmental staff to help us identify plants that were not obviously Arundo, as both agencies have extensive experience with the species.
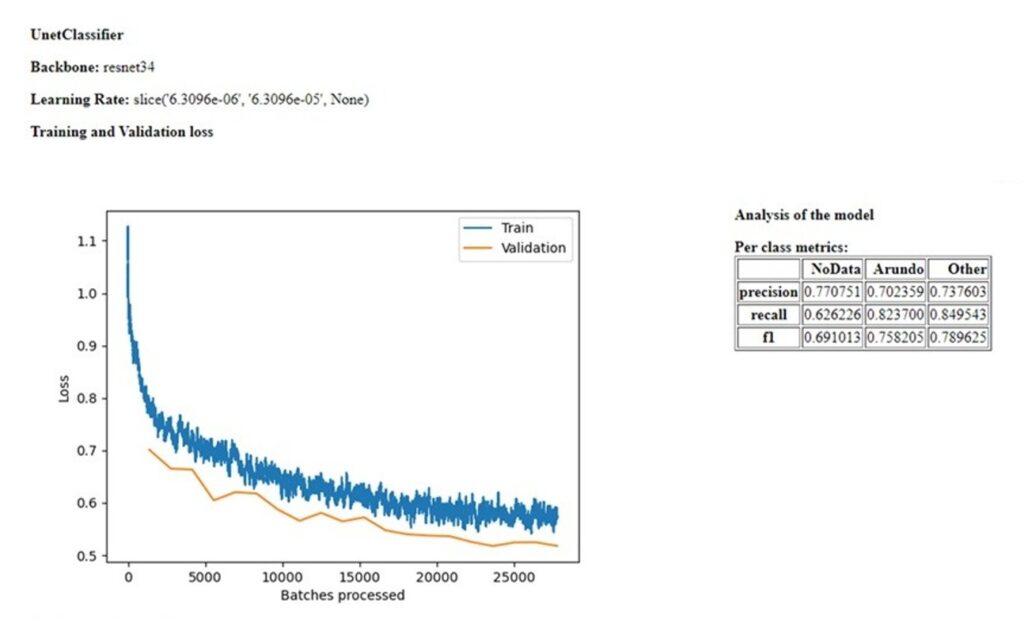
2. Train model—used the “Train Deep Learning Model” tool to train the model. After the model was trained, we examined the model metrics report to see how well it performed. We checked the train and validation curves to make sure they were close, and examined the F1 statistic to evaluate overall model performance. Our target for an acceptable F1 statistic was greater than 0.75. If the F1 statistic was below that score, we would try a different model type or revise the training samples and retrain the model. It often took four or five rounds of trying a different model type and revising the training samples to get the model right and to get as close to the target as possible.
3. Run the model—used the ArcGIS Pro “Classify Pixels Using Deep Learning” tool to run the model on the AOI imagery to produce a classified raster.
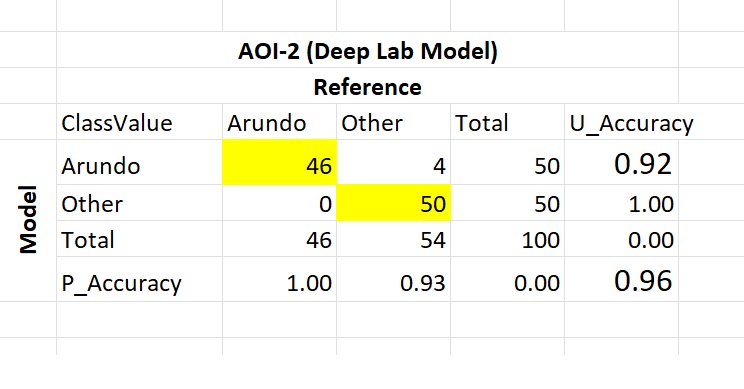
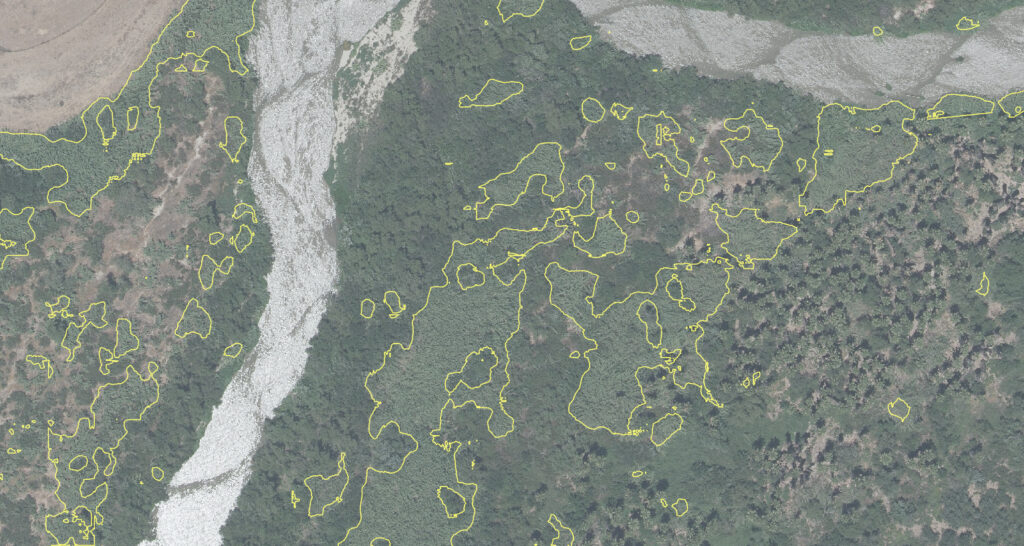
4. QC checks—the first step in the QC process was to convert the classified raster into a polygon layer and do a visual inspection to assess the overall accuracy. We did a manual cleanup on the polygon layer to remove any obviously misclassified areas. After the manual cleanup, we used the “Create Accuracy Assessment Points” tool to generate random locations to check the classification visually against the imagery. We used the “Compute Confusion Matrix” tool to generate accuracy statistics for the classification. Our target accuracy statistics were 80 percent for Arundo prediction and 90 percent for the model (average of both classes). Accuracy was calculated as correct predictions divided by total predictions.
5. Map–created maps of detected Arundo and generated statistics of the amount detected in the watershed.
Results
Project Statistics
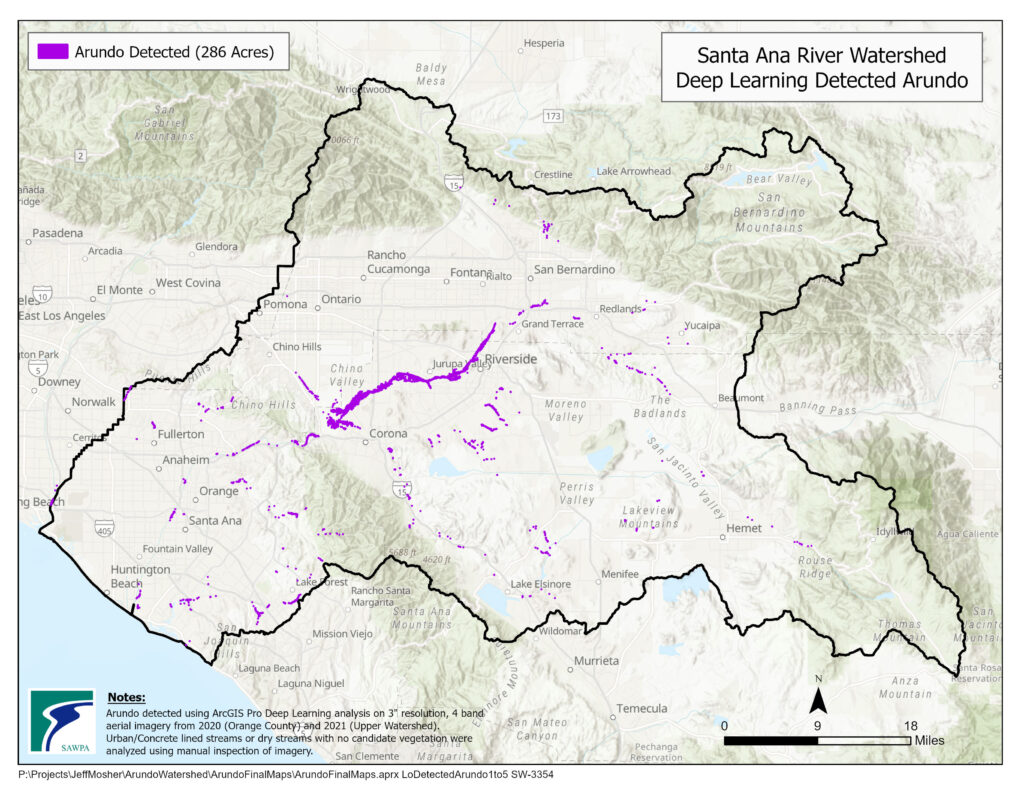
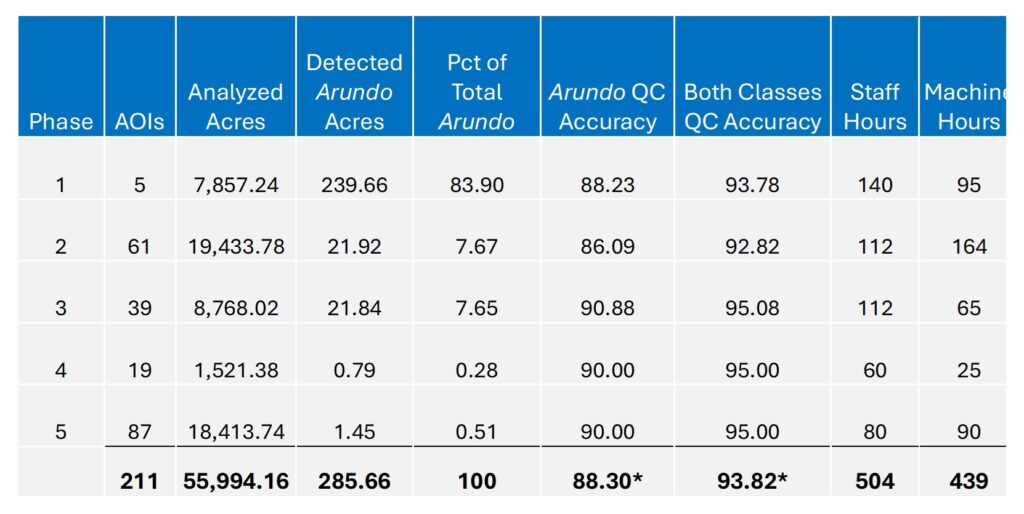
The table below summarizes statistics for each phase of the project. Across the entire watershed, we analyzed more than 56,000 acres and detected just under 286 acres of Arundo. Most of the Arundo (84 percent) was detected in Phase 1 along the Santa Ana River between Prado Dam and La Cadena Avenue in Colton. We also exceeded our accuracy targets, with Arundo prediction at 88 percent and model accuracy (both classes) at just under 94 percent. The project was time-consuming, taking around 500 hours of staff time and more than 400 hours of machine time.
Project Takeaways
Deep learning effectively identified Arundo occurrence, providing a solid estimate of its presence in the watershed. The Arundo predictive accuracy was 88 percent, and the model accuracy was almost 94 percent over the entire watershed area. The amount of Arundo detected was significantly less than the Cal-IPC estimate 15 years ago, indicating that Arundo removal efforts have been effective. We might have underestimated Arundo somewhat in the drier parts of the upper watershed, as field investigations conducted after the analysis found Arundo in some areas where the deep learning analysis didn’t. This could have occurred because different vegetation types were harder to distinguish in drier areas as compared to wetter areas, and some of the imagery in the upper watershed near the mountains was a little blurry.
In terms of the amount of Arundo detected in the watershed, it is also worth noting that many past Arundo removal projects have estimated the amount of Arundo removed as the area cleared of Arundo rather than the actual amount of Arundo plant removed. So sometimes the amount of Arundo in an area could be exaggerated.
Another big takeaway from the project was the importance of having a powerful graphics card for conducting deep learning analysis. When we upgraded from 5 GB to the 24 GB card, the processing speed increased by six to ten times. Processes that previously took 10 to 12 hours could be accomplished in one to two hours with the upgraded card.
While the project was time-consuming—taking more than 500 hours of staff time—there is no way we could have manually digitized Arundo within our 56,000-acre study area. The degree of accuracy would certainly have been less than what was achieved from deep learning computer analysis.

Stay Connected with Esri’s Water Team
ArcGIS is an extensive information system that enables modernization of workflows with easy-to-use applications. Strengthen your organization with geospatial solutions that will increase efficiency and provide insight for decision-makers. Visit the Esri Water web site for more information.
Follow #EsriWater on social media: X | LinkedIn
Subscribe to the Water Industry newsletter “Esri News for Water Utilities and Water Resources“