Authored by: Greg Resz, GIS Manager, GISP, City of Fayetteville
The City of Fayetteville, Arkansas, Water Department went live with an unproven, barely tested, meter reading application created by the GIS Office using Esri’s ArcGIS Experience Builder. Over 1.3 million reads later, we feel like we can call it a success.
Challenges with Outdated Equipment
The City of Fayetteville, Arkansas, has over 50,000 water customers and is in one of the fastest-growing areas in the country. Of those 50,000 water meters, 20,000 are still read by hand monthly. The rest are a mix of cell- and radio-based reading technology. The city is moving to all cell-based meters and endpoints, but budget issues, staffing turnover, and dying radio meters have slowed the replacement of our entire meter infrastructure.
The issue we were facing was that we had a fleet of 15 Trimble Ranger 3 data loggers for those hand reads. These units were hefty at 2.1 lbs. and measured 10.5″ x 5.2″ x 2.5″. These units had long lost their rugged waterproof capabilities. A two-gallon Ziploc bag was issued to each meter reader for those rainy days. The meter staff disliked these units. They were big, heavy, and unwieldy.
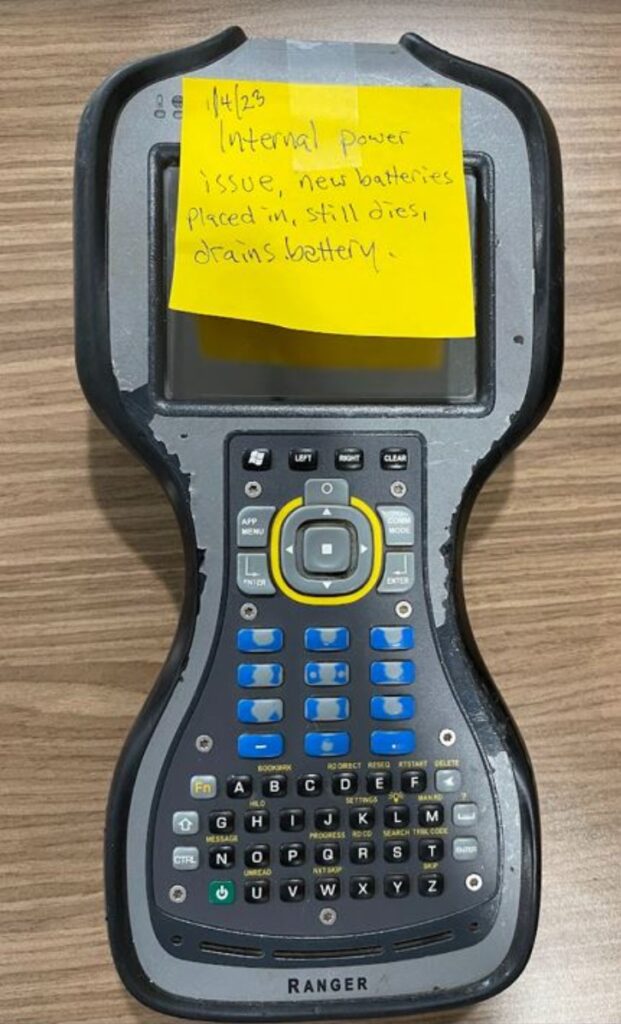
As for maintenance, the units were breaking down constantly, and replacement parts were extremely difficult to find. Our Water Department had been reduced to going from one entity to another, hat in hand, hoping someone might have a spare unit to loan us. We were operating under the constant threat of equipment failure, which highlighted the urgent need for an updated solution.
The Three Pitches
Since the data collectors were dying at an alarming rate, and there were no longer any backups, the Water Department found themselves at a crossroads and were presented with three options to consider:
- Buy new data collectors and updated meter software.- The first option was to replace the existing equipment with new Trimble collectors running the latest meter software. This was the most straightforward path but also the most expensive. Each unit cost between $11,000 and $13,000, and the department needed 15 of them.
- Use a third-party smartphone-based system.- The second option was to move to software that ran on Android phones. The cost was estimated at $23,000 for the first year, with an ongoing annual fee of $16,500 after that. Even so, this option had a major drawback: The City’s IT Department did not support Android devices.
- Collaboration with the GIS Office. – The third option was to collaborate with the GIS Office. We told them that we could help. Using the GIS Office was less about immediate costs and more about long-term investment in skills and technology. This was the GIS Office’s first Experience Builder app. It involved soft costs tied to training and adjustment, but it also created an opportunity to learn new tools and techniques while developing a solution internally.
Our GIS Office has outstanding customer service and has created several products for them that were all great successes. Products such as: an ArcGIS Field Maps software-based work order system that bridged our nonspatial utility billing system and replaced paper in the field; an ArcGIS Survey123 software-based meter change-out system which again connected the Utility Billing Office and the Meter Operations field crews; and our standard utility general reference field maps. It did not come as a surprise when the Water Department placed its trust in the GIS Office, selecting our group as its path forward.
The GIS Office Approach
The solution was not just a singular tool but a comprehensive system, designed with a three-pronged approach to tackle the problem. Here’s what we built:
Custom ArcGIS Pro Tools
The initiative to streamline our meter reading and data management process led to the creation of a custom toolbox within ArcGIS Pro, specifically tailored to our team’s needs. This toolbox comprises four precisely designed tools, simply numbered from 1 to 4 to align with the sequence of its operation. This not only simplifies the workflow but also makes it straightforward for the meter staff to remember and execute the process efficiently.
To keep from overwhelming the Meter Operations supervisors, we simply set the ArcGIS Pro project to the catalog view, opening directly to the toolbox they use daily. By keeping the ArcGIS Pro interface as clean looking as possible, we minimized confusion and streamlined operations.
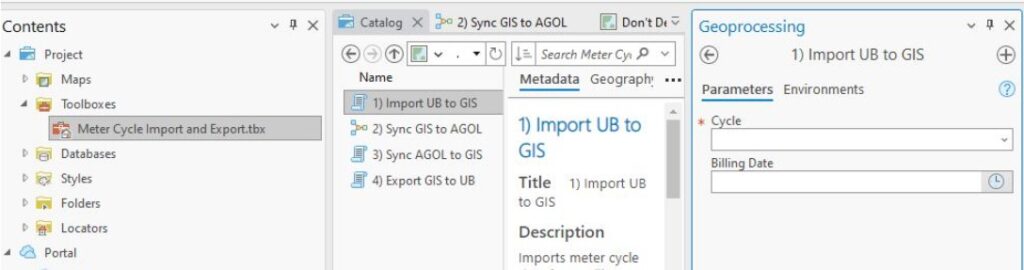
Here’s a breakdown of how each tool functions within our system:
- Step 1: Import UB (Utility Billing Data) to GIS – This initial step bridges our utility billing system with our spatial data infrastructure. It takes the billing data and integrates it into our enterprise geodatabase.
- Step 2: Sync GIS to AGOL – Following the data integration, this tool first clears the existing cycle read data from ArcGIS Online (AGOL) and then appends the freshly integrated data from step 1 into an AGOL table, thus maintaining our data’s integrity and accessibility in the cloud.
- Steps 3 and 4: Sync AGOL to GIS, Export GIS to UB – These steps essentially reverse the initial actions. Step 3 begins the process of preparing the data for export, while step 4 finalizes this by exporting meter reads into a fixed-width CSV file. This file adheres to a schema required by our utility billing software. It is the same CSV file that was created with the former meter read software and was already familiar to our Meter Operations supervisors.
The development and successful implementation of this toolbox was the result of careful collaboration and testing with our IT Department and the Utility Billing Office. Through this joint effort, we’ve not only optimized our workflow but have also set a new standard for accuracy and efficiency in our meter reading processes. This system exemplifies the City of Fayetteville’s commitment to leveraging Esri technology to enhance operational capabilities and service delivery.
Custom Meter Reading Application Built with Experience Builder
But what about the map? This is a question that I get repeatedly from the GIS community. To be honest, that was the first thing that we tried. A simple Esri field map. It had worked so well in many data collection situations before. The main operational goal with the application was the need for speed. When field tested by meter operations and GIS staff, the map conclusively caused a doubling of the time spent reading each meter. We needed a different approach, and in this case, a map was not the best answer.
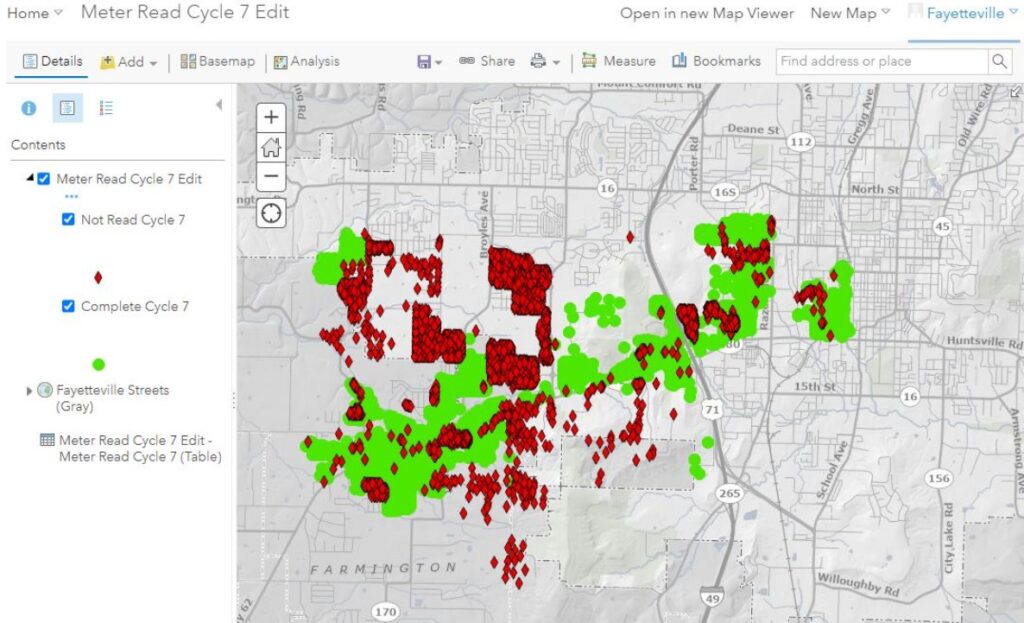
While talking about the problem with our Esri solution engineer, he simply asked me one question: “Have you tried Experience Builder yet?” He already knew the answer was no, but also knew that asking the question would plant the seed and point me in the right direction. I knew I needed to be able to do a table edit without the map, but Experience Builder gave me so much more. Thanks for that!
While continuously improving and adapting, we developed a total of eight versions of the final Experience Builder solution. The initial six iterations of the Experience Builder app were crafted using our own ArcGIS Server portal, allowing us to refine and adjust our approach with each version. It was an iterative process driven by feedback, operational insights, and field testing. For the final production version, we made a strategic shift to build it in ArcGIS Online (AGOL). This move capitalized on AGOL’s robust cloud-based capabilities, ensuring that the app was not only highly functional but also had high availability.
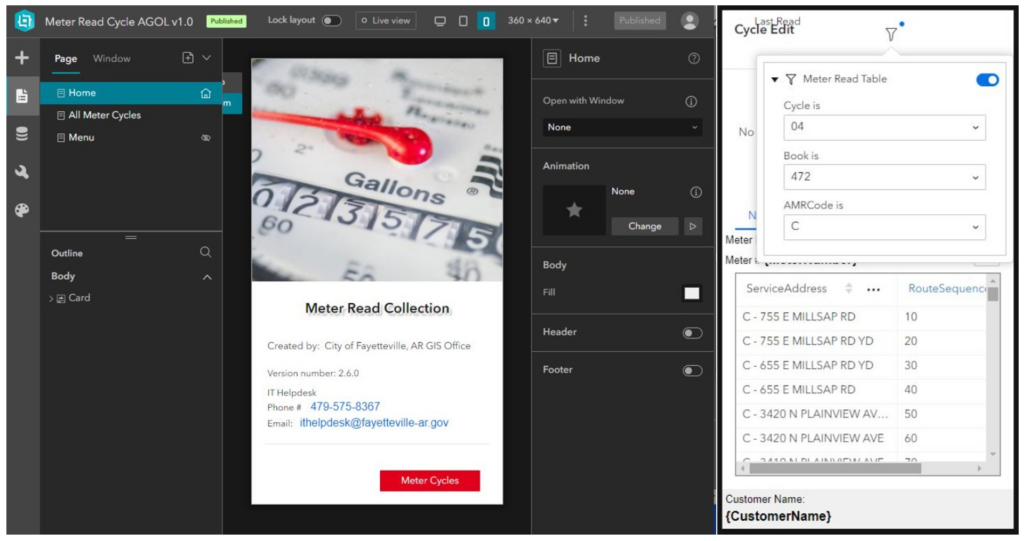
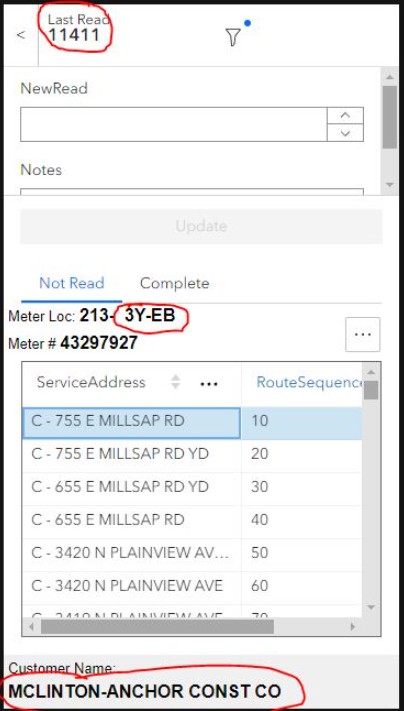
We kept the workflow for the Experience Builder app very clean and easy to use. The reader just taps the filter, picks their billing cycle and sub-cycle, and then selects the meter code for the day. For instance, in our meter nomenclature, a meter with a “C” code means it’s a meter that needs a manual read and then there are the other codes like J for cellular meters, N, and B for radio-based meters. It is worth noting that meter operations supervisors assign a route sequence number to every new meter. Without this, we would not be able to table order the route in the correct reading order. Our GIS Office has also created a custom-made web map to help visualize that data as well when they assign the new sequence numbers.
Once the filter is applied, the user selects the first record, which brings up all the necessary details they need to do the reading. Among this information, the only data they actually need to gather is the new meter reading and any notes on why a meter couldn’t be read. Interestingly, the reasons for not being able to read a meter can range from the presence of a dog or a car blocking access, to the more ambiguous “hmmm”—which just makes me shake my head.
The user then hits the update button, and the record is moved to the “Complete” tab and disappears from the “Not Read” column. This process always keeps the next meter they need to read at the top of the table while also seeing the upcoming reads.
Management and Reporting Dashboard(s)
To add a touch of customization and visual distinction between cycles, each one is themed with colors inspired by NFL teams.
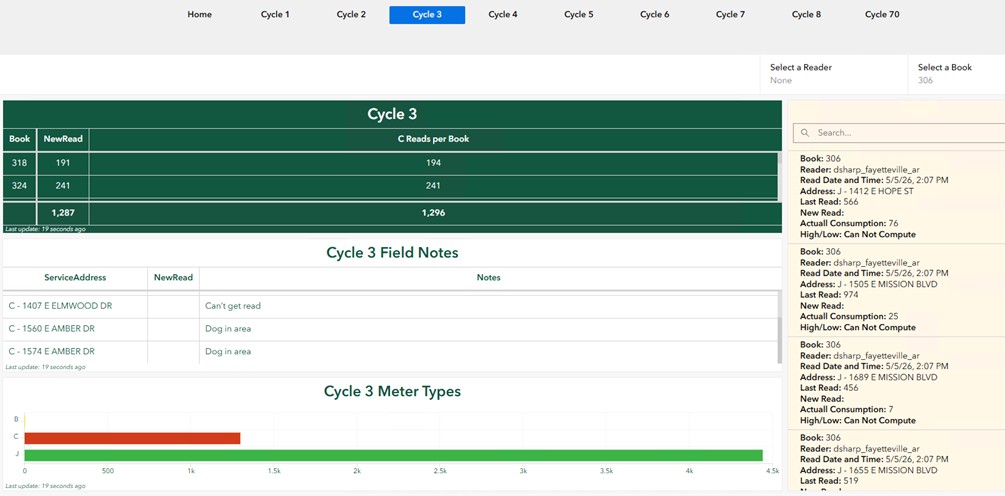
This trio of components form the backbone of our new system, transforming the way we approach meter reading and data management. It’s proof of what can be achieved when we combine innovation with a deep understanding of operational needs.
The Go Live
We had just finished our seventh iteration of the app when a few unfortunate events struck. Two more data collectors stopped working and there were no more backups. Field crews found themselves thrown back in time, collecting meter readings “the old-fashioned way”—on paper.
Then we got the call that did not surprise us at all: “We have to go live now!”
No load testing with multiple devices and crews. No testing in parallel. Yep, we bypassed testing altogether and went straight to production. The app worked flawlessly.
Success!
Under the former data collector system, you could only download one sub-cycle to the data collector at a time. With the new system, every meter technician has every cycle and sub-cycle on their smartphone. Meter Operations can move technicians on the fly in the field without having to drive back to the office to download a different cycle. They can have more than one technician working on the same sub-cycle. With the new system, there is no uploading from the data collector or losing hundreds of reads because a collector died. It is in AGOL as soon as the technician hits submit.
In the years since the GIS meter read program was launched, we’ve successfully read over 1.3 million meters. This effort has directly contributed to generating revenue in excess of 75 million dollars.
Our success with the GIS program is measured by more than the significant $150,000 in savings it delivered for the Water Department. Just as important is the trust the Water and Sewer Department placed in the GIS Office and the confidence it showed in our ability to help modernize its operations. This partnership reflects a progressive approach to utility management, using Esri’s GIS technology. Esri helped us improve efficiency, increase accuracy, and strengthen overall service delivery.
“With the development of the meter reading app, we have gone from expensive and bulky handheld reading devices, to being able to read our routes on just a lightweight cellular phone; also, by keeping everything ‘in-house’, repairs are turned around quickly and much cheaper, usually just the cost of replacing a phone.” — Doug Sharp, Meter Operations Assistant Supervisor

ArcGIS is an enterprise geospatial platform that enables modernization of workflows with easy-to-use applications for the field and office. Strengthen your organization with geospatial solutions that will increase efficiency and provide insight for decision-makers. Visit the Esri Water Utilities web site for more information.
Stay Connected with Esri’s Water Team
Join the Water Utilities Community
Follow #EsriWater on social media: X | LinkedIn
Subscribe to the Water Industry newsletter “Esri News for Water Utilities and Water Resources“