Authored By: Jeff Weaver, George Nikokiris, and Kelly Garcia – Abonmarche
America’s infrastructure is aging and, for most communities, in a state of critical condition. The water systems built at the turn of the 20th century, especially in the Midwest, are due for a serious upgrade, but the means and costs to have these done are leaving community leaders and residents on edge. To answer the community leaders’ needs, politicians came together in 2021 to address ongoing issues and established the Infrastructure Investment and Jobs Act (IIJA).
The US Environmental Protection Agency’s Lead and Copper Rule Improvements (LCRI) program was created to specifically help public water systems verify all unknown service lines by 2027 and to replace lead services by 2037. The IIJA provided funding to support meeting these requirements. Since the program began, federal and state agencies across the United States have partnered with engineering firms to address America’s aging infrastructure, particularly in the water systems sector.
The LCRI Program: 2025-2027
With the initial inventory submission completed in 2024, the validation phase is now underway. For locations where service line material was unknown, predictive modeling was an accepted method for completing the inventory. These models used historical, demographic, and geographic information to predict whether unknown service lines were lead or non-lead. Now, state agencies require validation of those predictions through random sampling, physically verifying a percentage of predicted locations to test the accuracy of the model. Potholing has emerged as the preferred method for assisting in the validation phase.
Auburn
Auburn, a city in the Northeast corner of Indiana, is taking the next step in meeting the LCRI requirements. In the years leading up to the inventory submission deadline of 2024, Auburn maximized Esri’s Lead Service Line Inventory solution with activities that included self-assessment surveys on the city’s hub site, tracking and recording data collected via home visits, and general updates to the existing lead service line (LSL) inventory.
Seeing the benefit of geographic information system (GIS) solutions, Auburn devoted 2025 to performing hydroexcavation (potholing) to validate service line materials in the field. The city partnered with Abonmarche to develop a comprehensive GIS-based construction management solution using the ArcGIS Online platform to track 341 potholes, from site selection through final restoration.
The GIS tracked work tickets (which had been created by calls to 811), scheduled digs, restoration, and updates to the live LSL data. Project managers, vacuum truck operators, and field technicians worked in unison—thanks to a host of GIS applications, including live dashboards, ArcGIS Field Maps, and the city’s hub site—to complete this effort.
ArcGIS Hub Provides Transparency
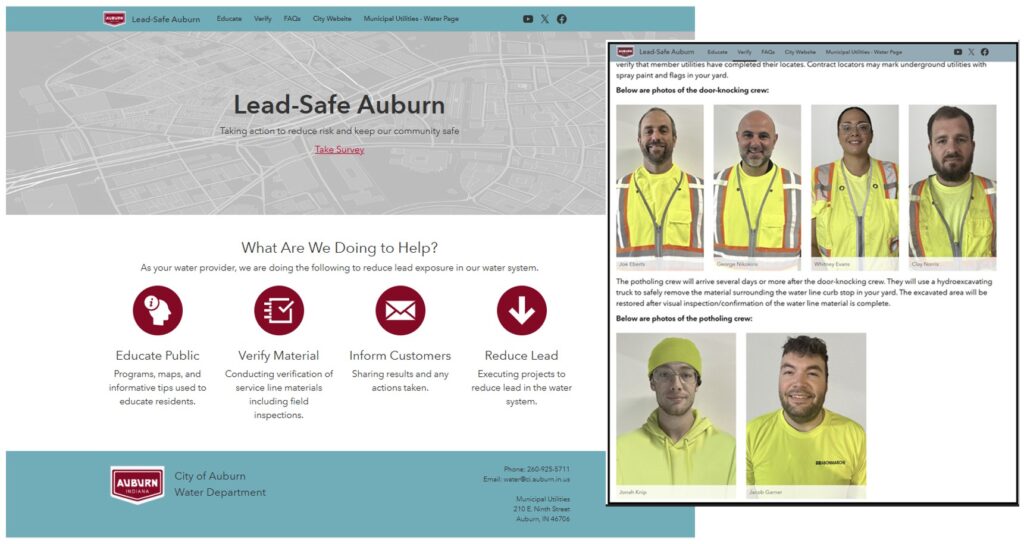
To keep the residents of Auburn informed, a dedicated website was built using ArcGIS Hub, serving as the central repository for the city’s Lead-Safe Auburn program. The site hosts GIS applications and maps used throughout the potholing process and provides transparency into the project.
Along with project transparency, the hub site provides educational resources about lead service lines, answers to FAQs, and a survey that allows residents to submit information about their own service line materials.
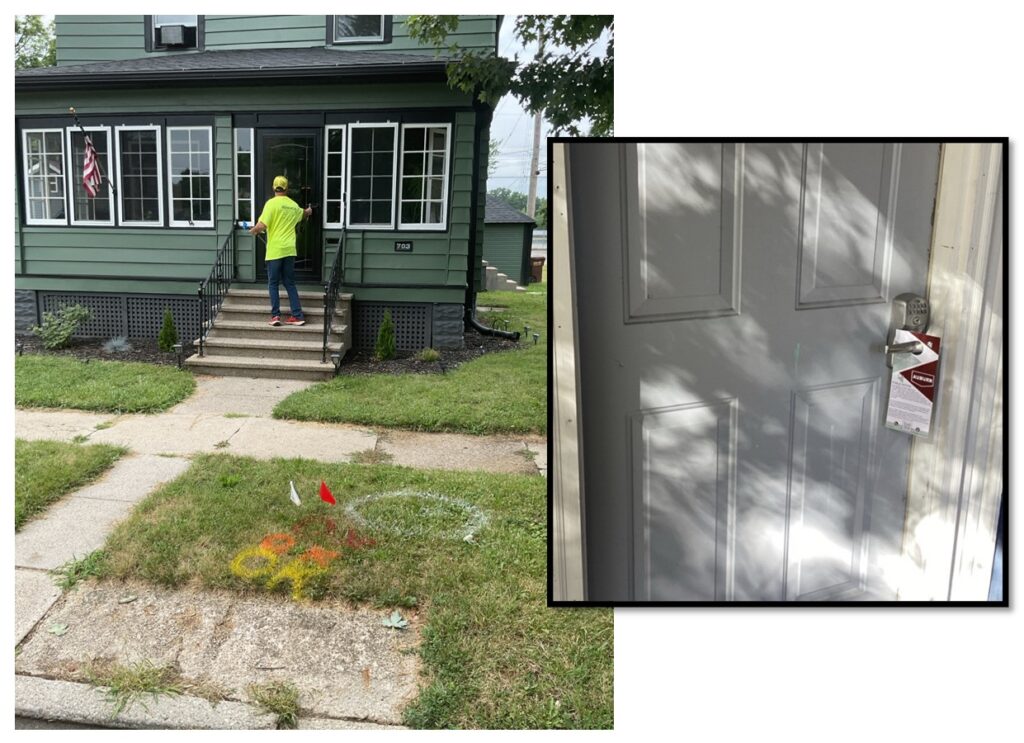
A door hanger, describing the work to be done on each property, includes QR codes that direct residents to the hub site. There, residents can find photos and contact information for third-party vendors performing the field data verification and vacuum truck excavation.
Random Sampling for Validation
Auburn’s initial inventory identified the material of approximately 2,000 service lines based on predictive modeling. Indiana Department of Environmental Management required validation of 20 percent of these predictions, resulting in 341 locations selected for field verification. Using ArcGIS Pro, the Abonmarche GIS team randomly selected these sites to test the accuracy of the predictive model.
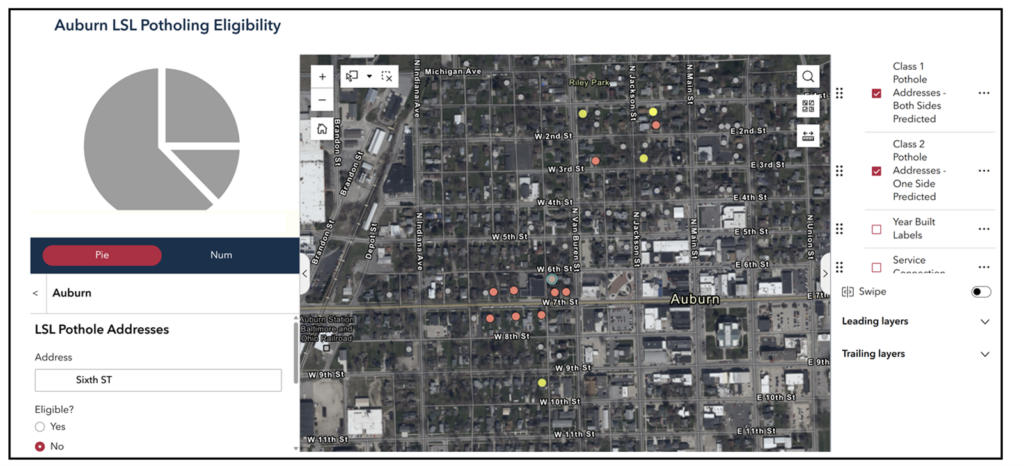
Field Verification
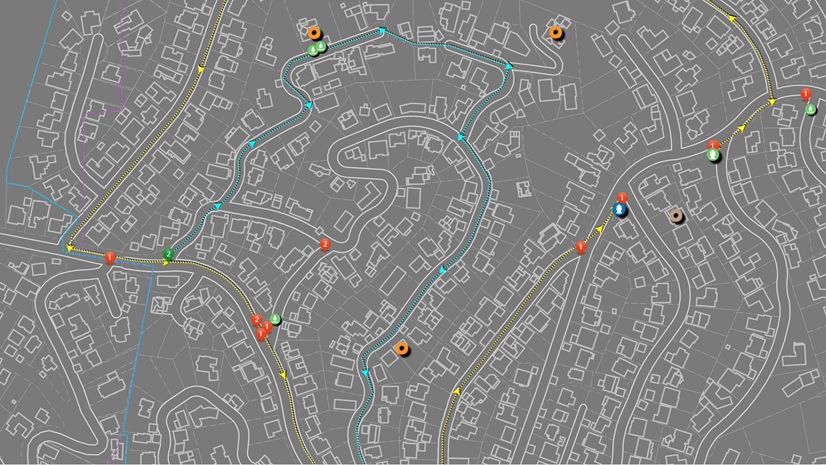
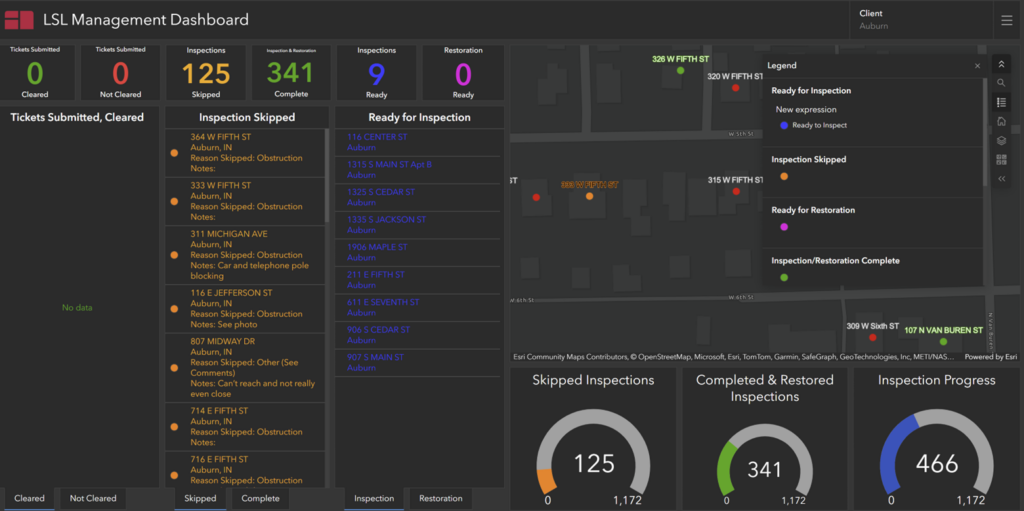
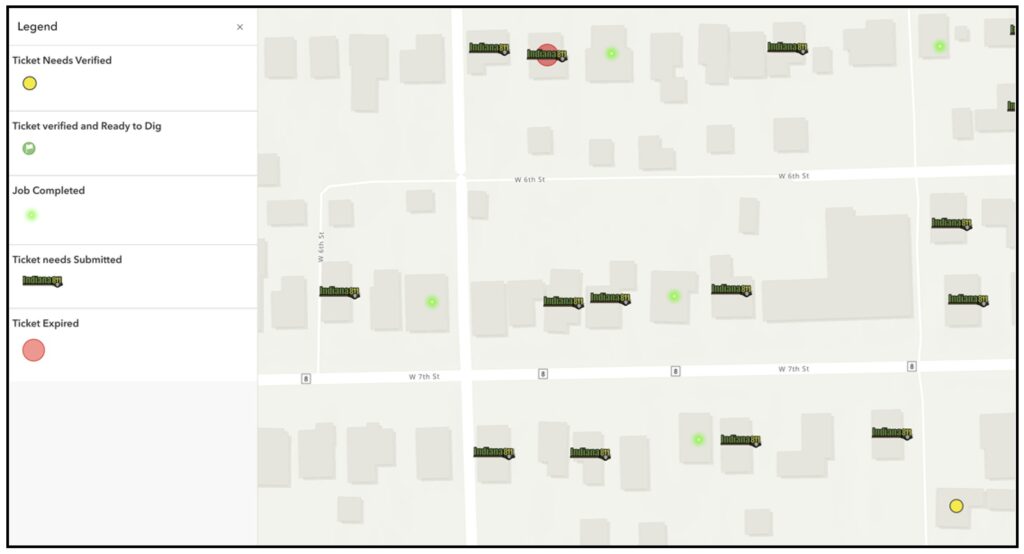
With validation sites identified, the team configured a series of applications in ArcGIS Online to manage the potholing process. Field Maps and live dashboards tracked each location’s status, with symbology updating automatically as crews completed each phase.
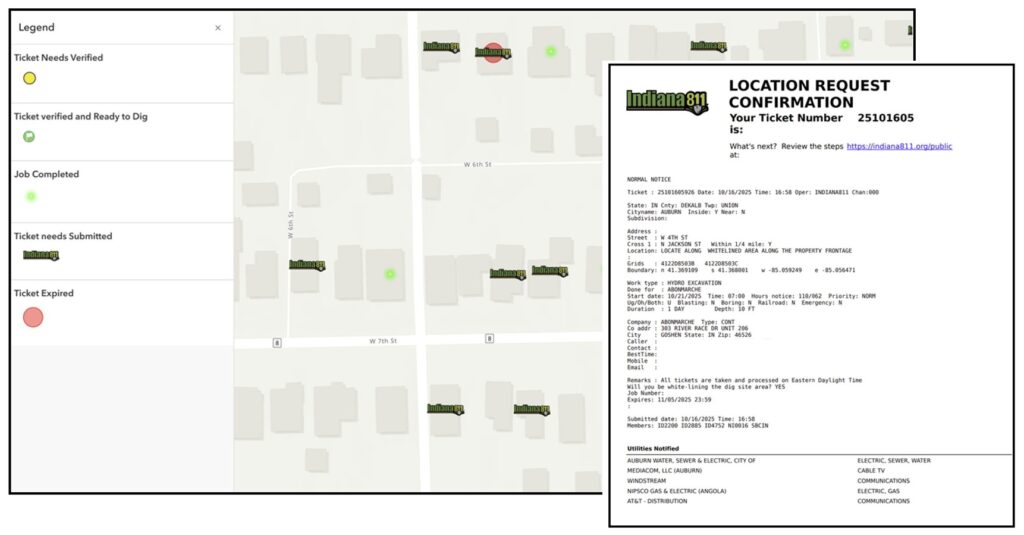
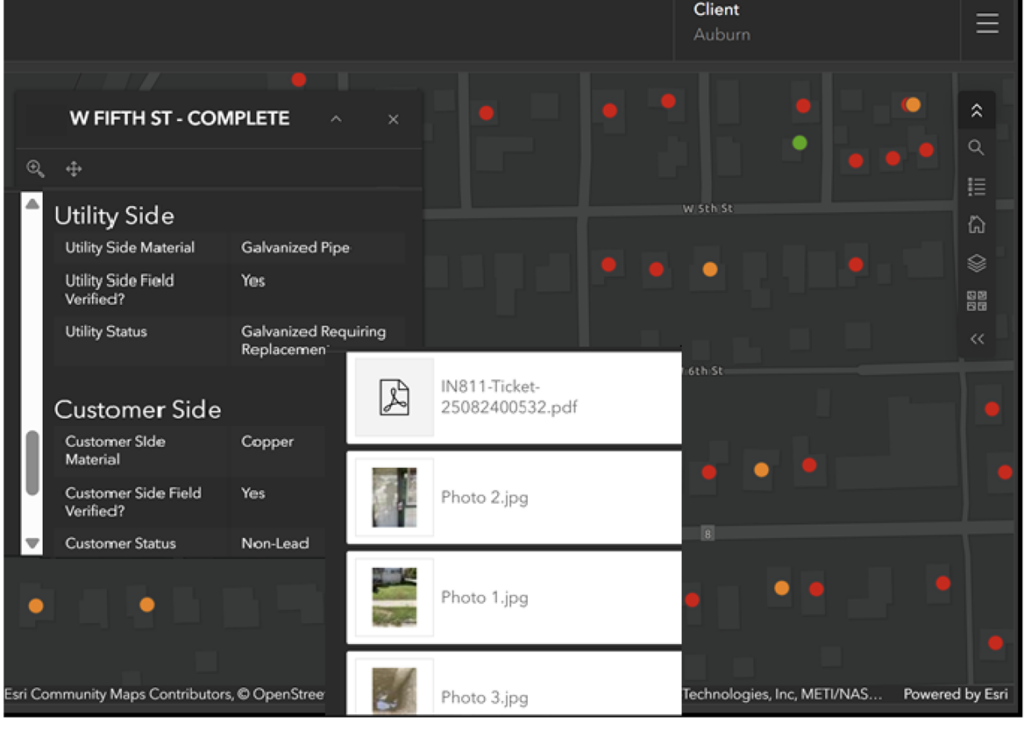
Excavation requires calling 811 before any digging can occur. Upon submission of an 811 ticket, utilities have a two-to-four-day window to mark and flag the property, and the ticket is valid for 20–21 days. For this project, attachments were enabled on the feature layer so that the tickets, field photos, and documentation could be stored directly on each inventory point feature.
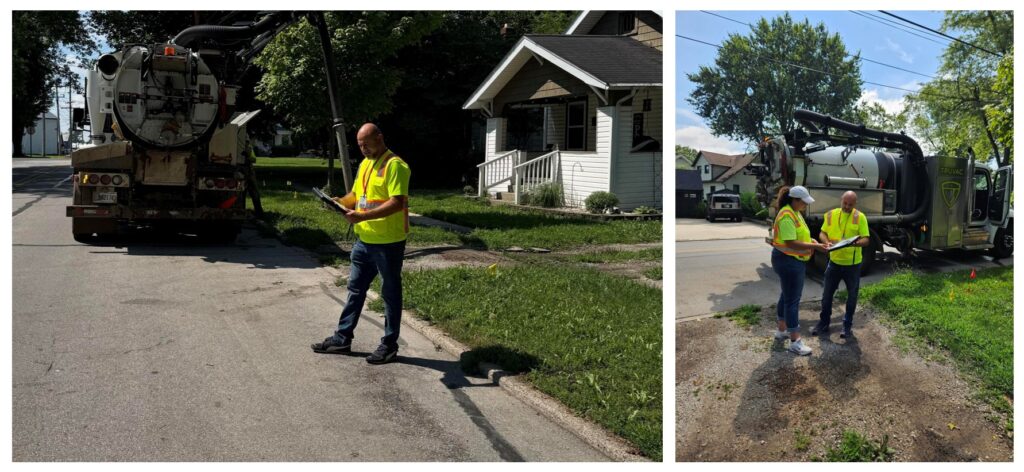
Abonmarche field crews then followed suit, verifying the completed markings and updating the inventory points using Field Maps. Crews would then deliver the door hanger to each property owner and attach a photo record to the GIS point to facilitate continuous tracking of the workflow process and signify to the vacuum truck operators that the property was clear for digging.
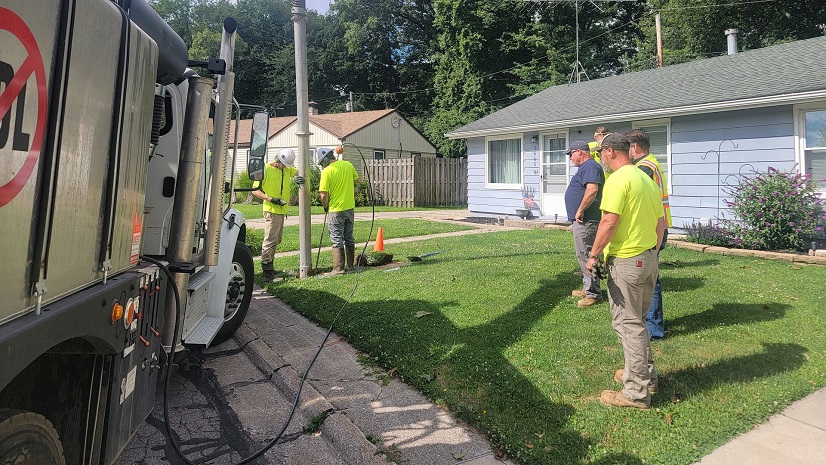
Preparing the Vacuum Truck for Potholing
Project managers arrive on the day of potholing activities to perform QC on the work and data alongside vacuum truck operators using ArcGIS Field Maps. Vacuum truck operators then use their own mobile devices to access the field map. The Ready to Dig symbology is the vacuum truck’s cue to begin the work and design its route for that day.
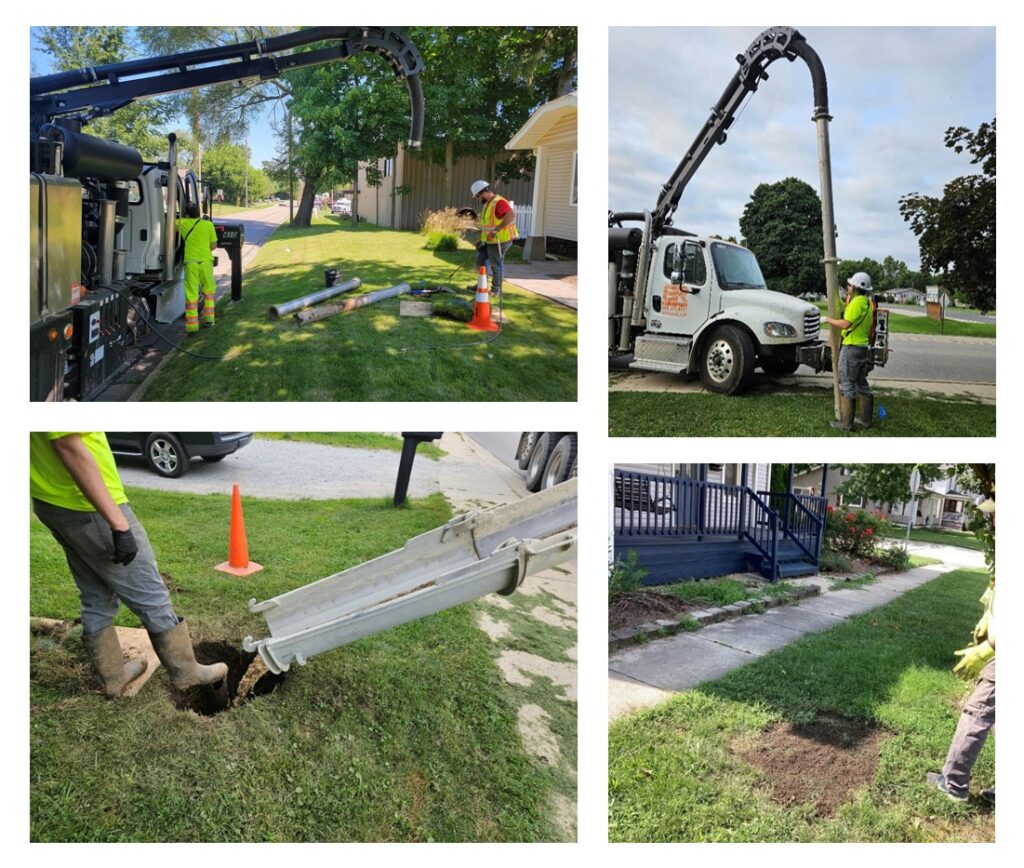
Thanks to the live-streaming components of Field Maps, vacuum truck operators can use the ready-to-dig notification to efficiently route their operations for the day. Crews perform the dig, clear a 12-inch radius around the stop curb, test each pipe with a magnet, and capture a photo to complete the process.
The Field Maps application was used to store pictures of the pipes, update the service line material types for both the public and private sides of the curb stop or water meter, and queue the restoration process that follows.
The Restoration Process on the Road to Completion
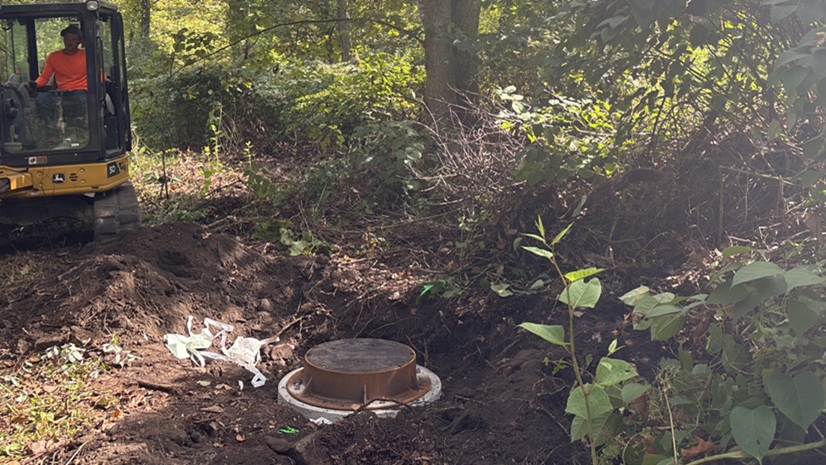
After initial potholing activities, staff then coordinate for a backfill truck to visit each dig site and fill the hole with a soil mixture suited to the city’s terrain. Symbols for locations that are ready for restoration take on a new color within the GIS applications.
The freshly filled holes are then topped off with topsoil and grass seed.
A picture is taken of the fully restored hole and is updated to the GIS data points with Field Maps. At the project’s close, an additional GIS application was designed to revisit all 341 potholes and ensure that the sites had been fully restored.
Next Phases: Predictive Prioritization
The potholing operations provided verified ground truth data that transformed previously unknown service lines into confirmed known ones. This expanded dataset became the foundation for a machine learning model designed to predict the material status of the remaining unknowns. By feeding the validated results into the model, the system could identify patterns and generate predictions for service lines that had not yet been physically inspected.
Service lines were categorized as known lead, known non-lead, predicted lead, or predicted non-lead. The known categories included both historical records and field-validated results, while the predicted categories reflected the model’s assessment of remaining unknowns based on learned patterns from the confirmed data.
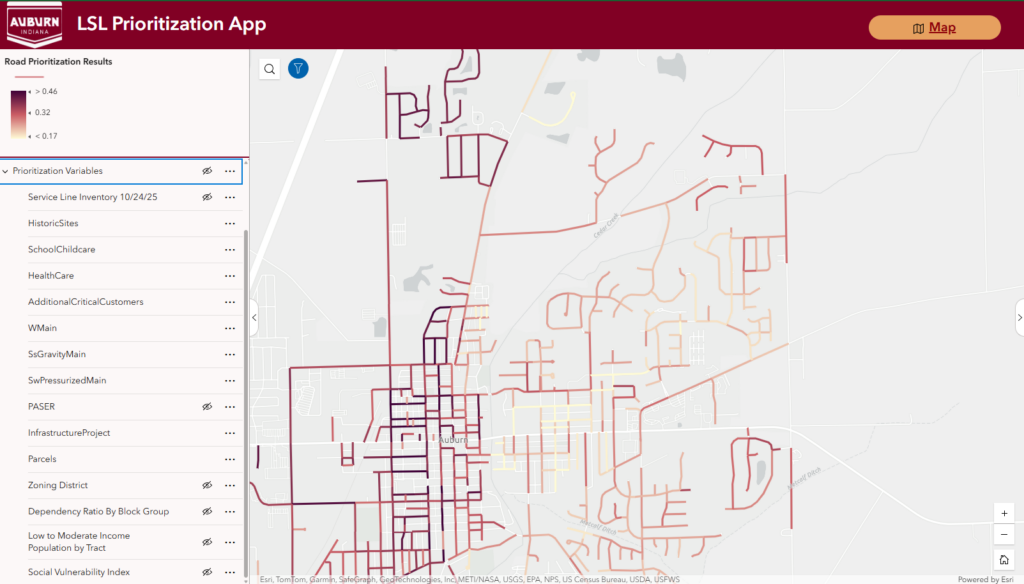
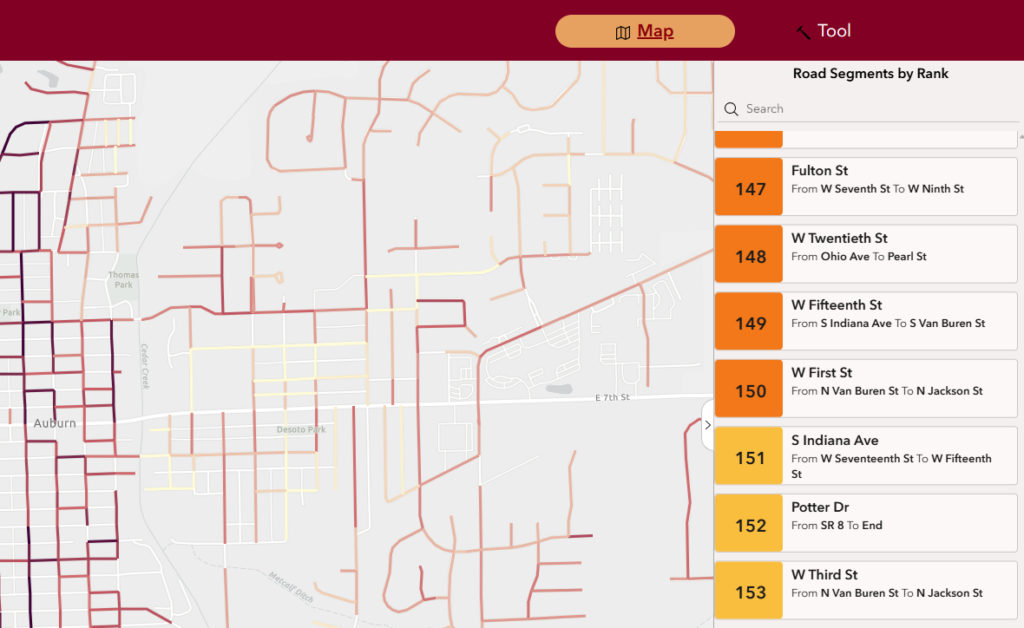
With predictions in place, the next step was prioritization. Service line status alone does not determine where replacement efforts should begin. The predicted data and known data were integrated with supporting infrastructure information such as utility networks and street conditions, as well as demographic factors including neighborhood statistics and census block data. This combination of layers allowed for the creation of a prioritization score that identified areas where lead risk, replacement efficiency, and community impact aligned. The result was a data-driven tool that helps the city focus on resources where they will have the greatest effect.
The LCRI Inventory
Public water system staff must continuously update the service line inventory to reflect any changes to service line materials, including connector materials. The deadline to verify all service lines is November 1, 2027, for LCRI requirements. The City of Auburn is well-positioned to do more due to its pothole program being completed by using the ArcGIS platform. Ultimately, the data can now be consumed in collaborative efforts and programs such as capital planning, enabling the city to make better decisions based on the data.
How Your Community Can Prepare
ArcGIS Online has been key to updating and maintaining public water systems.
GIS data and Esri’s Lead Service Line Inventory solution were configured to support additional functionality and reporting capabilities. This includes web maps and dashboards to streamline inspections, construction management, resident engagement, and administration.
Additionally, Abonmarche works with public water systems that do not have GIS, using available grant funding from the Indiana Finance Authority to get GIS-based solutions in place to support service line inventory and replacement.
If your community still needs to inventory and replace lead service lines to comply with the LCRI requirements, keep the following steps in mind:
- Identify your existing LSL data. If you do not have a service line inventory, begin by gathering historical system records and information to develop an initial inventory. If you do have one, cross-check your current inventory against the new requirements and update as needed. Take advantage of ongoing opportunities—such as when replacing meters or performing main repairs and replacements—to collect data in the field.
- Identify supporting data for your LSL inventory. You can use supporting data, such as water main age, building age, and meter information, to build your LSL inventory. If you have this data available, ensure that it is up-to-date and as accurate as possible.
- Initiate discussions to accomplish full LSL replacement. For many systems, achieving full LSL replacement can be a challenge. Explore and identify replacement programs and funding options, including assistance programs for customers who are unable to pay for their portion of the service line replacement. Discuss factors to prioritize replacements, such as targeting areas with vulnerable populations or disadvantaged customers.
- Prepare for rapid notification. Understand the various engagement time frames and delivery methods. Begin developing the required notification materials and coordinate with the appropriate departments and adjacent organizations.
About the Authors
Jeff Weaver is an information systems professional with extensive experience in planning, developing, implementing, and managing digital projects. Since joining Abonmarche in 2021 as the director of digital solutions, Weaver has rolled out innovative solutions to streamline operations and improve business processes. Weaver holds a degree from Indiana University and is committed to innovation and leveraging technology to drive business success.
George Nikokiris has been a GIS specialist and project manager at Abonmarche since 2022. With a solid GIS foundation, Nikokiris has consistently delivered customized solutions that address diverse spatial and data-driven challenges. Nikokiris holds a degree from DePaul University and is focused on delivering impactful results through strategic planning and expert application of GIS technologies.
Kelly Garcia is a GIS technician at Abonmarche, where she supports city utility projects through the creation of maps and GIS applications and assists with the management and organization of utility data. Garcia holds a bachelor’s degree with a background in sociology and creative writing, which strengthens her ability to support GIS mapping and applications with a user-focused perspective.