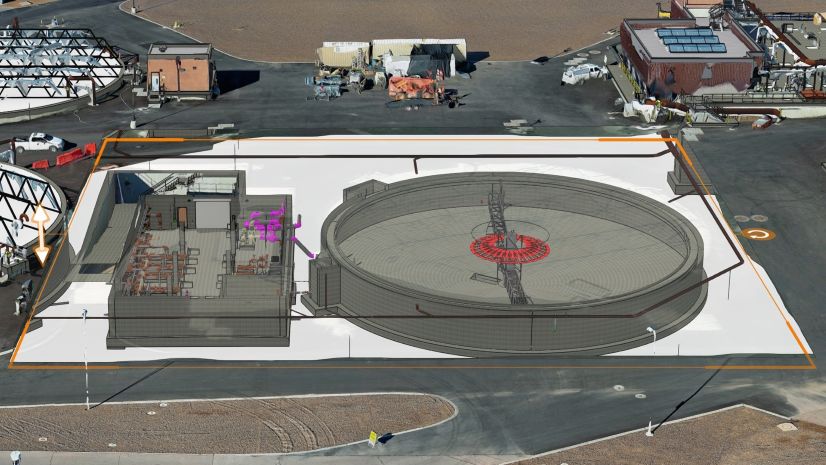
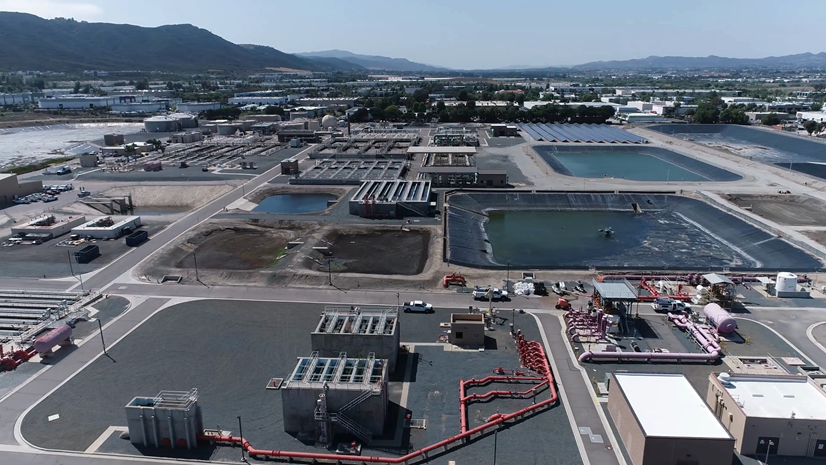
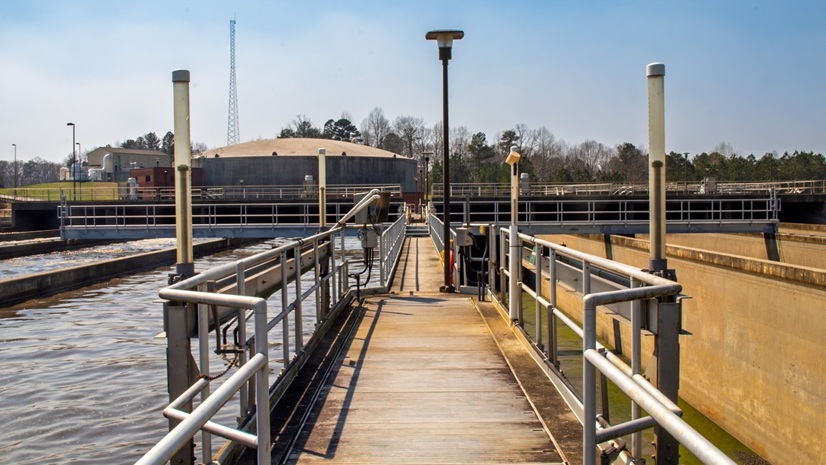
Situated at 7,000 feet in Northern Arizona, Flagstaff Water Services manages potable water, wastewater, reclaimed water, and stormwater within the City of Flagstaff local government. Flagstaff Water Services has one water treatment facility that treats surface and ground water, and two water reclamation facilities. Flagstaff Water Services serves 75,000 people with 23,000 water services, 450 miles of water mains, and 300 miles of gravity sewer.
Leveraging GIS and Mobile Applications for Operational Excellence
Over the last eight years, Flagstaff Water Services’ Digital Assets Program has transformed analog/paper processes by implementing technology such as GIS, CMMS, and smart field devices. The Digital Assets Program consists of three employees: a SCADA/IS section manager, a Digital Assets Program manager, and a GIS specialist. Together, this small team creates maps, apps, surveys, and dashboards to collect, manage, and display information regarding the various sections within Flagstaff Water Services.
During the digital transformation, water distribution crews gained knowledge and confidence to collect geometry and update attribute information for assets in the field. Additionally, the wastewater and stormwater collection crews learned to use GIS and CMMS to track work, inspections, and service requests. Since ditching paper map books, the operators use Esri’s ArcGIS Field Maps mobile application to quickly retrieve relevant asset information such as material, year built, size, and associated as-built PDFs. Instead of finding the right page in the map book, operators can simply type in an address and see all the surrounding utilities in their work area. They can also select the asset and see the hyperlink to the as-built PDF in the attribute table. This functionality has saved field operators hundreds of hours of trying to find the correct plan sets. Field Maps eliminated the need to drive across town to hunt down the correct physical as-built plans.
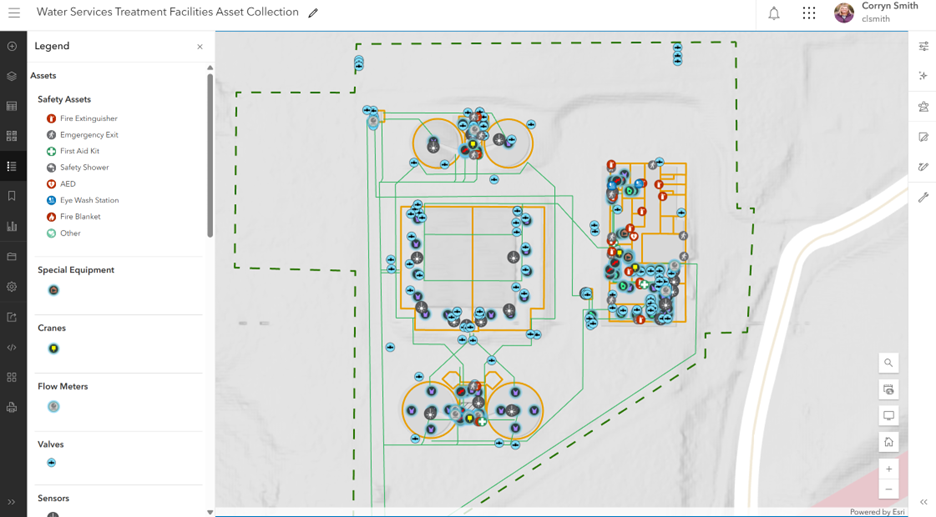
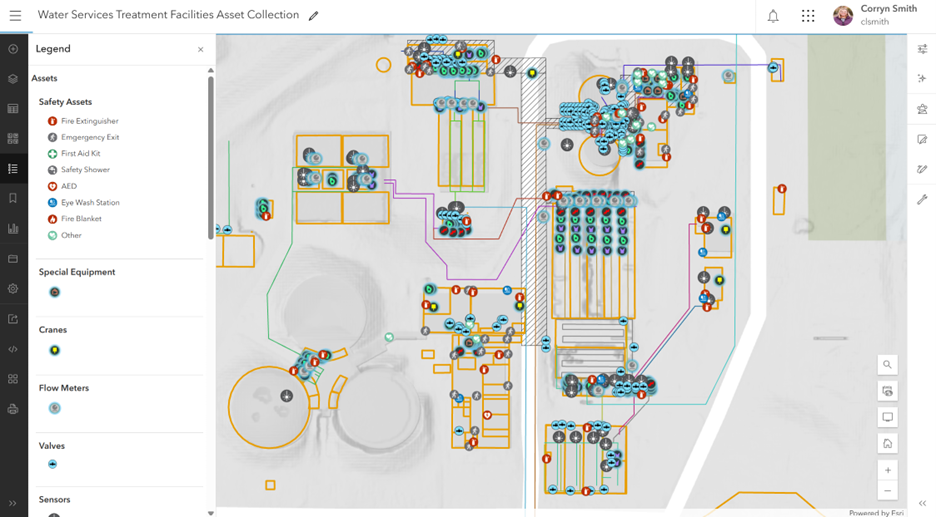
Since having success with the field crews, the team behind the Digital Assets Program decided to take their efforts indoors—into the treatment facilities! They started with the smallest plant: Rio de Flag Water Reclamation Facility. The water reclamation team did not have an asset inventory nor a formalized preventive maintenance program. Most tasks and projects were reactive, and descriptions of completed work lived in emails, reports, and spreadsheets. The Digital Asset Program team quickly saw how the water reclamation team would greatly benefit from GIS and CMMS. The two systems would serve as a digital inventory of the treatment facility’s assets and an all-in-one digital repository for completed work.
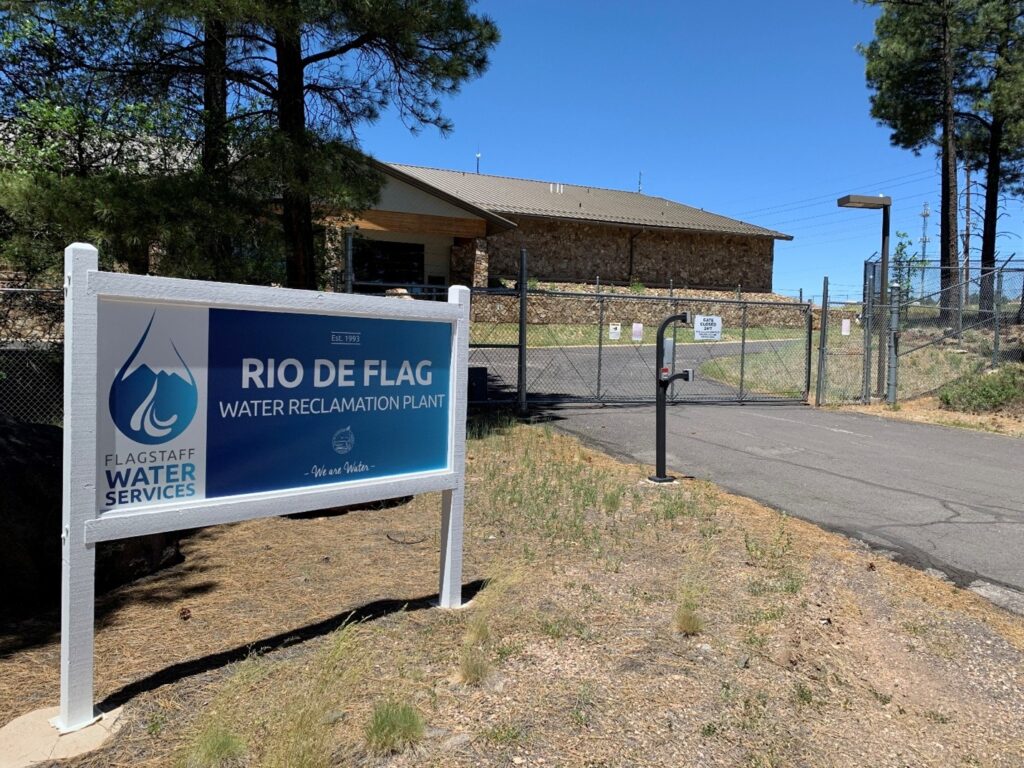
Building Operator Ownership: Transforming Asset Management at Rio de Flag Water Reclamation Facility
The digital asset team had a blank canvas for the Rio de Flag Water Reclamation Facility. They took the facility and drew the floor plan in GIS. They divided the facility into different polygons that indicated different process areas or “sites” within the facility. The sites polygon layer acted as a vector basemap to get the operators comfortable using GIS.
The digital assets and water reclamation teams had several meetings to discuss the vision both teams have for inventorying the assets in GIS. The water reclamation team shared various types of information that they had in spreadsheets, such as asset manufacturer, serial number, make, and model. The digital assets team transformed their spreadsheet into fields within the attribute tables. The plan was to start small so operators wouldn’t become overwhelmed with the new tasks on hand. The digital assets team introduced a map with the “valves” point layer as the first asset on the list. By starting with one layer, operators could approach the data collection slowly and not be overstimulated by all the potential requests. Operators were skeptical at first and didn’t have the motivation for GIS data collection. However, each operator was given their own data-enabled tablet with the Field Maps application installed. By giving everyone their own device, operators began to feel ownership of their data. Operators were provided with hands-on training with the digital assets team, including how to add a point on the map. Since this data collection is indoors, the operators relied on the treatment facility’s sites polygon to ensure placement accuracy. Operators collected attribute information such as description, type, size, common name, photos, and an option to add network paths to access additional photo libraries, O&M manuals, and as-built plans. Biweekly check-ins were scheduled to give the operators time and space to ask questions on how to use the Field Maps app and provide feedback to the digital assets team such as updating attribute fields, domains, and map symbology.
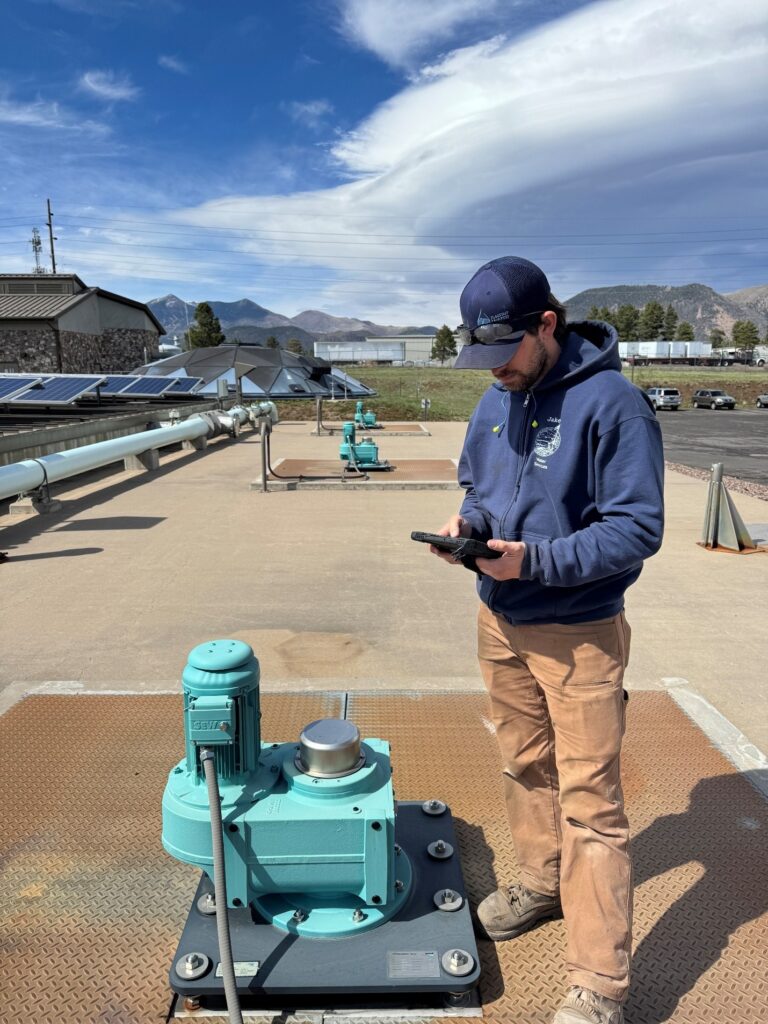
Continuing GIS and Asset Management Efforts at Rio de Flag and Wildcat Hill Water Reclamation Facilities
After a year of data collection and training at Rio de Flag Water Reclamation Facility (WRF), the digital asset team introduced the project to the Wildcat Hill WRF. Plant operators switch between facilities, so both locations had operators who were comfortable collecting the GIS data. The digital assets team also created a friendly competition between the two water reclamation facilities—whichever plant collected all their valves in GIS first would be treated to lunch. The Rio de Flag vs. Wildcat Hill lunch incentive was the final push needed to complete the valve layer. By providing technology and training (and some food for motivation), operators developed ownership of their data, which improved overall data quality and integrity.
Once valves were collected, operators at both facilities were tasked with collecting sensors, pumps, motors, drives, meters, cranes, safety equipment, and special equipment in GIS. Staff quickly saw the advantage of collecting the assets in GIS.
“Our senior operators are retiring and taking their institutional knowledge with them. Staff are seeing the disadvantages this causes, so Operators are more inclined to add as much information as possible into GIS.” —Cory Mueller, Water Reclamation Supervisor
Staff saw the benefit of displaying fire extinguishers, eye wash stations, safety showers, and emergency exits on the Field Maps app, and how easy it is to add these assets for routine inspections within CMMS.
“Once we saw all the fire extinguishers on a map, we realized that we could digitize our monthly safety inspections and hold staff accountable.” —Cory Mueller, Water Reclamation Supervisor
Although the process was not complicated, the data collection training consumed approximately four to eight hours a month for the first two years. When this project initially kicked off, Flagstaff Water Services saw a high turnover in the Water Reclamation Section, which meant training new operators once hired on. They also experienced challenges with the pandemic, which put this project on pause for almost two years. Once both facilities had steady staff, the Rio de Flag WRF completed their treatment facility asset inventory, approximately six years after the initial training. Wildcat Hill WRF has approximately 70 percent of their assets collected. Wildcat Hill WRF is an older and more intricate facility. The facility has multiple levels, abandoned/repurposed infrastructure, and new additions that were not recorded on as-builts nor plan sets. Though these sound like hurdles, this is a prime example of the importance of collecting assets in GIS. Operators can display the site polygons based off different levels, which are symbolized with different textures, colors, and outline patterns. Operators also printed out arrows to indicate which asset they were collecting in asset-dense areas such as the digester gallery. As the facility is preparing for new projects and infrastructure, having a digital record of the assets in GIS has been useful to send to engineers and contractors.
“We recently discovered several lines that connect to the main influent line when we had a contractor excavating on-site for a capital improvement project. These lines were not documented anywhere, so adding them in GIS will be beneficial for future employees.” —Troy Dagenhart, Water Reclamation Manager

Leveraging In-House GIS for Treatment Facility Management
Budgets can be tight in the local government and utility realm, which was one reason the City of Flagstaff decided to do this process in-house. At the time, ArcGIS Indoors was still in its infancy, and the team could easily justify starting a project with technology they currently had at their fingertips. Floor designations were indicated in the attribute table and symbolized on the map with different hash-marks, fill, or border. Operators were asked to take photos of each asset. Some operators took the initiative to add signs that contained the valve’s common name or an arrow in the photos to indicate which asset was in question, especially in areas where assets are vertically on top of one another. The objective is to be able to move to ArcGIS Indoors when the funding becomes available.
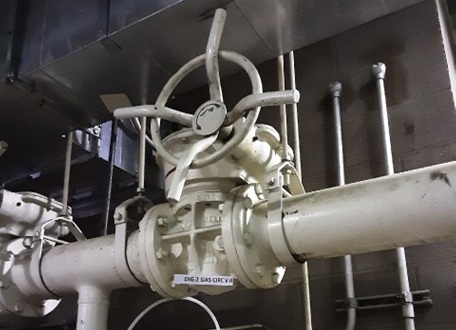
In addition to using GIS as an asset inventory, the digital asset team added the newly collected layers in Trimble Unity Maintain, Flagstaff Water Services’ CMMS. Much like the GIS data collection, the team started small with general work orders to get the water reclamation team on board with using the system. Now, the team can create a preventive maintenance program by documenting and creating work orders and inspections on the various assets.
“The GIS and CMMS applications are still a work in progress; however, the technical switch has helped push the Water Reclamation section to be more organized, thoughtful in their work, and gave us the tools to document when issues arise and problems are solved.” —Troy Dagenhart, Water Reclamation Manager
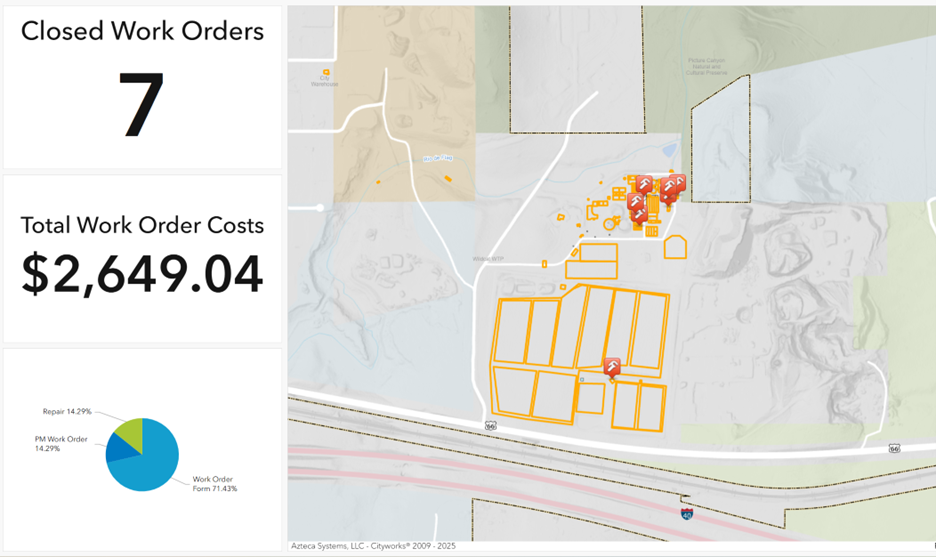
Why Implement GIS for Treatment Facilities:
- Spatial database of treatment facility assets
- Provides operators ownership of data
- Digital accountability
- Understand trouble areas/assets
- Use information to justify future projects, funding, jobs
- Set up success for future operators

Transform Facility Management with ArcGIS
ArcGIS empowers utilities to efficiently manage their facilities through a dependable system of record. It enables rapid asset mapping, data visualization in both 2D and 3D, streamlined maintenance planning, enhanced team collaboration, and seamless integration with other essential business systems. This comprehensive approach supports strategic, data-driven decision-making, boosts operational efficiency, and promotes the long-term sustainability of facilities.
Explore facility and vertical asset management solutions powered by ArcGIS
Subscribe to the Water Industry newsletter “Esri News for Water Utilities and Water Resources“
Follow #EsriWater on social media: X| LinkedIn