Authored by: Tim Jordan, GIS Supervisor, Douglasville–Douglas County Water and Sewer Authority
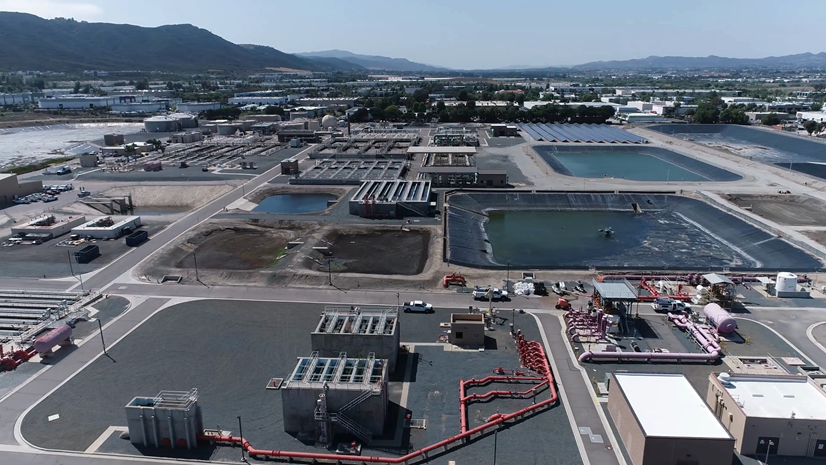
Douglasville–Douglas County Water and Sewer Authority (WSA, or the Authority) manages water, sewer, and stormwater utilities, providing service to a community just west of Atlanta, Georgia. Serving a population of around 150,000, WSA has the capacity to provide 23 million gallons of drinking water and treat up to 13 million gallons of sewage a day. The Authority formed in 1986 and currently manages a 250-acre—soon to be 600 acres—local source reservoir just north of the Chattahoochee River.
After the Authority implemented Cityworks, a GIS-centric computerized maintenance management system (CMMS), they set a goal to implement asset tracking at plants and facilities as a second phase of the project.
The Need for Asset Tracking
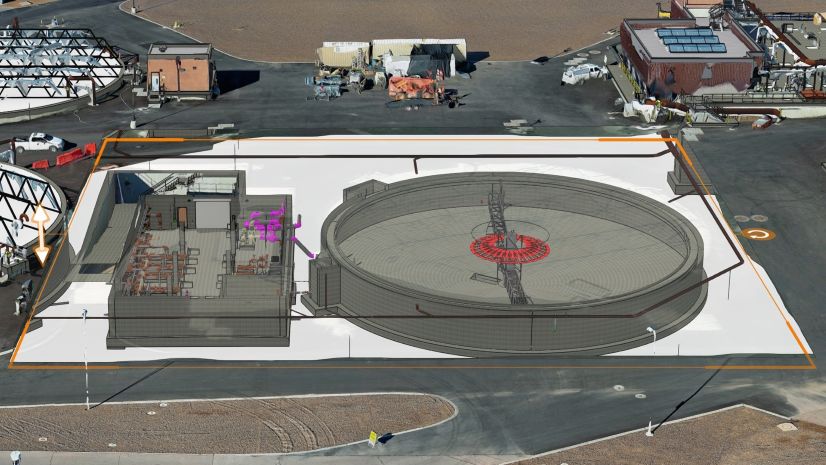
The foundation of our vertical geographic information system (GIS) is not the typical digital twin but stems from the needs of the mechanics and operators who maintain these assets. The only information we currently stored about a facility was a single point with one line going in and one line going out, with a few descriptive attributes like name or facility type. Because of this, we created a goal to identify and track all assets that would have work activities assigned to them through the CMMS.
Project Challenges and Approach
We took on this project knowing that we would not have the resources available to get a detailed BIM or even engineering plans of every facility. We also knew that we had to be able to do it without any additional software licensing. As part of a two-person team at a utility that is considered small to medium-sized, organizing, collecting, and digitizing every asset from all our facilities is a significant project on its own. Then, you also must design and deploy new digital solutions to capture, visualize, and integrate this information with other systems, making it even more challenging. With guidance from our Cityworks implementors and a great team on–site, we felt this project was something we could take on and be successful.
Collaborating Across Teams
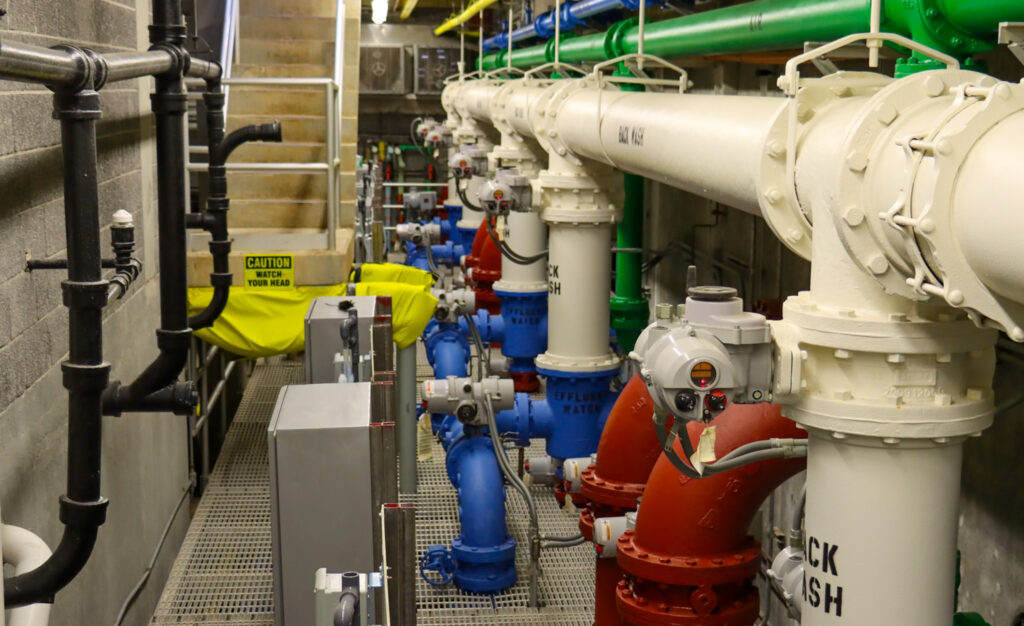
Our first step in narrowing down what we wanted to include in the GIS was to collaborate with our maintenance division. We met with them and discussed the types of work they were already doing and what programs they were looking at doing in the future. We brainstormed with them and produced a guide to follow for vertical GIS assets. The guide included a set of criteria that determined what assets would be captured.
Minimum Asset Cost—Minimum asset cost and repairability were determined to be key factors in defining the resolution of what would be collected. For example, we wanted to track work against a large electrical panel but were not concerned about tracking each individual fuse and switch inside of it.
Repairability—Identify assets that can be repaired so a history of work can be tracked. Assets that are consumed or are designed to be replaced and don’t meet any other criteria may be tracked but are not stored as individual features.
Preventive Maintenance Schedule—Scheduling preventive maintenance for our assets is considered a major part of the mechanic’s day-to-day work as well as keeping up with warranty requirements.
Critical to Operations—It is important to be able to quickly identify and pull records on assets that are vital to a facilities operation.
Based on the criteria above, we developed a plan outlining the requirements for data to be captured in the vertical GIS. Now all we needed was a vertical GIS.
Leveraging Esri Technology
We were lucky enough to be able to take advantage of our Small Utility Enterprise Agreement with Esri. We leveraged the entire enterprise platform, taking advantage of ArcGIS Pro, ArcGIS Portal, ArcGIS Online, and all the field apps that come along with it. Since ArcGIS Indoors is not part of the SUEA, we decided to move forward without it.
Designing a Vertical GIS Data Model
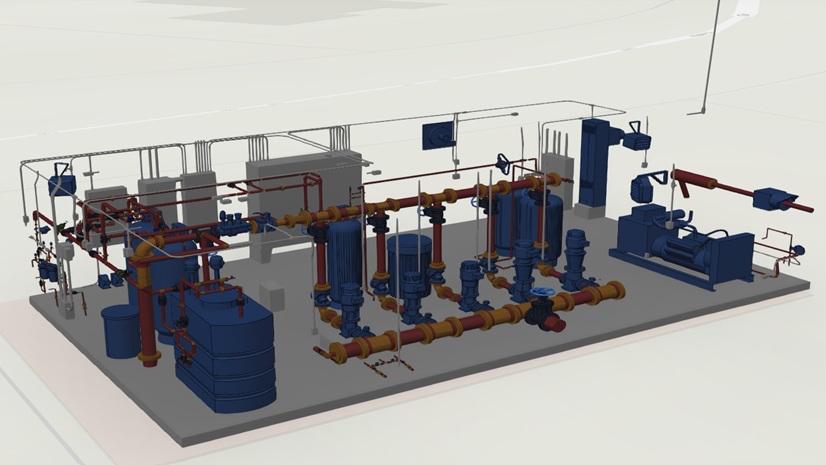
Knowing our budget and resources, it was our goal to organize spatial data in a way that was not an exact 1:1 replica, but still relatable enough to be easily recognized going from map to real life. The data had to be organized to fit facilities that were 40 years old or 5 years old. Spatial network connectivity was not a priority, and most horizontal assets inside the plants themselves would not be captured in detail. There was a lot of inspiration from Esri’s ArcGIS Utility Network solution inside the final data model. We leveraged the idea of containers and created a five-level hierarchy that could be used to organize assets at every site. Subtypes were used to classify each level of the hierarchy, as well as every attribute rule and domain trick you can think of to make the data entry process as simple as possible. The first four levels were captured as polygons and the fifth level as points.
The five levels are defined like this:
- Sites are your basic property lines and facility descriptions.
- Structures are defined as buildings, structures, wells, basins, and property controls.
- Systems describe groups of assets that make up a pump unit, chemical feed system, or SCADA system.
- Subsystems are used to describe the hydraulic systems or mixing units that are a part of a larger system, where the devices could serve a different function.
- Devices are the only point features and represent the individual devices that make up a system. These are the pumps, motors, gearboxes, valves etc.
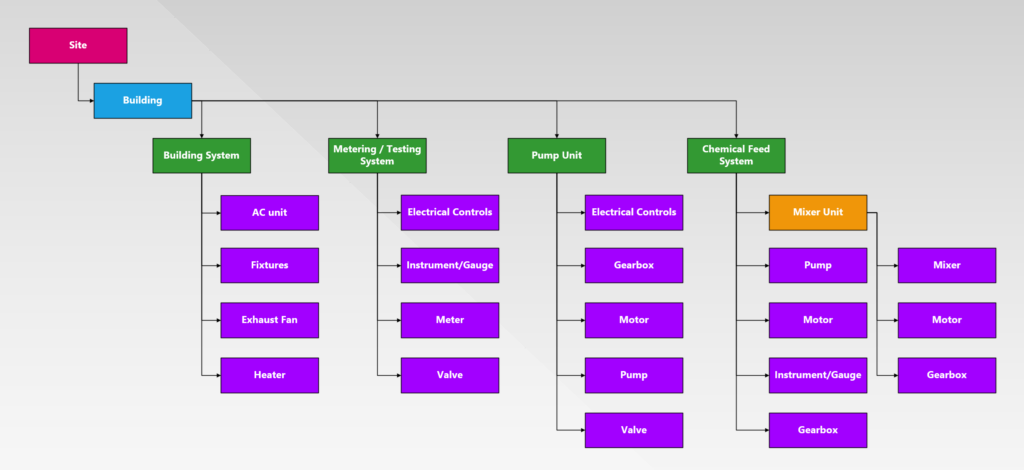
Each level relates back to the one above using a relationship class and geometry location. This allows work, cost, and history to roll up logically without requiring complex networking models. The hierarchy can be accessed directly from the database in the form of custom web tools or by viewing the relationship classes in Esri applications. The web tools were created for access to the hierarchy without having to navigate a map. This allows for quicker work generation for employees that already know the names and locations of assets.
There were two hierarchies and datasets created: one for water facilities and one for sewer facilities. Keeping the two types separate helped simplify the tiers. This also helped keep the field domain lists short and overlap between them was kept consistent. For example, valves have the same subtype number in both datasets, and the abbreviations for facility IDs were the same.
“Tracking work activities for vertical assets is essential for understanding operations and maintenance efforts. DDCWSA [Douglasville–Douglas County Water and Sewer Authority] has taken an effective approach by representing vertical assets spatially on a map and using relationship classes to link related assets. This allows users to easily find and select assets within facilities using the map, as well as navigate the asset hierarchy to see how assets relate to each other. By offering both map-based and hierarchical views, this approach improves usability, streamlines workflows, and helps field staff efficiently create and update work activities while also supporting advanced reporting and management-level tracking.”
—Michael Edwards, PMP, Principal and Sr. Project Manager, Timmons Group
Data Collection
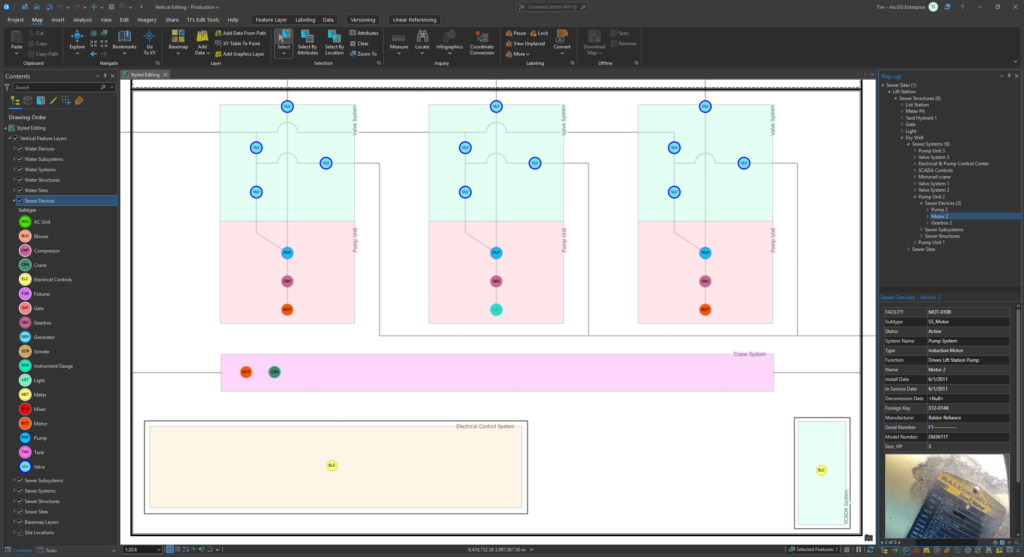
The five-tiered data structure was put into place before any data collection was conducted. These were published feature services with branched versioning in ArcGIS Portal. Initial data entry in ArcGIS Pro was digitized from plans. This helped build out the first four levels while field collection of devices was done using ArcGIS Field Maps. The stylization and labeling of the feature classes took several iterations and continues to be a work in progress. Photos are attached at every level and help capture the name plates of devices that provide crucial asset information. To help give context for our layers, custom basemaps were created for these facilities to better represent how these assets are arranged.
Integration with Cityworks
Incorporating this vertical GIS with Cityworks, which can consume the same published feature services, gives the ability to assign work activities to features from any level. This goes from broad site checks all the way down to motor repair. With the hierarchy system, not only can we see how assets are trending in cost, repairs, and labor but we can also see those trends across systems or entire sites. Integration gives our mechanics the advantage of having access to all the vertical GIS information, alongside any requirements of a work activity. Plant operators can be confident in documenting and submitting any issues occurring with the ability to verify assets on a map. Purchasing and accounting departments can shorten research time by having electronic access to consolidated data. All of this helps management make informed decisions based on assets and the costs associated with them.
“Authority personnel maintain a 23 MGD drinking water treatment plant, 70+ pumping stations, three wastewater treatment plants, and a wastewater beneficial reuse facility. We take a data-driven approach to planning, asset rehabilitation/replacement, and task management, and our goal with developing our vertical GIS and implementing Cityworks with our vertical facilities is to better manage these critical assets. Tracking work orders, preventive maintenance, and equipment replacement/refurbishment in Cityworks will take our management of these resources light-years in[to] the future and give us the readily accessible data to make wise decisions to protect these resources for future generations of Douglas County customers.”
—Chip Butts, PE, Systems Maintenance Manager, Douglasville–Douglas County Water and Sewer Authority
Lessons Learned and Looking Ahead
One of the biggest challenges with a project like this is finding that there is not a solution out there that fulfills all your needs, and you must decide it is time to start creating something yourself. Another lesson learned came from running into systems and assets that didn’t necessarily fit within our strict hierarchy. So, we had to decide between bending the rules a little or going back and changing the schema, which could have compounding effects on work already completed. There were several cases where creating domains for fields in the subtypes to categorize assets helped to solve those few outliers. For example, classifying the types of pumps using a field domain as centrifugal, piston, peristaltic, etc., and then defining the function field as submersible, vacuum, dynamic, or displacement helped eliminate the need for additional subtypes. This also cut down on the number of specific work activity templates that needed to be maintained in Cityworks.
For our utility, creating a vertical GIS became less about creating a perfect digital twin and more about creating a system that people will use. We are already looking at adding a document attachment solution for electrical schematics, product manuals, contracts, and as-built information. There have been plenty of challenges with this project and the amount of support has been tremendous. The foundation laid makes the path forward much easier if we decide to move to ArcGIS Indoors or Utility Network for our vertical GIS.

Transform Facility Management with ArcGIS
ArcGIS empowers utilities to efficiently manage their facilities through a dependable system of record. It enables rapid asset mapping, data visualization in both 2D and 3D, streamlined maintenance planning, enhanced team collaboration, and seamless integration with other essential business systems. This comprehensive approach supports strategic, data-driven decision-making, boosts operational efficiency, and promotes the long-term sustainability of facilities.
Explore facility and vertical asset management solutions powered by ArcGIS
Subscribe to the Water Industry newsletter “Esri News for Water Utilities and Water Resources“
Follow #EsriWater on social media: X| LinkedIn