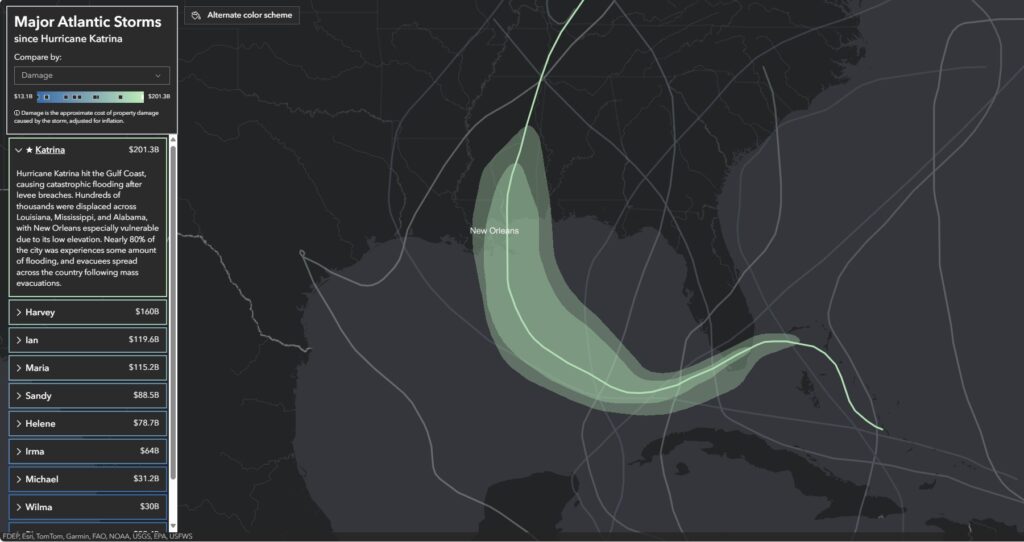
Explore this interactive map comparing Hurricane Katrina to the 10 biggest storms since its landfall
An Overview of Hurricane Katrina
Hurricane Katrina made landfall in Louisiana on August 29, 2005, and its effects are still felt today. Katrina is the costliest storm on record to hit the United States, with an estimated $201.3 billion in damages, and one of the deadliest storms recorded, with nearly 1,400 lives claimed by the hurricane and its aftermath, as shown in this interactive map. While the storm that made landfall was immensely powerful, with wind speeds of up to 175 miles per hour, the devastation truly began when the levees began to break, leaving the city of just over 400,000 people almost 80 percent underwater. Katrina caused a massive displacement of residents, not just from the city of New Orleans, but from the entire region, with as many as 1.5 million people leaving their residences in Louisiana, Mississippi, and Alabama following the storm. In New Orleans, the population has still not returned to pre-Katrina levels. The current population of the metro area is approximately 84 percent of its pre-storm population.
New Orleans is no stranger to threats posed by severe weather. Located along the banks of the Mississippi River, with over half of the city located below sea level, the city sits between Lake Pontchartrain to the north and the Mississippi River to the south. Forty years before Katrina made landfall, Hurricane Betsy hit Louisiana, causing over $1 billion in damage and revealing weaknesses in the city’s protections against the threat of storms. Since the US Army Corps of Engineers assumed responsibility for levee design and construction after Hurricane Betsy, a storm as powerful as Katrina had not yet put the system to the test.
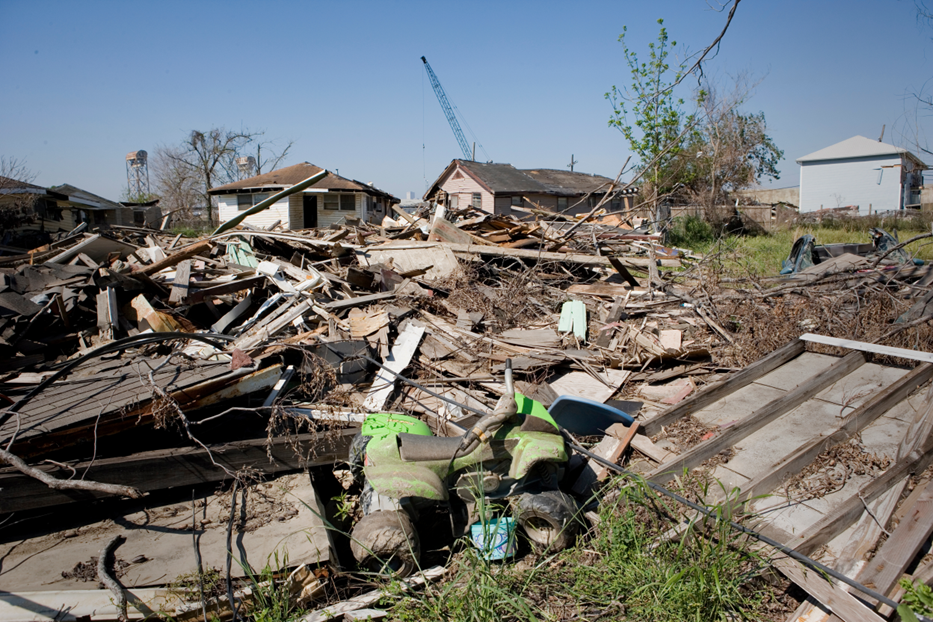
Homes in the Ninth Ward of New Orleans destroyed after Hurricane Katrina
GIS for Disaster Response and Recovery: Then and Now
Prior to Hurricane Katrina, Louisiana’s Emergency Operations Center (EOC) had limited GIS resources, which were strained after landfall. This created a need for coordination between those within the GIS community, including groups from Louisiana State University (LSU) and the Governor’s Office for Homeland Security and Emergency Preparedness (GOHSEP). The EOC lacked critical base layers and imagery over the state and had to turn to external groups to provide this information. These groups worked together and rapidly formed a system to create both digital and paper maps that were used in search and rescue operations, helping responders identify locations in need of search teams, allocating appropriate resources to those areas, and identifying where helicopters could land to drop off the teams. In addition to helping those working in response to the storm, the GIS team within the EOC was able to assist victims who reached out to GOHSEP for information on their homes. The team analyzed their available GIS data and satellite imagery to inform the survivors of whether their house was flooded and, if possible, to what depth.
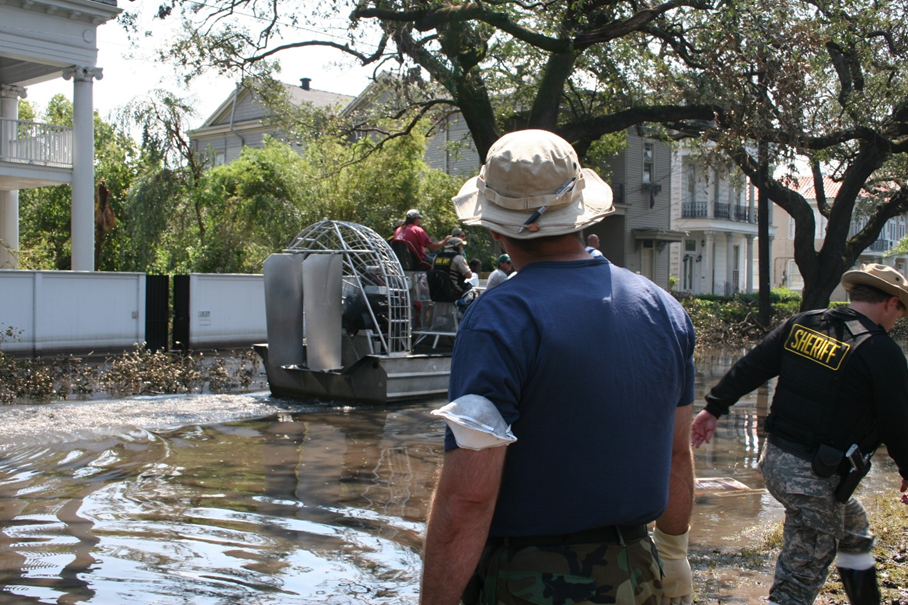
Search and rescue teams navigating roads flooded from Hurricane Katrina by boat
Outside of the state’s EOC, GIS leaders from the United States Geological Survey (USGS), the National Geospatial Agency (NGA), the Department of Homeland Security (DHS), and Esri met to discuss a need for a coordinated GIS effort to gather information from various entities and create a shared GIS database for those working in response to Hurricane Katrina. Within two weeks, the GIS for the Gulf database was provided to nine FEMA field offices and many first responders. Data from the GIS for the Gulf database was used to aid in the ongoing response efforts to Katrina, as well as for disaster preparedness and planning for events that followed, like Hurricane Rita.
Today, multiple USG agencies use GIS to provide authoritative data to the public for disaster response and preparedness, including the FEMA Geospatial Resource Center, which was built using ArcGIS Hub. The site provides disaster response data for eight hazard types, which can be used by the public, as well as decision-makers at the federal, state, and local levels. For flood specific resources, FEMA has created the Floodplain Management GeoConnect Hub to help users understand their flooding risk and build resilience.
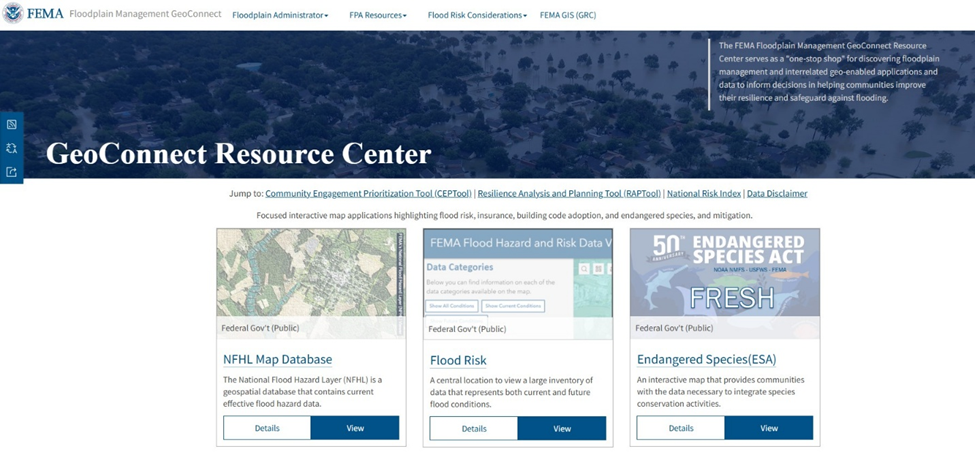
The Floodplain Management GeoConnect Hub site, a part of FEMA’s Geospatial Resource Center, both built using ArcGIS Hub.
The American Red Cross also made use of GIS in both its preparation and response to Hurricane Katrina, identifying counties at risk ahead of the storm, and those that could serve as refuge areas, supply centers, and operating facilities. After landfall, they used GIS to analyze the damage, assess how many people were impacted, locate where to provide assistance, and determine how best to deliver it. The American Red Cross continues to use GIS across their operations, providing robust geographic information that is open to the public through RC View on ArcGIS Online, which is the official online mapping portal for the organization.
Where Do We Go from Here
As the climate continues to change and natural disasters, including hurricanes, continue to become more intense, the need for more accurate and up-to-date information increases. Improvements in data sharing between organizations working in disaster preparedness and response through collaborative, online tools like ArcGIS Hub allow users from multiple organizations to operate using the same source of truth. Interactive applications utilizing geographic analyses, such as this one created to compare Hurricane Katrina to the biggest storms since its landfall, can be embedded in ArcGIS Hub sites or in ArcGIS StoryMaps. These tools also provide an easy mechanism for sharing up-to-date information with the public.
Today, GOHSEP employs ArcGIS Hub to provide Virtual Louisiana, a common operational picture for the state’s emergency response community. The site provides real-time data to the public on severe weather, access to state resources, and information on how to be prepared when a storm hits. GOHSEP also uses tools like ArcGIS Survey123 to collect damage assessments in the field more quickly, which decreases the time it takes to share information with other responding organizations, like FEMA.
ArcGIS Living Atlas of the World provides access to live feeds from organizations like the National Hurricane Center, the National Weather Service, and the Joint Typhoon Warning Center. The storm reports, weather and wind station data, and live views of active hurricanes, cyclones and typhoons can be utilized to increase real-time awareness of impending threats and help communities be more prepared.
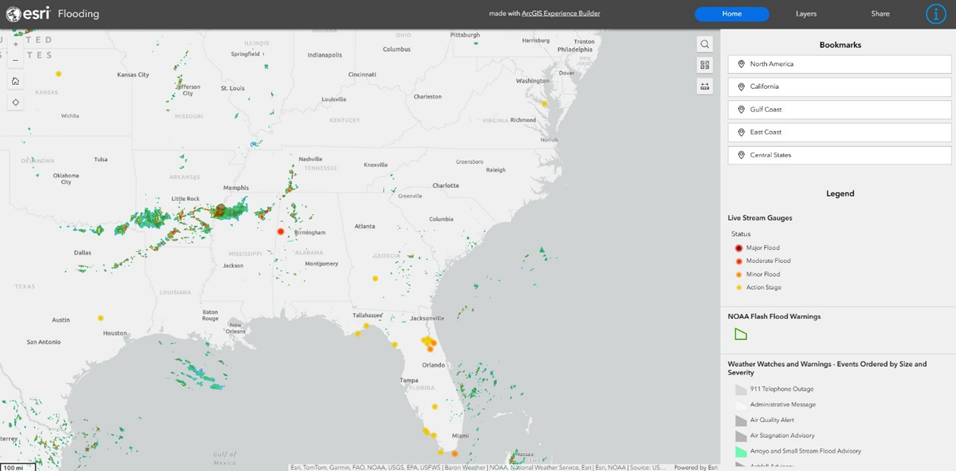
This is an example of an interactive application, built with ArcGIS Experience Builder, showing live weather watches and warnings from the ArcGIS Living Atlas of the World
Artificial intelligence (AI) within ArcGIS also contributes to better preparedness and response to severe weather. Before disasters, AI can be used for predictive modeling and simulations, which can help organizations plan for multiple potential scenarios and update their plans accordingly. After disasters, AI can help to expedite impact analyses through ready to use tools and pretrained models to help complete fields in Survey123. It can also help expedite information collection and sharing through ArcGIS QuickCapture and ArcGIS Field Maps.
Tools like ArcGIS Business Analyst, which includes data on demographics, business, lifestyle, and spending, as well as census data, can help provide a clearer picture of the impact on communities, both pre- and post-disaster. Combining a wide array of information through GIS allows users to understand in detail the particular challenges different areas may face when a storm is coming. Such data could include the number of residents in an area who do not own a vehicle and would need assistance evacuating; the number of residents whose primary language is not English and would need translated guidance; or the number of those living with disabilities who would need special help evacuating or seeking shelter. After a disaster, the same information can help those responding to provide more accurate assistance based on the community’s unique needs.
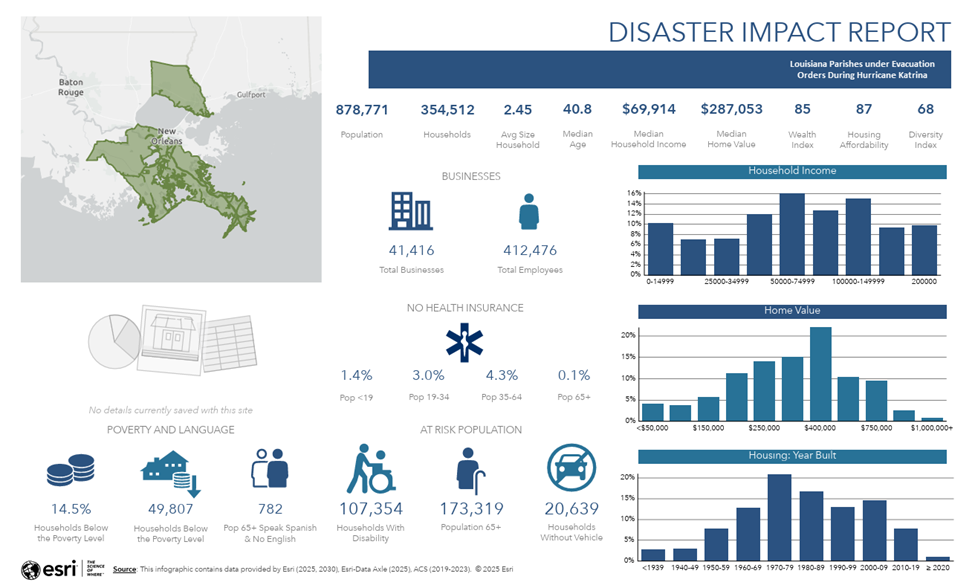
An example infographic from ArcGIS Business Analyst displaying potential disaster impact in the five parishes that were evacuated during Hurricane Katrina
Twenty years after Hurricane Katrina, we can still draw lessons from the storm: how to effectively communicate the threat of storms to at-risk communities; how to better estimate the needs of those in a storm’s path; how to best manage evacuation routes; where to place shelters for those left behind; and how to manage knowledge and resources during the recovery phase. Using a geographic approach, we can gather disparate information from sources across local, state, and federal governments and the private sector to paint a more accurate picture of those living within affected areas. As a result, we can better understand their unique challenges and respond more effectively.