By Micah Knox, Resource Specialist, Yucaipa Valley Water District
The Yucaipa Valley Water District (YVWD), established in 1971, is a vital public agency dedicated to managing water resources for Yucaipa, Calimesa, and unincorporated areas of Riverside and San Bernardino Counties in Southern California. Located approximately 75 miles east of Los Angeles and 12 miles southeast of San Bernardino, YVWD operates within the Upper Santa Ana Valley groundwater basin, specifically the Yucaipa groundwater subbasin, which spans about 40 square miles and is adjacent to the San Bernardino and San Timoteo subbasins. The district provides essential services including high-quality drinking water, recycled water, wastewater collection and treatment, and brine disposal, to name a few.
Through the integration of Esri ArcGIS Field Maps and ArcGIS Survey123 and Microsoft Power Automate, the district has become a front-runner in meeting California’s new leak registry requirements and has effectively solved the problem of quantifying all water loss across the entire system with one simple form. We have created background water-loss formulas through Survey123 that can accurately calculate water lost from a pipe based on several parameters, and integrated extensive visibility logic that turns a single-use form into a multiuse water-loss form for all applicable categories across our system. Additionally, most information autopopulates from field maps, making the job of a water operator easier, less time-consuming, and more accurate than before.
Challenge
As a district dedicated to providing high-quality drinking water, one of our biggest hurdles comes in the form of preventable water loss. Not only that, but being able to quantify water loss, geolocate and visualize the leaks, and diagnose the issue at the source has proved difficult for us and many other districts in the past.
So how does a water district improve its water-loss numbers? Replace all pipes? While this solution would more than likely fix a system for a considerable while, the cost and time allocated to such a project are nearly unquantifiable.
The answer is rooted in reporting. By reporting leaks in a service area with more accurate data and just more data in general, we set the district up to successfully allocate resources to specific problem areas.
Previous reporting efforts fell short due to insufficient technologies and reporting errors. Operators in the field were using a dated survey application with poor operating capabilities for our needs, especially considering the newly changed regulations. The user interface was clunky, and the administrator side was a nightmare to work on, especially in running calculations and trying to create smooth workflow. And operators were too busy actively stopping a leak to input estimations of water-loss numbers, so the numbers that field staff received were either null or inaccurate.
The solution? Field Maps and Survey123 Connect.
Solution
To understand the scope of work and the nature of the solution, it’s important to understand how the YVWD service area is set up. Yucaipa is in an area with lots of mountains and valleys. We have a surface elevation gain of 3,140 feet from bottom to top (the low being 2,044 feet and the high being 5,184 feet), giving us 18 separate pressure zones. For reference, a medium sized water district averages 3–10 pressure zones, so what we have is significantly more. This creates pressure variation across the system that must be considered when calculating water loss.
Simplifying Reporting in the Field
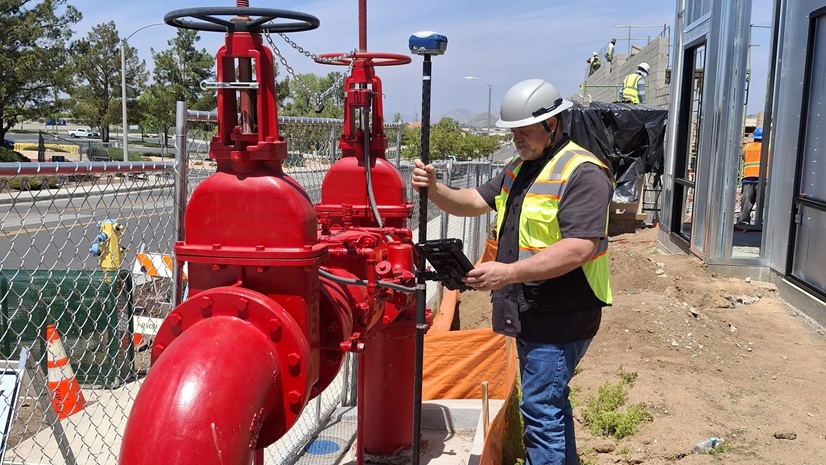
To begin, we set up a map in Field Maps with individual layers of our pipe infrastructure, well locations, sample stations, reservoirs, and hydrants. By including all these extra layers on top of our pipe layer, we can monitor water loss in every iteration. Whether we’re monitoring a leak, authorized or unauthorized discharge, engineering fire flow, hydrant flushing, tank rehabilitation, sample station routing, or bacteria sampling, our form can handle and categorize all of it. Each asset has a unique Asset_ID and metadata. This data includes pipe diameter and material from the pipe layer, plus the asset installation date for all other layers including the aforementioned pipe layer. This data is available via pop-up when clicked alongside the Report Leak/Discharge button. When the user clicks this button, a webhook sends them directly to the Survey123 application while also transferring all data from that specific asset into fillable fields. This allows operators to have data filled in from the pipes they’re actively working on, creating a headache-free way to acquire tedious information. The Field Maps intro to the survey is a huge leap for our operators as it allows them to worry more about the leak they’re fixing and less about what data they need for proper reporting. This also means the report receives more valuable information than ever, with the bonus of it all being uniform and consistent. We don’t have to worry about an operator being too busy working on a leak to input all necessary data for reporting, because the form has seamlessly done it for them.
“The fire flow form is a great tool for managing efficient and accurate system flows. The ease of use makes for a convenient system test that is easily transferable to our hydraulic model.” Matt Vara, YVWD Public Works, Engineering Supervisor
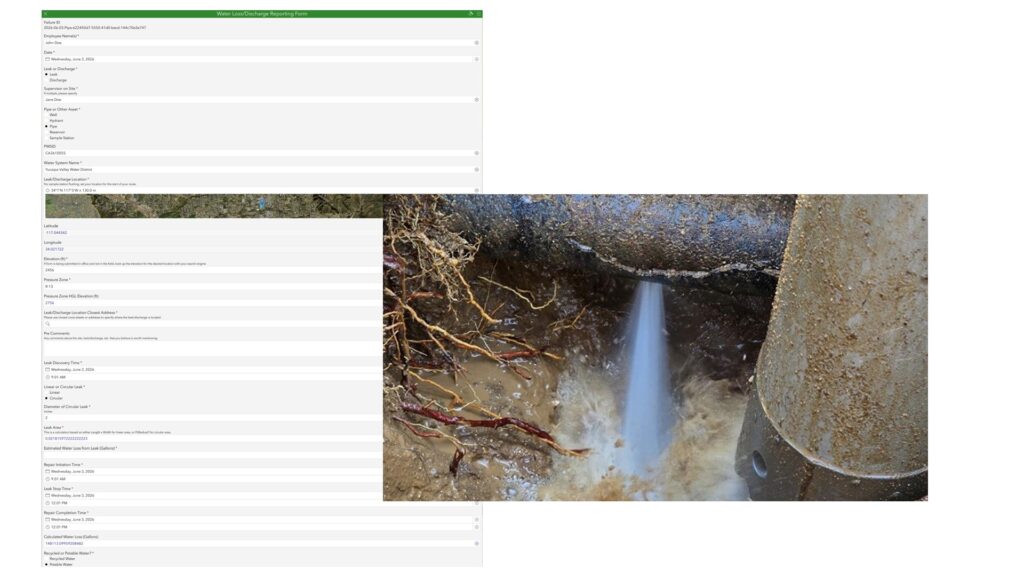
Calculating Water Loss
The point of this form is to calculate—as accurately as possible—an estimated water-loss number based on whatever data we can easily acquire within our system. As a team, we were met with the challenge of creating a bulletproof formula that does just that. With California regulations being brand-new, seemingly no other water district had a way of calculating this, so we were left to devise and integrate this formula into Survey123. Additionally, we wanted to make it easy enough that anyone could pick up a device and do it, with little to no training required.
This posed problems from the start as we wanted to make sure actual inputs from operators were minimal in order to remove any potential errors from the equation. We eventually came up with this equation:

The equation can be broken down to its specific parts:
- t is the time in minutes of leak repair completion time minus leak discovery time.
- h1 is the elevation of water in the reservoir by pressure zone in feet. (These are static values the district has per pressure zone, built into the form as a drop-down list. Operators choose their zone and it autofills the formula.)
- h2 is the elevation of the leak or discharge point via z-axis geolocation in feet.
- Aleak is either length x width or
, depending on whether the leak is linear or circular in nature.
- 448 converts calculations from cubic feet per second to gallons per minute.
- 0.6076 acts as a discharge coefficient taking into consideration friction loss, flow contractions, etc.
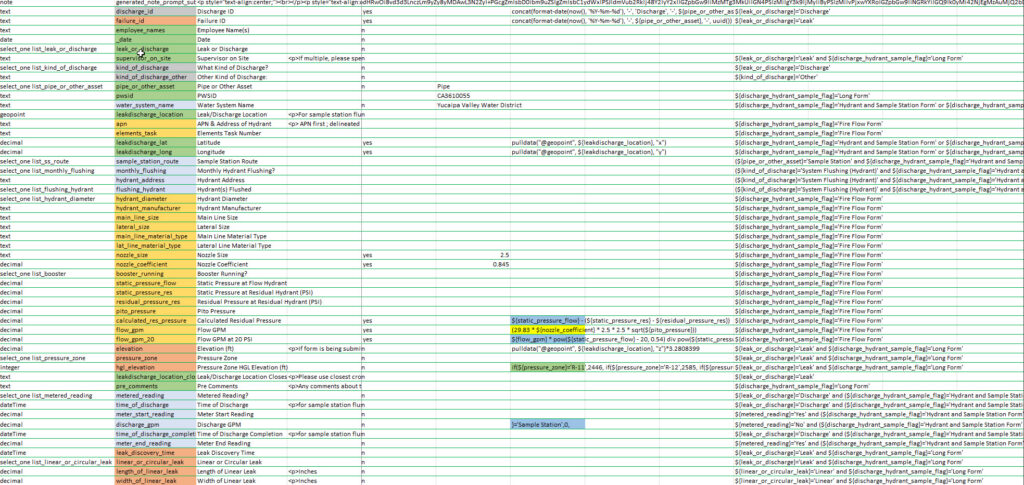
When the equation is reformatted and moved into Survey123 Connect, it looks like this:

A second formula is used for authorized discharges from wells, hydrants, reservoirs, and sample stations. However, that equation relies less on higher-level mathematics and more on a series of inputs with basic subtraction and time conversion. When formatted and moved to Survey123 Connect, it looks like this:

For this form to work, all this data was integrated into background calculations and automations via Survey123 Connect. This created an ecosystem void of user error, unless an operator misjudges the size of a leak. By adding in the area calculation, we made it so that all operators need to do is give us either the diameter of a circle or the length and width of a crack—no calculations required, just basic number inputs. Elevation is geolocated, pressure zones have predetermined values that can be selected from a drop-down menu, and a unique ID is automatically assigned and randomized based on a variety of internal factors. This created an easy-to-use, fully functional form that does exactly what it is intended to do, and we couldn’t be happier.
Results
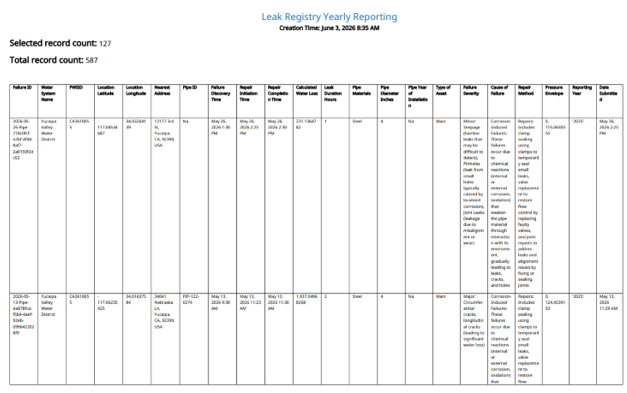
With this system having been in operation for well over a year now, we can confidently say its implementation has made a significant and measurable difference in addressing water loss within the district. While small adjustments were necessary along the way to better tailor the form to the needs of specific operators, the system now functions largely on its own with minimal intervention.
On a monthly basis, we access the Survey123 back end and easily export water-loss reports for inclusion in the state’s monthly Safer and Affordable Funding for Equity and Resilience (SAFER) program report. In addition, we have developed a report that meets all requirements for the Making Conservation a California Way of Life reporting framework, placing us well ahead of the 2029 compliance deadline.
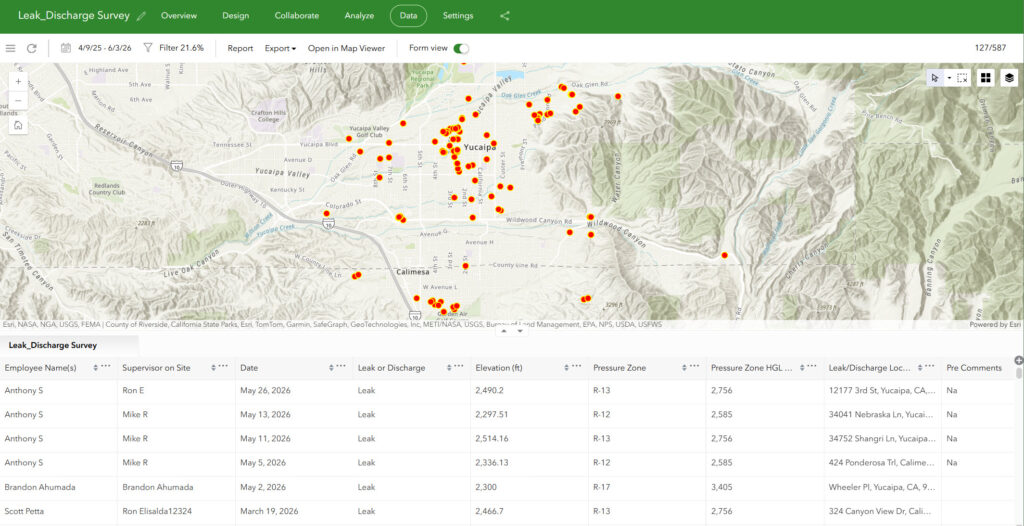
The default point-mapping features built into Survey123 have allowed us to identify recurring problem areas within our service area that require attention. Soon, this will allow us to better route our public works department—as well as leak detection companies—toward areas of concern. By proactively identifying these areas, we can detect major leaks before they escalate and begin prioritizing infrastructure improvements in the weaker portions of our system.
Ultimately, this saves us time, money, and—most importantly—water. It is important to recognize that where water is lost, revenue is lost as well. When revenue is lost, fewer dollars are available to reinvest into the very infrastructure needed to improve our pipelines. This creates a negative feedback loop that this new system is helping break.
Accurate leak detection and water-loss monitoring are essential not only to the long-term health and sustainability of our water resources, but also to the continued success and resilience of the community.
Conclusion
The implementation of ArcGIS Field Maps, Survey123 Connect, and Microsoft Power Automate has transformed the way Yucaipa Valley Water District tracks, calculates, reports, and responds to water loss. What began as a need to meet new regulatory requirements has evolved into a practical, field-ready solution that improves data accuracy, simplifies operator workflows, and provides the district with a clearer picture of where water loss is occurring across the system.
By automating calculations, reducing manual data entry, integrating asset information, and geolocating leak and discharge events, YVWD has created a reporting process that is both more reliable and more actionable. The system not only supports compliance with current state reporting requirements, it also gives the district the tools needed to make more informed decisions about infrastructure improvements, leak detection priorities, and long-term water resource management.
As California continues to place greater emphasis on conservation, accountability, and sustainable water management, tools like these will become increasingly important for public water agencies. For YVWD, this project represents more than a successful technology implementation; it represents a meaningful step toward better stewardship of our water supply, stronger infrastructure planning, and continued service to the community. By identifying water loss more accurately today, we are better prepared to protect our system, our subbasin, and our customers for the future.
“When water is lost, revenue is lost. When revenue is lost, fewer dollars are available to reinvest back into the very infrastructure needed to improve our pipelines.”
Wade Allsup, Chief Information Officer, YVWD

Stay Connected with Esri’s Water Team
ArcGIS is an enterprise geospatial platform that enables modernization of workflows with easy-to-use applications. Strengthen your organization with GIS-based solutions that will increase efficiency and provide insight for decision-makers. Visit the Esri Water Utilities web site for more information.
Join the Water Utilities Community
Follow #EsriWater on social media: X | LinkedIn
Subscribe to the Water Industry newsletter “Esri News for Water Utilities and Water Resources“