May 26, 2023, marks National Heat Awareness Day, an occasion to reflect upon the growing dangers of climate change, urban heat, and the innovative methods we can leverage to alleviate their impact, particularly the power of geographic information system (GIS) technology.
Unmasking Urban Heat Islands
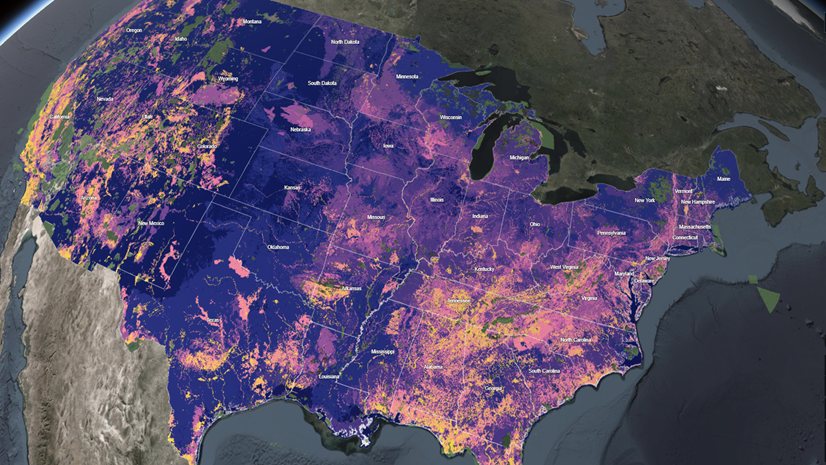
Urban heat islands refer to cities becoming warmer than neighboring rural regions. This phenomenon stems from heat-storing dark surfaces, a lack of vegetation, tall structures, and waste heat emanating from machines or other processes that use energy. With increased temperatures, longer heat seasons (summers), and the U.S Census Bureau estimating that 80% of Americans live in urban areas, we cannot afford to ignore the issue.
Why is Urban Heat a paradox?
Cities are centers of innovation, culture, and economic growth. As we strive to develop and grow our urban spaces for improved quality of life, the same urban infrastructure also contributes to increased heat levels, creating a situation that poses significant health and environmental challenges to their inhabitants. But not all residents are impacted equally. There is an unfortunate and undeniable interconnection between extreme heat, health outcomes and equity. It is essential to pinpoint historically underserved, vulnerable population groups.
The Vulnerable Amidst the Heat
There are several groups of people who are at higher risk for heat-related morbidity and mortality. As is often the case, the oldest and the youngest in society are at increased risk for heat stress. Older people may have impaired thermoregulatory response, increasing their susceptibility to heat-related illness. Young and healthy kids are more likely to engage in strenuous outdoor play, even when it’s hot. Other vulnerable groups include those working in outdoor occupations like agriculture or construction, low-income communities who may have little choice about working in the heat, unhoused people and those living in mobile homes with low levels of insulation and energy supply, and neighborhoods with less shade and cooling infrastructure, which is often a result of segregation, disinvestment, and resulting economic inequality.
The Health Risks
Among all weather-related events, extreme heat is the deadliest. In the U.S. alone, heat is responsible for over 700 deaths per year. In addition, extreme heat can exacerbate existing medical conditions like hypertension, and heart disease, cause heat stress, heat exhaustion and heat stroke, worsen lung and kidney diseases, disrupt sleep, and contribute to mental fatigue, aggression, trigger psychotic conditions and increase suicide rates. Importantly, most heat-related conditions and deaths are preventable.
The Silent Killer: Data Limitations
It is likely that the number of deaths from extreme heat are significantly higher than current research has shown. As with any challenge needing to be addressed, the foundation for understanding is based on data. Unfortunately, excessive heat often isn’t documented as a primary or contributing cause of death, making it a silent killer. Additional challenges in data accuracy arise from not including non-U.S. resident deaths, attributing deaths to residence addresses regardless of the actual exposure location, and lack of information on the circumstances of death. Optimizing our ability to respond will require greater attention to foundational data.
Harnessing GIS for Heat Resilience
Despite the data limitations, GIS technology offers both near-term and long-term solutions to tackle the urban heat effect. The opportunities to use GIS technology are described in the paragraphs that follow.
Near-term Solutions
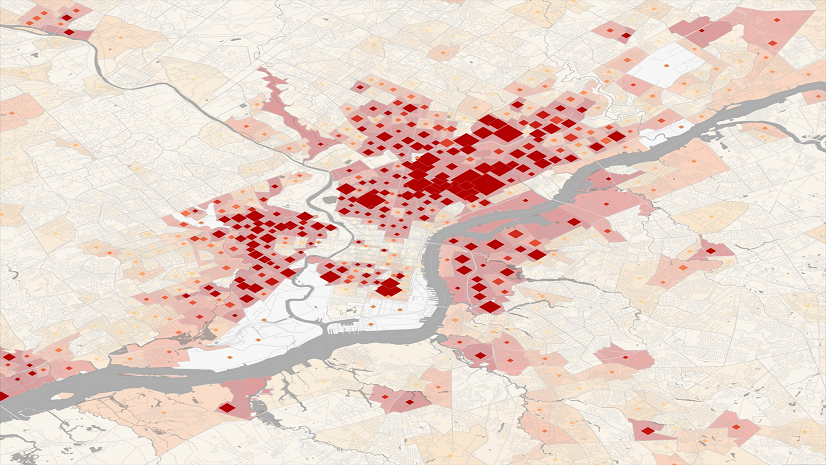
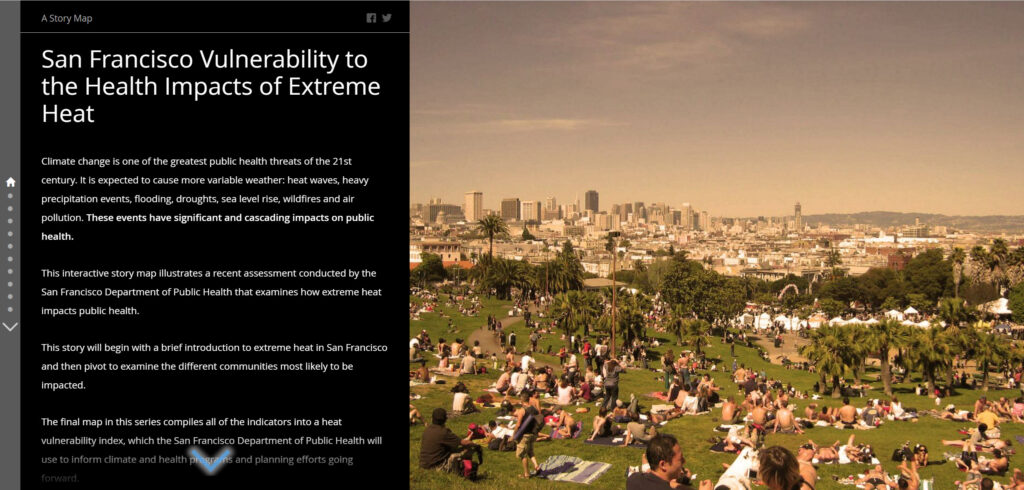
Heat vulnerability assessments, like the one performed by San Francisco, California analyze heat exposure severity, prevalence of heat sensitive or vulnerable groups, and neighborhood-by-neighborhood adaptability to heat, i.e., having the economic, political and social resources to be resilient. Such micro-geographic assessments enable proactive responses to heat emergencies.
Governments can leverage GIS tools to monitor weather conditions and syndromic surveillance data to provide both public alerts and determine the timing for enacting their heat response plans. This is a little bit different from what the National Weather Service already does with their heat advisories. This would be more like what California has launched with the September 2022 passage of Assembly Bill 2238 which, by 2025, will have a system to rank heat events and the potential for health dangers to inform decisions by local governments about when to take action to protect those most at risk.
Enhancing coordination across the health sector, conducting outreach to vulnerable communities, and deploying preventive measures in the most vulnerable regions are also integral parts of near-term solutions. ArcGIS Hub offers an ideal platform for organizing people, data, and tools, making stakeholder and community engagement easier. A hub site is a great place to share stories that can effect change, influence opinion, and create awareness. Digital storytelling with ArcGIS StoryMaps facilitates multi-media experiences, including interactive maps, to contextualize urban heat locally and encourage residents to take heat safety measures of their own. I love the example from Miami-Dade which clearly defines the problem, reviews the health risks, and provides guidance related to personal care actions that keep people safer.
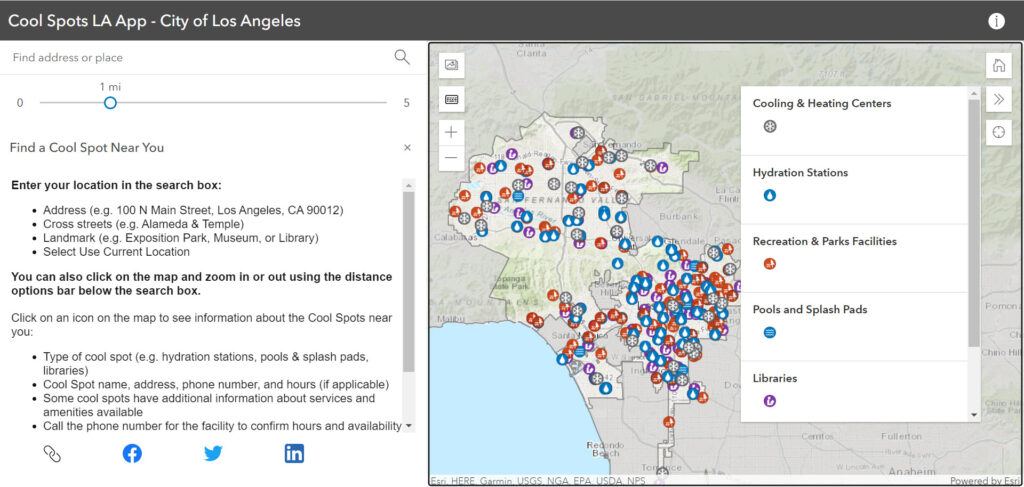
Another near-term solution that can stand alone or be a part of a heat awareness hub is a locator app. This is a simple but powerful application that is configured to collect community resources and then make them searchable by proximity in a mobile or desktop client. A great locator app example comes from Los Angeles with the Cool Spots LA Map. When it gets too hot in LA, folks can search for all the best places to get relief from pools and splash pads to libraries, recreation centers, and hydration stations. They have over 200 resources included.
It’s important to prioritize the potential near-term solutions to where they make the most sense and serve those most susceptible to heat impacts. For instance, GIS technology can help determine when and where to provide tarps for additional shade and create cool roofs and pavements that reflect sunlight, reducing heat absorption and conserving energy.
Long-term Solutions
Some interventions take longer to provide benefit but are equally important to mitigating health impacts of extreme heat and reducing or eliminating current and longstanding inequities.
Building new green (shade trees) and blue (hydration) infrastructure takes time and resources and is critical to long-term adaptation and resilience for cities. Areas laden with asphalt, buildings, and highways absorb a hefty chunk of solar energy, releasing it as heat. Comparatively, regions with green space – parks, rivers, and tree-lined streets – take in and release less heat. Using GIS technology to visualize the microclimates in a city has been very useful in Prague, Czechia who will soon be developing 3D models to support larger infrastructure decisions. And there’s nothing like adding virtual reality to 3D city maps to truly understand the impacts of heat on different populations. The National Oceanic and Atmospheric Administration (NOAA) is using virtual reality with their 3D city maps to create that immersive experience.
These mapping efforts inform the longer-term decisions about enhancing green infrastructure which includes planting trees in shade-deficient urban areas and greening school yards to counter the effects of urban heat islands. Having a sufficient urban tree canopy and grassy areas lowers air temperatures, decreases cooling costs, and mitigates air pollution.
GIS technology can also be used to select the best places to enhance blue infrastructure with new cooling centers and hydration stations. Determining where these are most needed requires not only an understanding of the microclimates within a city, but also requires calculations of accessibility for populations.
And there are bigger issues that need solutions as well. Including resolving longstanding disparities that hamper a community’s resilience to extreme heat events, reducing carbon emissions, updating building codes for insulation and air conditioning requirements, funding energy assistance programs, and alleviating houselessness. In all these challenges, GIS technology can help move us toward a more sustainable urban future.
GIS: A Game Changer in Heat Adaptation
The observation of National Heat Awareness Day serves as a stark reminder of our warming cities and the need for innovative solutions. GIS technology emerges as a game changer, enabling us to analyze, predict, and devise strategies that help mitigate the impact of urban heat. As we continue to urbanize, GIS technology becomes an indispensable tool, empowering us to create climate-resilient cities.
If you’re ready to get started, here are three of my favorite resources:
- Get to know HEAT.gov, a product of the National Integrated Heat Health Information System (NIHHIS) and Esri. This should be your ‘go to’ source of information about heat health and solutions for the public, health professionals, and national, state, tribal, and local governments. NIHHIS was created jointly by the Department of Health and Human Services’ Centers for Disease Control and Prevention and the Department of Commerce’s NOAA.
- See the Climate Mapping for Resilience and Adaptation (CMRA) portal, launched by the Biden administration, that addresses extreme heat, providing a live dashboard to view real-time extreme weather patterns. The portal also provides data about vulnerable people, so governments can assess and assist communities to make equitable adaptations and responses.
- This hub site, developed in collaboration with NOAA, FEMA and Esri, provides a step-by-step guide to creating climate resilient communities with GIS.
In the meantime, I wish you a cool day.