


April 23, 2021 |
Jack Dangermond | Resilience
The Prague Daily Monitor featured this headline in early July 2015: “Extreme Heat Wave Has Hit Czech Republic.” The story said currents of hot air moving from Africa were driving up temperatures across Europe. It was the first of four heat waves to blast the Czech Republic in 2015. More than half of the days in July and August that year recorded extreme temperatures, breaking a record set in the country during a similar string of heat waves in 1994.
Two years after the 2015 heat waves, the City of Prague, the country’s capital, issued a document that outlined a four-year plan, beginning in 2020, to “enhance long-term resilience and reduce vulnerability to climate change.” To meet these objectives, officials from the Prague Institute of Planning and Development (IPR Prague) have adopted a big data approach. They make extensive use of a geographic information system (GIS), which allows them to understand how Prague is reacting to the climate crisis in the present while also devising ways to meet the climate-related challenges of the 21st century and beyond. GIS allows IPR Prague to view and analyze the city in both its street-level granularity and its bird’s-eye view totality.
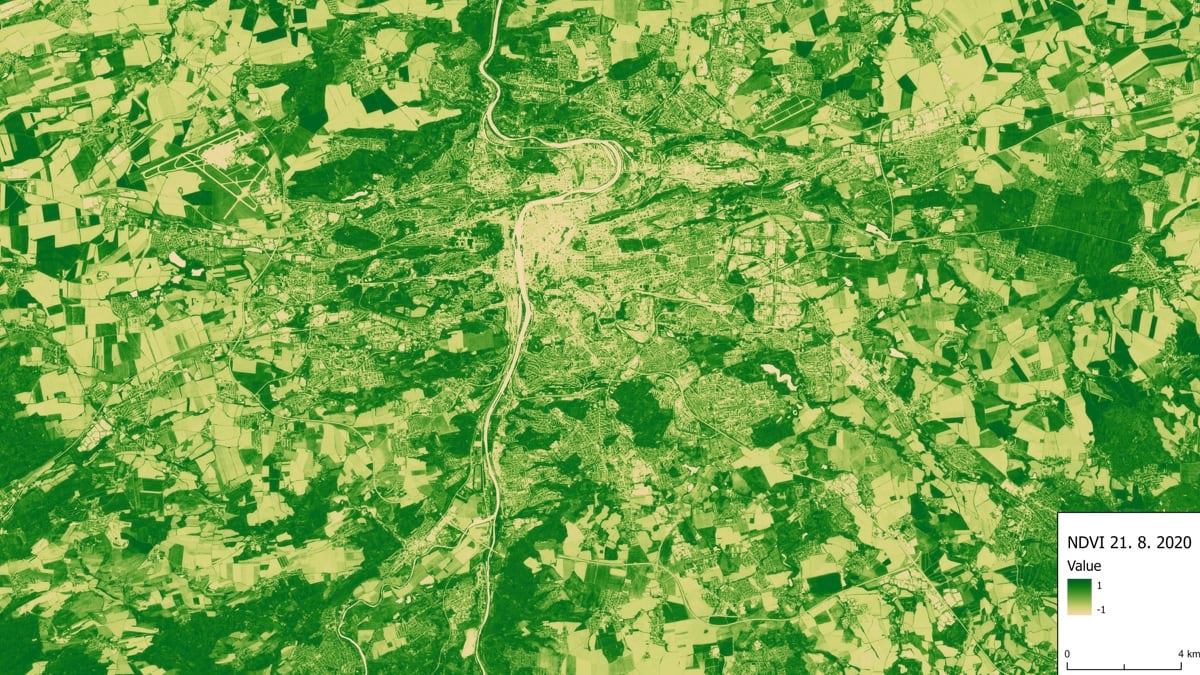
Prague is particularly vulnerable to extreme heat. Compared to other European cities, it has more paved spaces, built-up areas, and industrial infrastructure—the kind of spaces that can create what are called heat islands. But Prague also contains a significant amount of green space and vegetation, the kind of areas that can offer respite from the heat. From a planning perspective, this tapestry of extremes presents a challenge, a puzzle to be solved so that Prague residents are equipped to deal with global warming.
When we think of humanity adapting to climate change, we tend to focus on the precarity of coastal communities dealing with sea-level rise. The truth is that large cities—even those that are landlocked —are on the front lines of climate change adaptation.
The large conglomerations of people and human development exacerbates the effects of rising temperatures. The economic and social diversity of cities means that certain communities feel the effects more than others. The sheer enormity of a city means these effects are themselves diverse, varying widely throughout the city.

For these reasons, cities are increasingly taking proactive approaches to climate change that supersede national policies. In 2018, the Czech government declared that climate change mitigation would be a national priority, a year after Prague released its strategy document.
“For the Czech government, it’s always seemed like more theory than practice,” said Jiří Čtyroký, director of spatial information at IPR Prague. “What Prague is doing fulfills the criteria of the national government, but goes much further. We have an implementation strategy with really ambitious goals, including making Prague completely carbon neutral by 2050.”
Key to this strategy is a commitment to leverage data in a way that helps IPR Prague understand how climate change currently affects Prague, how these effects will evolve over time, and how to best develop the city to meet these challenges.
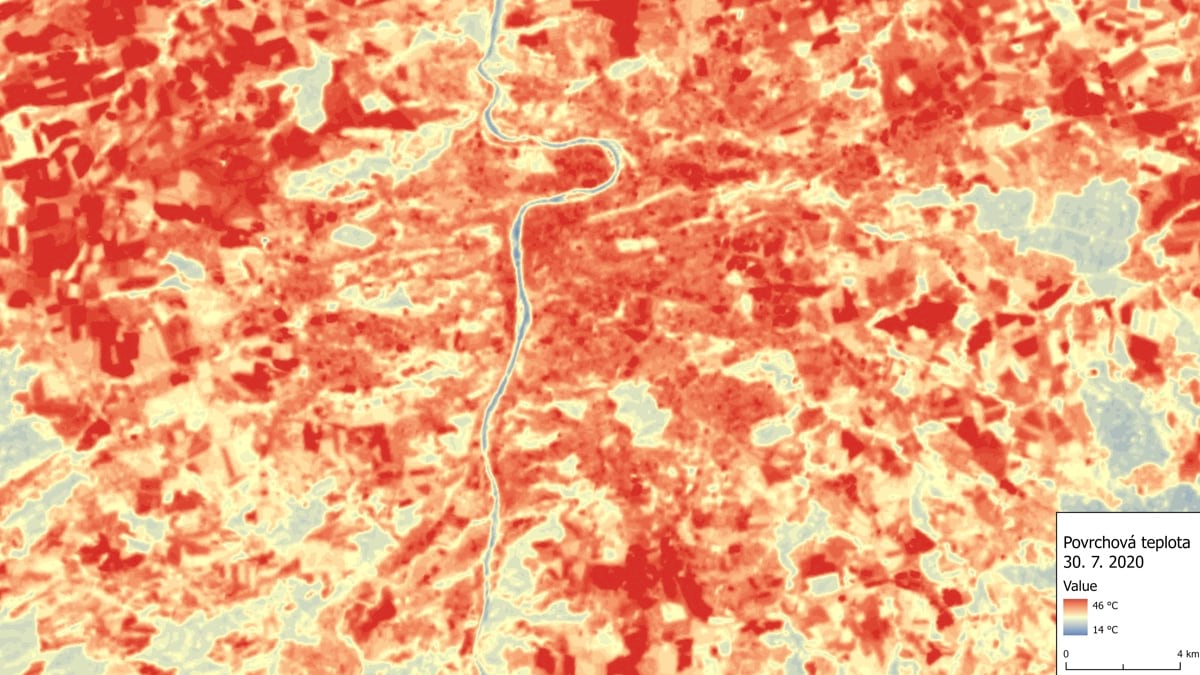
Sensors throughout the city measure variables like temperature fluctuation, solar radiation, and humidity. “There are more droughts, less precipitation, and more tropical temperatures than ever before,” Čtyroký said. “It makes the city streets and public spaces less livable and more stressful for people.”
But which streets and spaces? Which people?
IPR Prague integrates information from the environmental sensors with health and demographic data. For instance, IPR staff can see heavy concentrations of young children and the elderly—two populations at increased risk from high temperatures.
A study that compared the heat waves of 1994 and 2015 found that during the summer of 1994, mortality rates among the elderly increased at about the same rate as younger populations—yet, in 2015, they were significantly higher. The theory behind this shift is that positive socioeconomic changes since 1989’s Velvet Revolution had made those who were aged 64 years and under “less vulnerable to heat stress over time.”
But during the same 21-year period, the country’s over-65 population increased. They were, as a group, still very vulnerable to heat waves, and their greater number counteracted the gains made by younger groups. On balance, they were the reason the total mortality impact of the 2015 heat waves was greater than it had been in 1994.
GIS provides a way to visualize—and therefore contextualize—these statistics. Demographics and other human population data become layers on a smart map. The layers can be set against environmental features of the city, offering graphic representation of how the city and its populations interact.
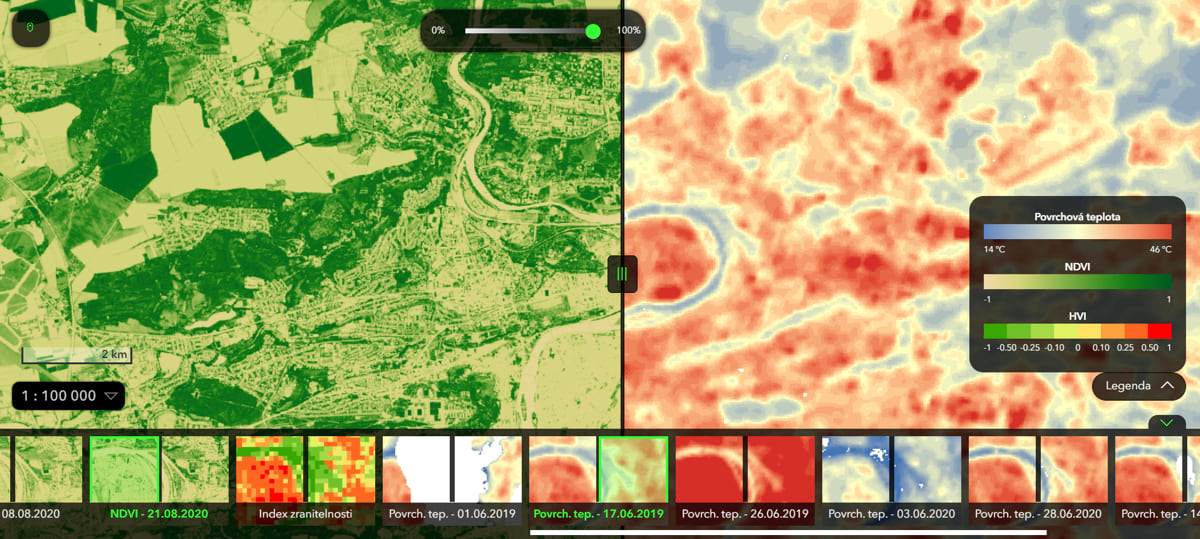
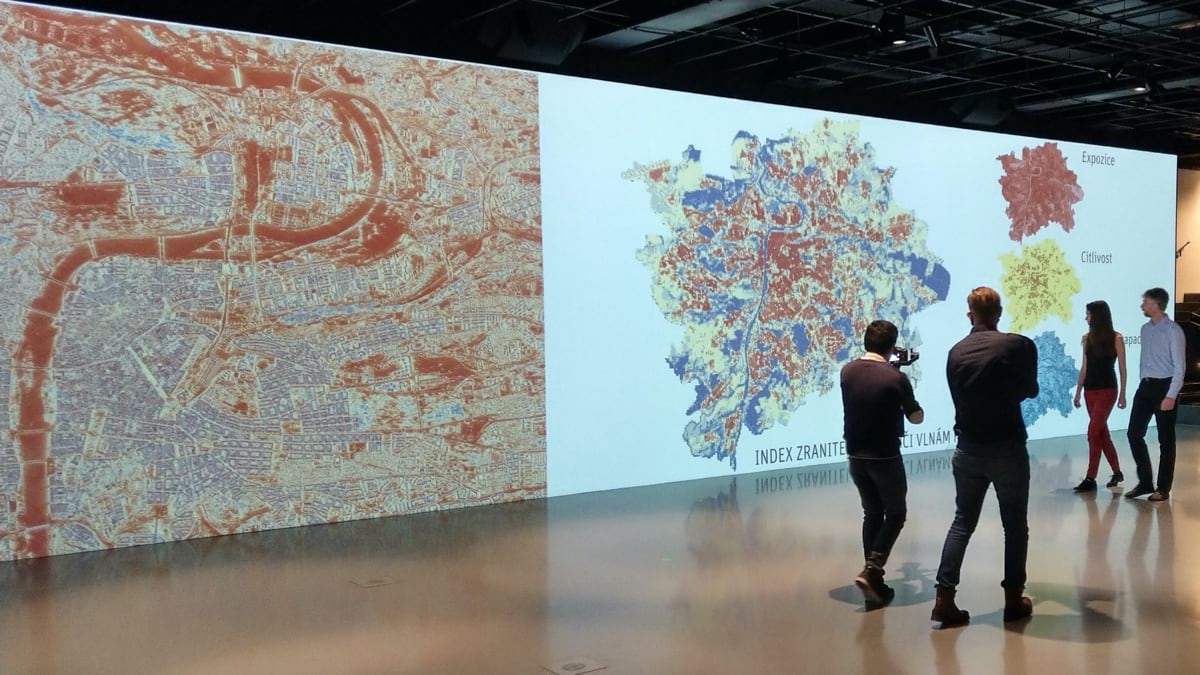
This effort grew out of requests from Prague officials for IPR Prague to devise a way to rate the viability of future projects. “We were asked to develop an aggregated map that showed the best areas to expend effort and money,” Čtyroký said. “That was the beginning of our vulnerability index.”
This index, created by bringing together the various data sources via GIS, helps identify at-risk areas. Čtyroký highlighted Old Town—Prague’s original city center, which dates back to the medieval walled city—on the map. “It’s one of the worst spots in terms of climate,” he said. “It’s a densely built-up quarter, and there’s no wind—just the cobblestone, stone, and asphalt surfaces.” This area could benefit from increased green spaces and tree cover.
“The plan is to update the index every few years to see how the situation has changed,” Čtyroký said. “It won’t be a static thing—and hopefully it will be improving.”
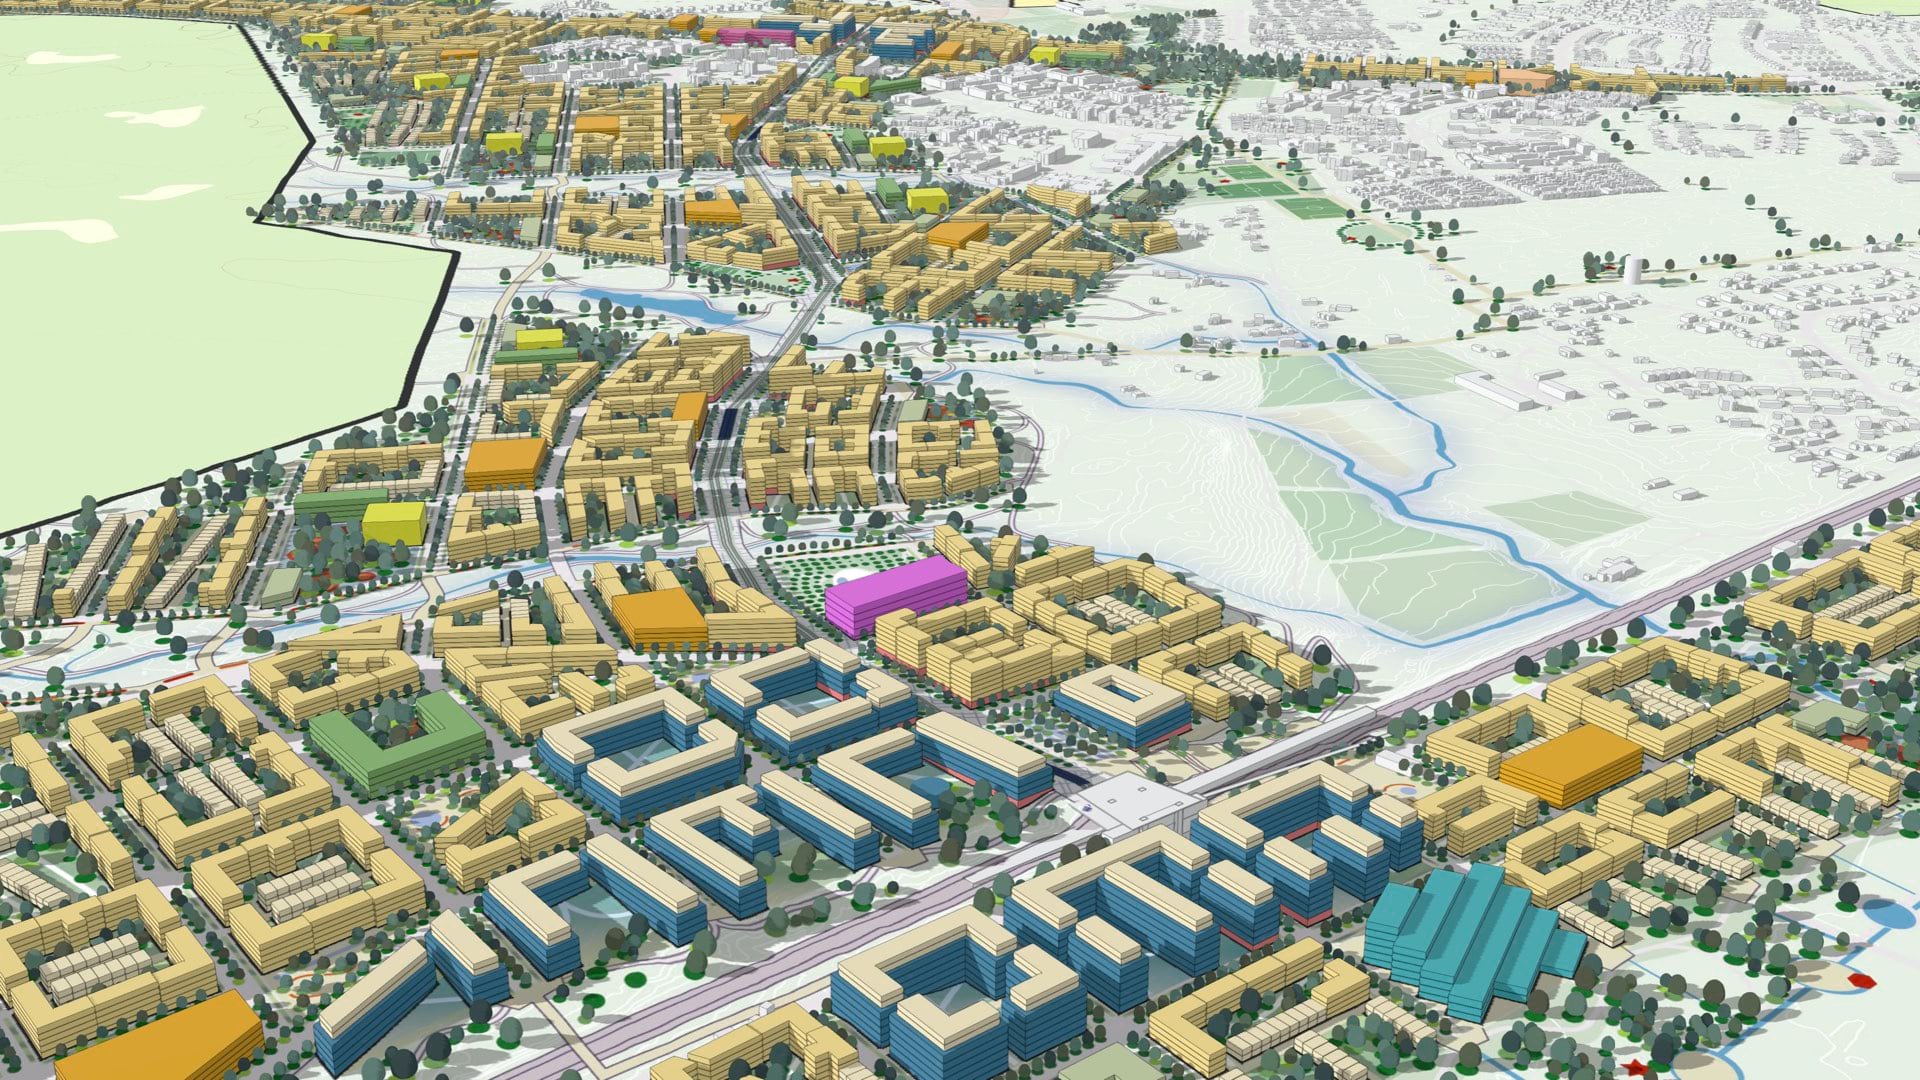
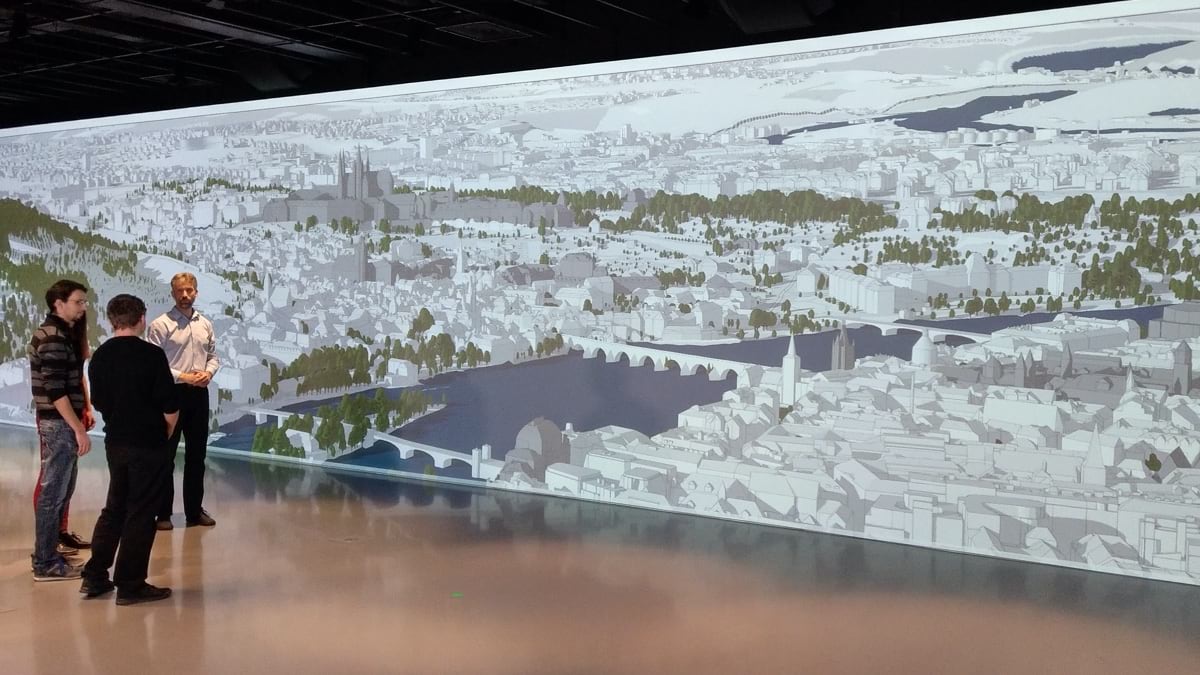
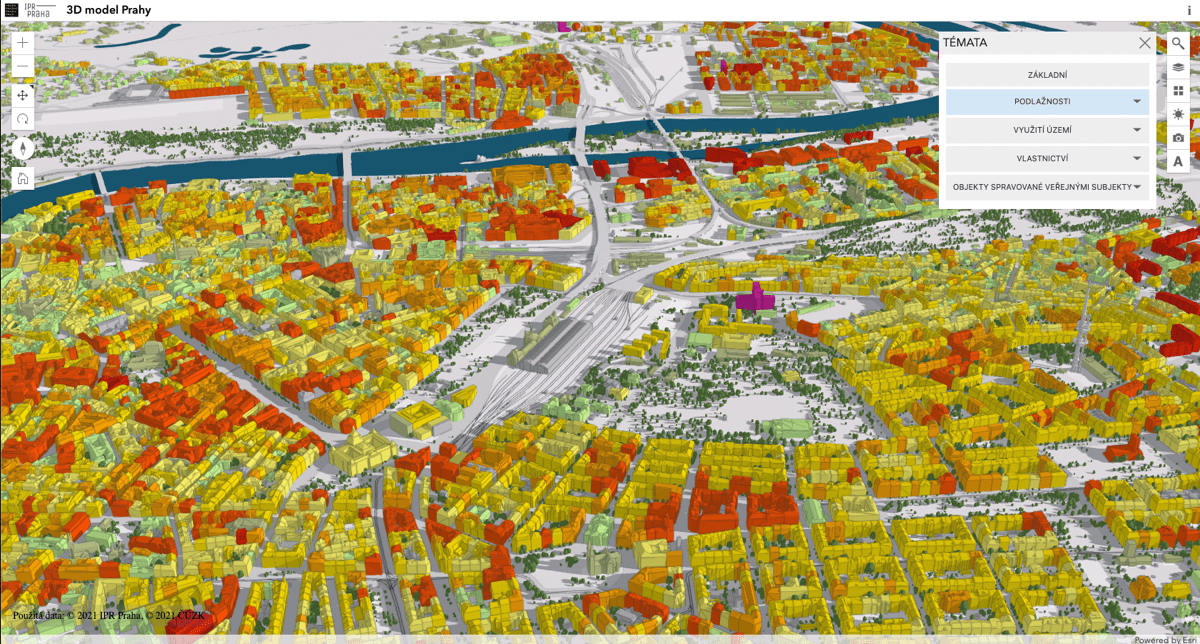
The next phase of Prague’s climate strategy, which IPR Prague hopes to commence this year, will involve using GIS to construct intricate 3D models of the city’s microclimates. Once established, these models will provide a way to analyze the likely effects of mitigation strategies, before the city makes any large investment of time and money.
“We’ll use them to improve our proposals,” Čtyroký said. “For something small, like replanting trees, we won’t bother to model it. But if we’ve got a huge redevelopment project, we’ll want to model it right up to the final stage of the proposal.” These models also provide a way to communicate these plans with other government agencies and the public.
“This is an interesting area,” Čtyroký said, pointing at the map. “It’s basically a 19th century development, an old industrial and residential quarter. And you can see it’s a relatively climatically OK region so far—mostly brick and grass.”
Čtyroký zoomed in for greater detail. “But what’s this?” he asked, pointing at a spot. “It’s one of the biggest brownfields in Prague—an old railway station and warehouse, and they’ll be completely redeveloped into a new quarter for 30,000 people. And that’s exactly the kind of place where we’d want to implement the microclimate modeling, because it’s a place where massive change will occur, and we want to see how it will work.”
The third tier of Prague’s climate strategy will involve adding even more data sources, working in conjunction with the country’s ministry of the environment. “We’ll join our databases related to environmental indicators, and manage it as one big project.”
As the data flow increases, the GIS-enabled map of Prague will become more complex with a multiplicity of applications. Looking toward Prague’s carbon-neutral future, city officials are discussing with IPR Prague the possibility of rooftop photovoltaic and wind-power generation.
IPR Prague is also exploring becoming involved with a project already under way to study energy consumption in municipal buildings. In effect, this would mean expanding the map to include and model indoor spaces.
“We’d like to figure out how to combine information that we know about surface temperatures, weather, and heat waves, and discover how these relate to energy consumption in the buildings,” Čtyroký said. “If you improve the situation in the streets, what effect does it have on cooling the interior of buildings? Right now, that’s just in the research stage. But that’s the way we’re thinking.”
Learn more about how meteorologists, climatologists, and GIS practitioners are increasingly integrating weather and climate data into their GIS workflows, combining this information with other data to analyze the impact to populations, infrastructure, and ecosystems.