
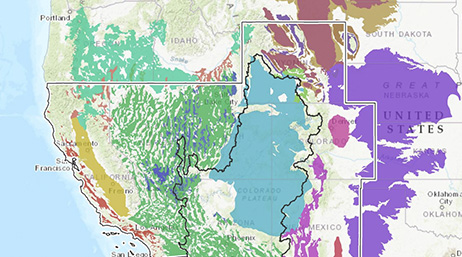
USGS Topographic Mapping in ArcGIS Pro
ArcGIS Online
US Geological Survey (USGS) and Esri collaborated to bring the US historical topographic maps to everyone.
Explore resources for science agencies and connect with industry experts
Explore the planet's lands and waters through interactive stories by government agencies, educators, students, and nonprofit organizations.
USGS Topographic Mapping in ArcGIS Pro
ArcGIS Online
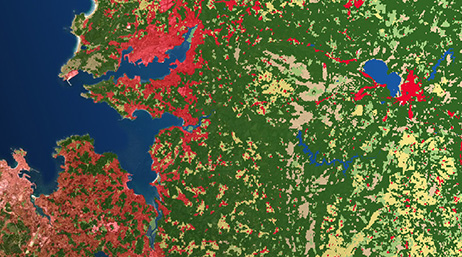
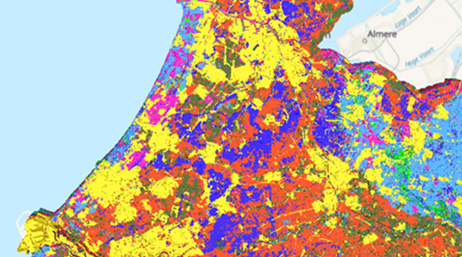
Esri 10-Meter Land Cover
WEBINAR
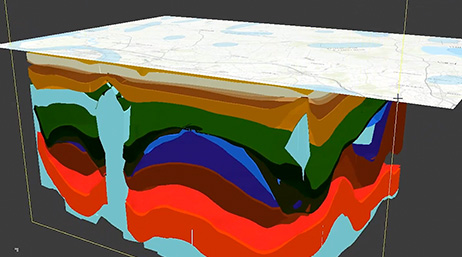
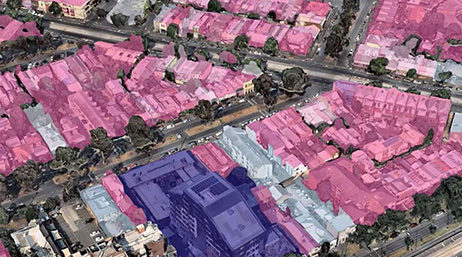
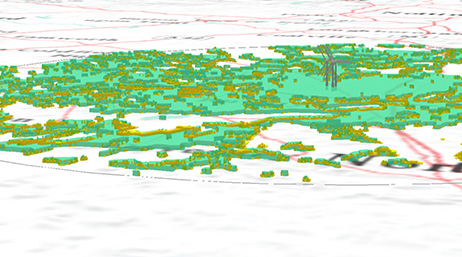
Slicing through Complex Geology with ArcGIS Pro
VIDEO
Animate geologic data with voxels
Tutorials
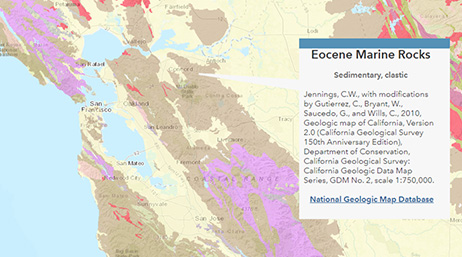
State Geologic Map Compilation
WEBINAR
Steps to a net zero future
WHERENEXT
Introduction to Development Impact Analysis
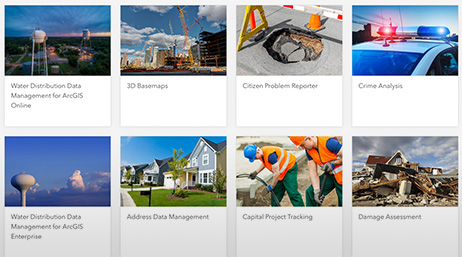
ArcGIS Solutions
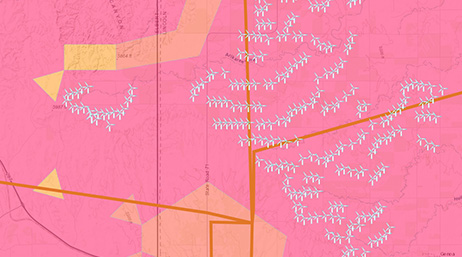
Wind farm suitability analysis
Tutorials
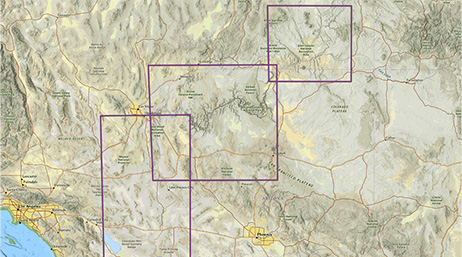
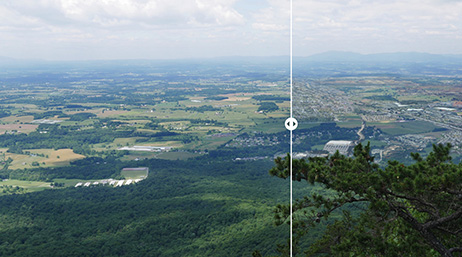
I can see for miles and miles
Tutorials
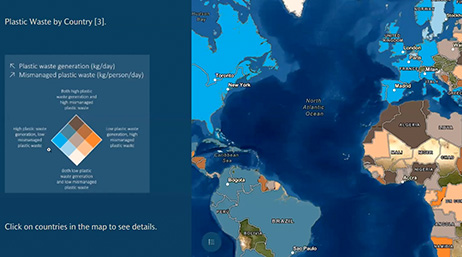
Addressing ocean plastic pollution
Esri Video
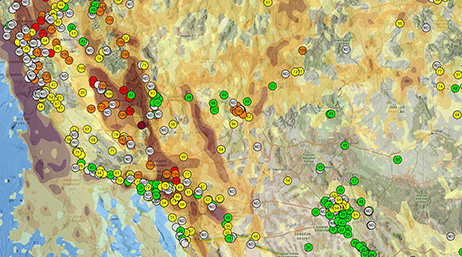
Air Quality Aware
ArcGIS Living Atlas of the World
Air quality and human impact
ArcGIS Blog

Drone and AI for environmental monitoring
GIS for Science
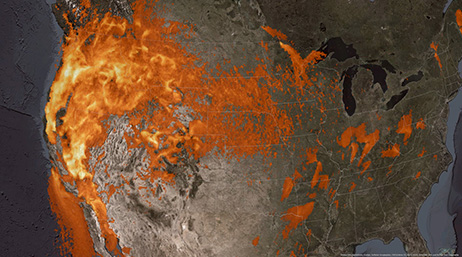
Map smoke and air quality
ArcGIS Online
Nineteen years of global air quality
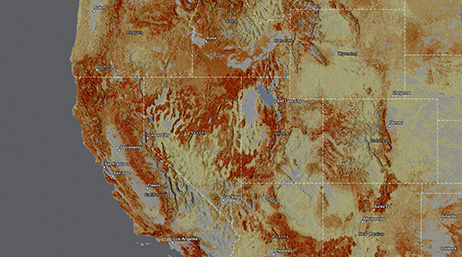
ArcGIS Living Atlas of the World

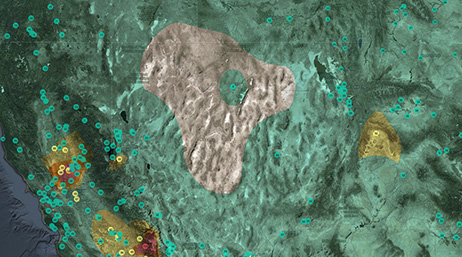
Track US drought conditions
ArcGIS Blog
Addressing the climate crisis
ArcGIS StoryMaps

Hazards prompt insurers to rethink risk
WHERENEXT

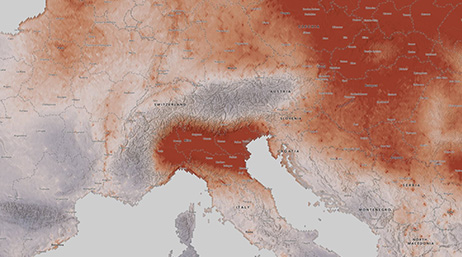
Extreme Heat Events in a Changing Climate
WHERENEXT
From Commitment to Action
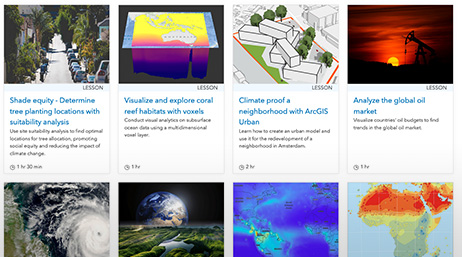
GIS learn lessons in climate science
Lesson Gallery
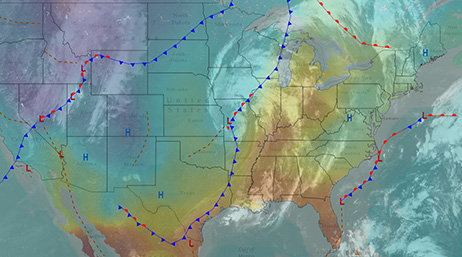
NWS SAFER Hazard Dashboard
Predict weather with real-time data
Tutorials
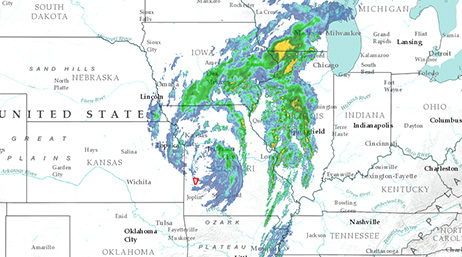
Weather and Climate Data Dissemination
VIDEO
National Weather Service GIS
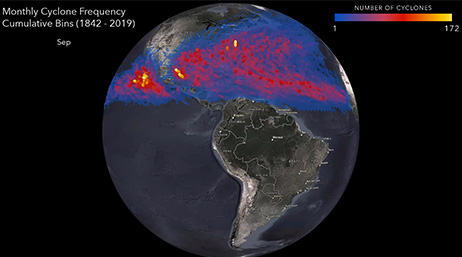
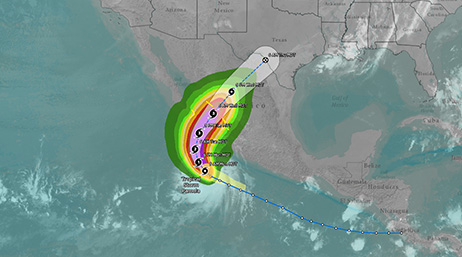
Earth's Biggest Storms: Tropical Cyclones
ArcGIS StoryMaps
GIS weather training
Lesson Gallery
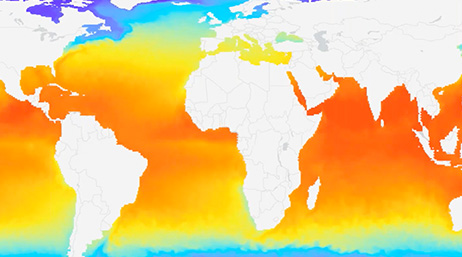
Improving Our Coastal Ocean
ArcGIS StoryMaps
Mapping the Ocean Floor
ArcGIS StoryMaps
Learning more with water column sonar data
ArcGIS StoryMaps

Oil Spill Assessment for Marine Mammals
ArcGIS StoryMaps

Restoring Coastal Marine Habitats
GIS for Science
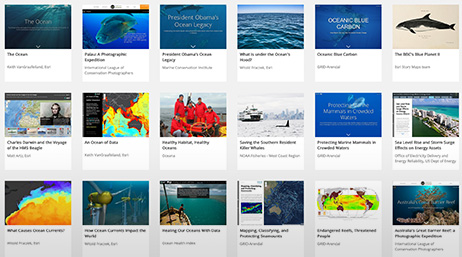
An Ocean of Story Maps
ArcGIS StoryMaps
Contribute your success stories and tell others about GIS technology solutions.
Join the geospatial conversation with others in the global community of Esri users. Find solutions, ask questions, share ideas, browse the forums, or collaborate to solve problems by using GIS.

Stay current with the latest modernization trends, technology, and information. Attend an informative webinar or speak to one of our science industry experts at an event.

Instructor-led and self-paced options help individuals apply best practices and quickly learn ArcGIS software. Esri training consultants provide complimentary planning services to identify opportunities that best meet an organization's immediate, short-term, and long-term workforce training needs.

Speak with a representative.