Transit-Oriented Planning

Unify data, visualization, and analytics with location-aware transit planning software

A map of a large transit network overlaid with an image of a moving blue bus

Plan transit systems that move communities forward

ArcGIS helps planners quickly see travel patterns, service gaps, and accessibility needs by combining demographics, ridership, and land-use data in one map. Use transit visualizations to test scenarios, refine route planning, and share clear, data‑driven plans with stakeholders to guide smarter investments and deliver future‑ready transit service.

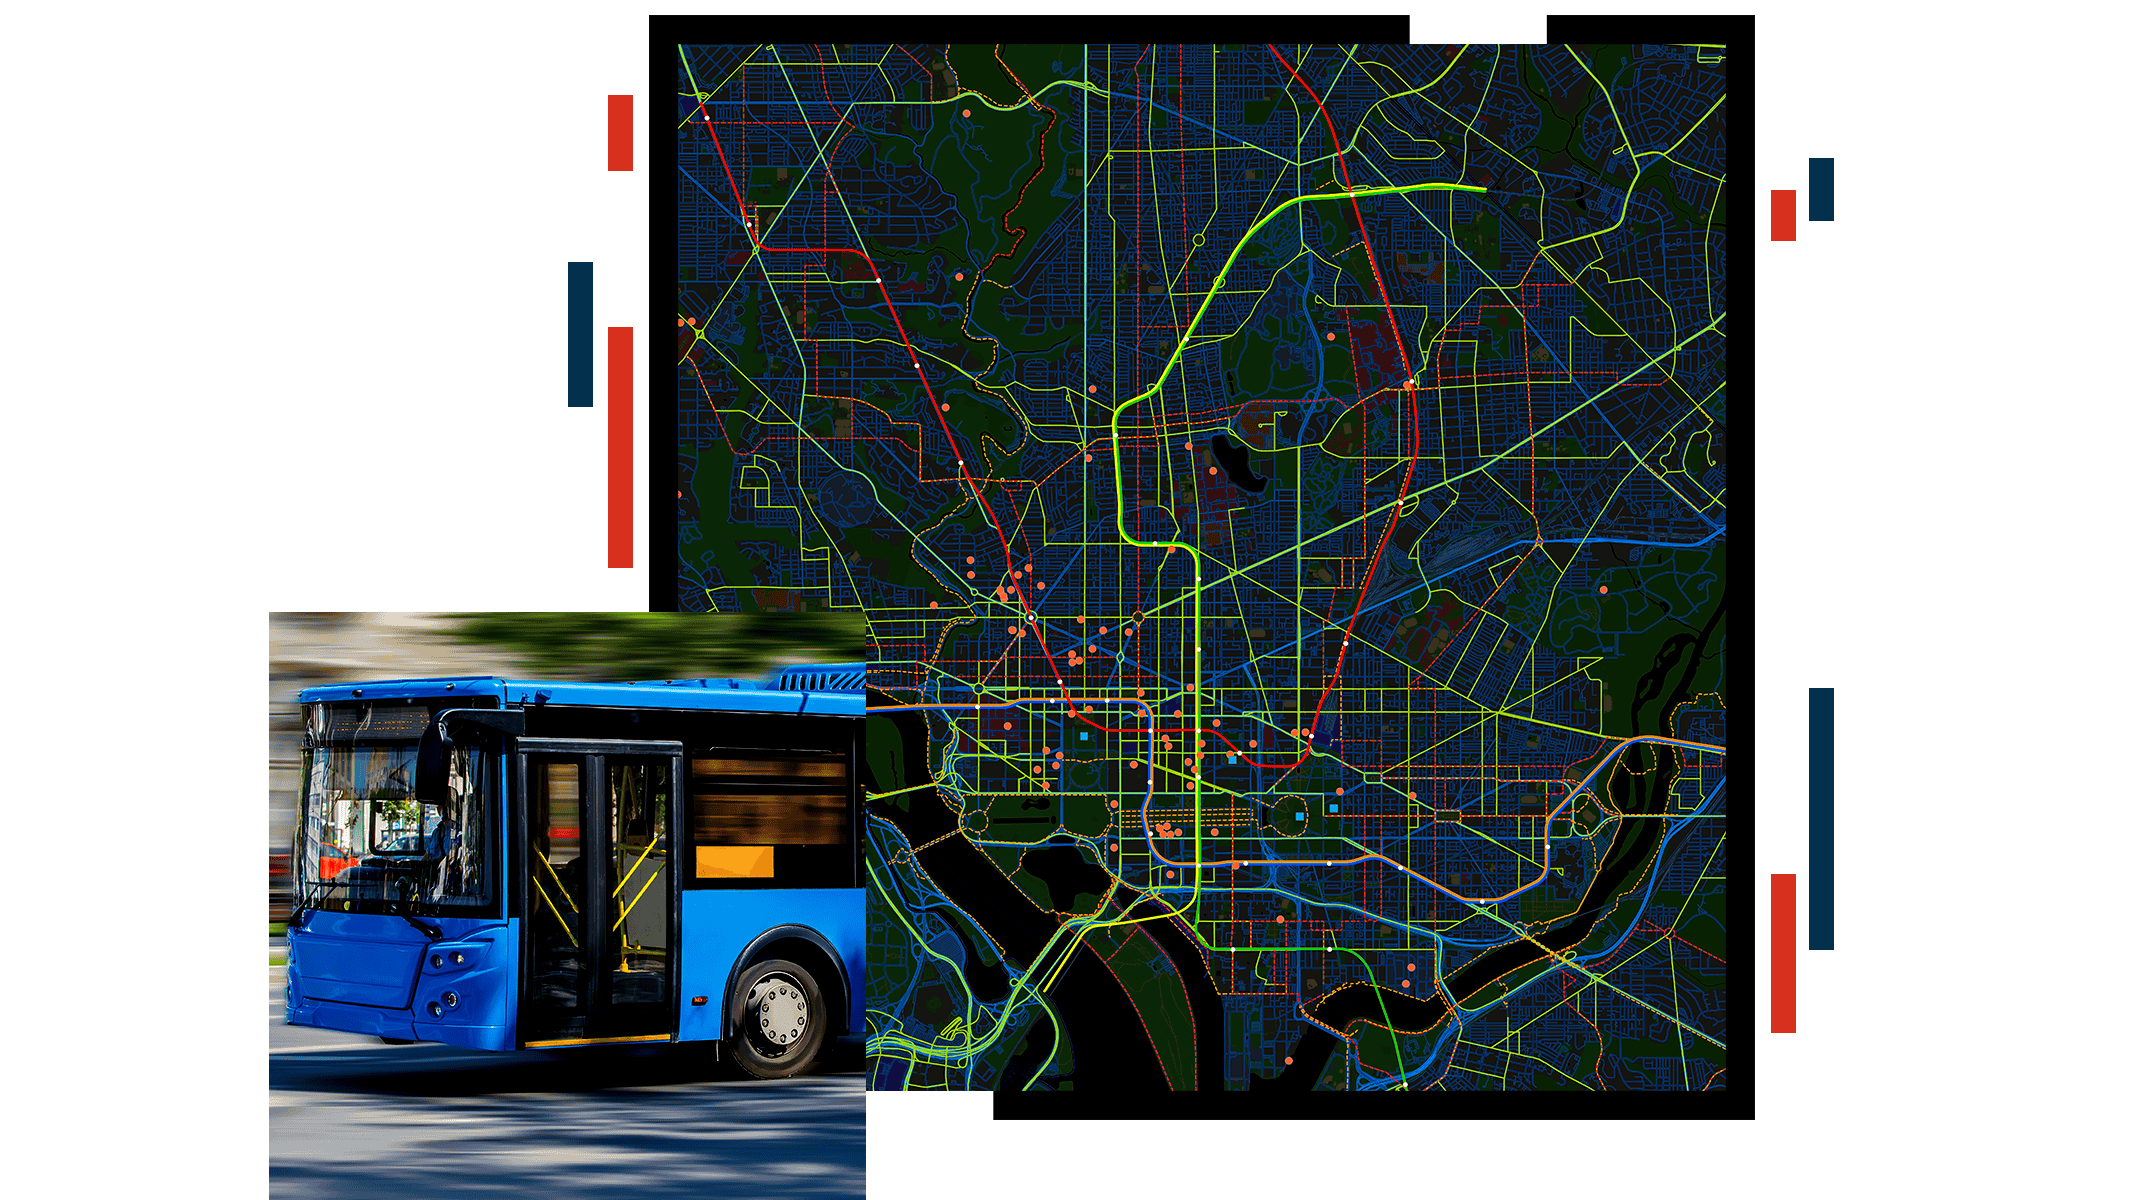
Understand origin-destination patterns by integrating disparate data

Combine ridership, demographic, General Transit Feed Specification (GTFS), and land‑use data on a map to see where riders travel.

ArcGIS helps planners visualize how people move through transit systems, highlighting high‑demand corridors and revealing where trips begin and end. With transit analytics, you can compare trends over time and make smarter decisions about route planning and corridor investments.

A dark-themed map showing dense city street networks, a river, and highlighted routes in red, pink, and blue across the urban area

Assess walksheds, transit connections, and ADA considerations

With ArcGIS, planners can identify which neighborhoods lack convenient bus stops, light rail routes, or other public transit.

Insights about accessibility—especially for people with disabilities—guide improvements that strengthen compliance with the Americans with Disabilities Act (ADA) and help ensure service reaches the people who rely on it most.

An interface from ArcGIS Dashboards displaying a map and images of ADA-compliant bus stops

Analyze impacts on travel times, coverage, and system reliability

Strategically plan new fixed‑route systems or network adjustments by evaluating population forecasts, congestion data, travel demand, and origin-destination insights side by side.

Dashboards and transit analytics support strong service expansion funding proposals by providing clear, defensible evidence for expansion decisions.

An interface from ArcGIS Dashboards displaying a map of transit stops surrounded by graphs

Align land use with transit investments

Scenario modeling tools in ArcGIS help planners test how changes in the built environment influence transit ridership, access to jobs, and transportation system performance.

With transit planning software, you can visualize transit-oriented development proposals in 3D and share web maps with regional departments and community partners, strengthening collaboration on future growth.

A map of intersecting streets dotted with pink, blue, and purple spots

USER STORY

Maryland prioritizes transit-oriented development

Maryland Department of Planning helps communities make informed decisions that build strong economies, vibrant neighborhoods, and mobility for all.

Read the story

Products for transit-oriented planning

Use transit planning software to understand travel patterns, identify service gaps, and support data‑driven transit plans that move communities forward.

Previous
Next

Contact Sales

Please share your information and our sales team will contact you soon. We look forward to communicating with you.