Transit Operations

Manage service, monitor performance, and keep riders moving with transit scheduling software

A heat map displaying stops along transit lines in a large network overlaid with an images of a modern commuter train

Integrate real‑time transit operations

ArcGIS combines data from vehicles, automatic vehicle location (AVL) systems, and field crews, helping transit agencies protect on‑time performance, reduce wait times, and adjust service as conditions change. Dynamic dashboards and maps help operations teams make data‑driven decisions that improve service reliability and keep public transportation running smoothly.

Unify feeds to manage service proactively

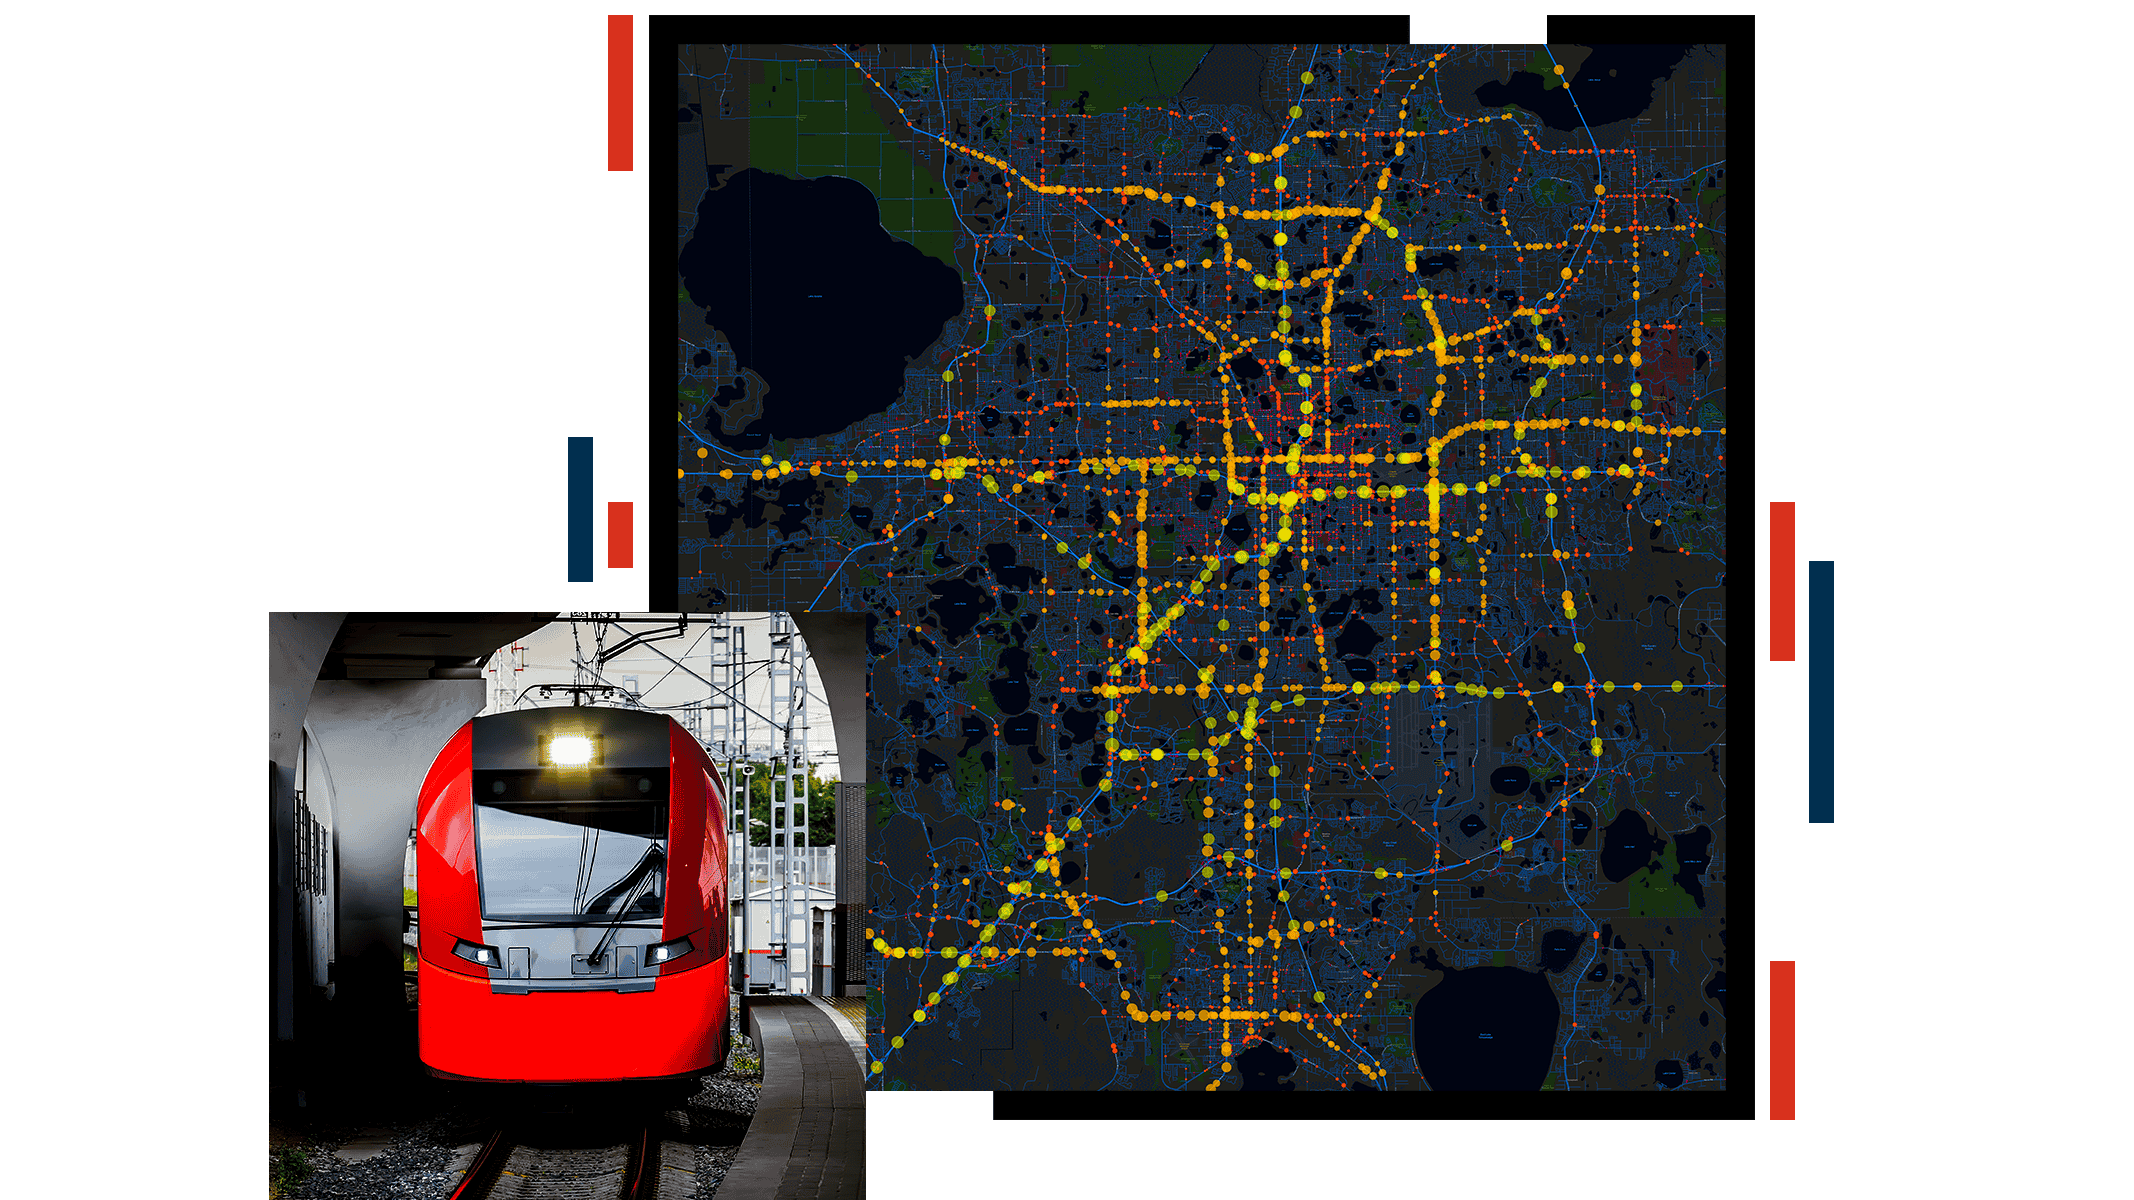
Combine vehicle telemetry, AVL system data, incident reports, and field updates in one operational view to keep transit service steady.

Live maps and dashboards surface bottlenecks, detours, and headway issues across fixed‑route bus operations and rail. With alerts, dispatchers and management centers can intervene early—protecting service reliability and boosting transit on‑time performance.

The interface of the Transit On-Time Solution deployed in ArcGIS Dashboards with a map of a transit network surrounded by performance metrics

Use route‑level analytics to adjust schedules amidst congestion

Trend on‑time performance by line, trip, or time of day; map hot spots for delays and missed trips; and overlay automated passenger counter (APC) and GTFS data to see when and where ridership surges.

These insights guide targeted fixes—signal priority corridors, stop consolidation, and crew changes—that promote a high-performing transit system.

The interface of the Transit On-Time Solution deployed in ArcGIS Dashboards with a map surrounded by performance metrics

Model proposed trips and obstacles against live conditions

Pair spatial analysis with transit scheduling tools to plan precise interventions by comparing options on coverage, travel time, and fleet management. Then, translate changes into real‑time passenger information.

A single operational picture shortens review cycles and supports faster, data‑driven service planning during incidents, events, or seasonal demand shifts.

An ArcGIS Dashboards interface displaying a map surrounded by safety, routing, and schedule metrics

Geo‑enrich service data with authoritative demographics

Esri provides lifestyle attributes to help you find untapped markets and improve access. Identify communities most likely to ride, align transit service with work‑ and school‑based travel, and prioritize corridors where new frequency or span will perform best.

These data‑driven insights inform outreach, wayfinding, and marketing—helping agencies run efficient routes that attract new riders.

A map of Los Angeles County with some regions highlighted in greens and blues surrounded by menu panels

Case study

Creating a better experience for 17 million riders

The Central Florida Regional Transportation Authority uses GIS to monitor vehicle locations, assess routes, and communicate changes with the public.

Read the case study

Products and solutions for transit operations

Use transit operations software to identify service gaps and support data‑driven transit plans that move communities forward.

Previous
Next

Contact sales