Clemson Turns 70,000 Drone Images into a Photorealistic Digital Campus
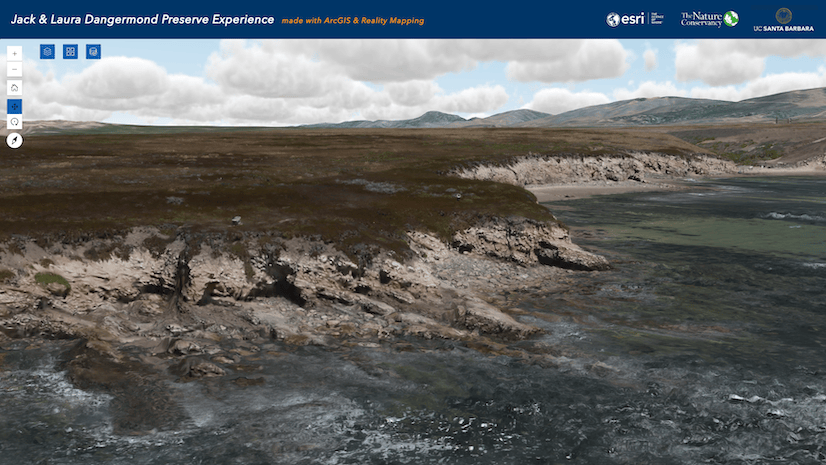
An interactive 3D scene of Memorial Stadium made with Gaussian splatting helps the school inspect facilities and better plan construction.
October 2026
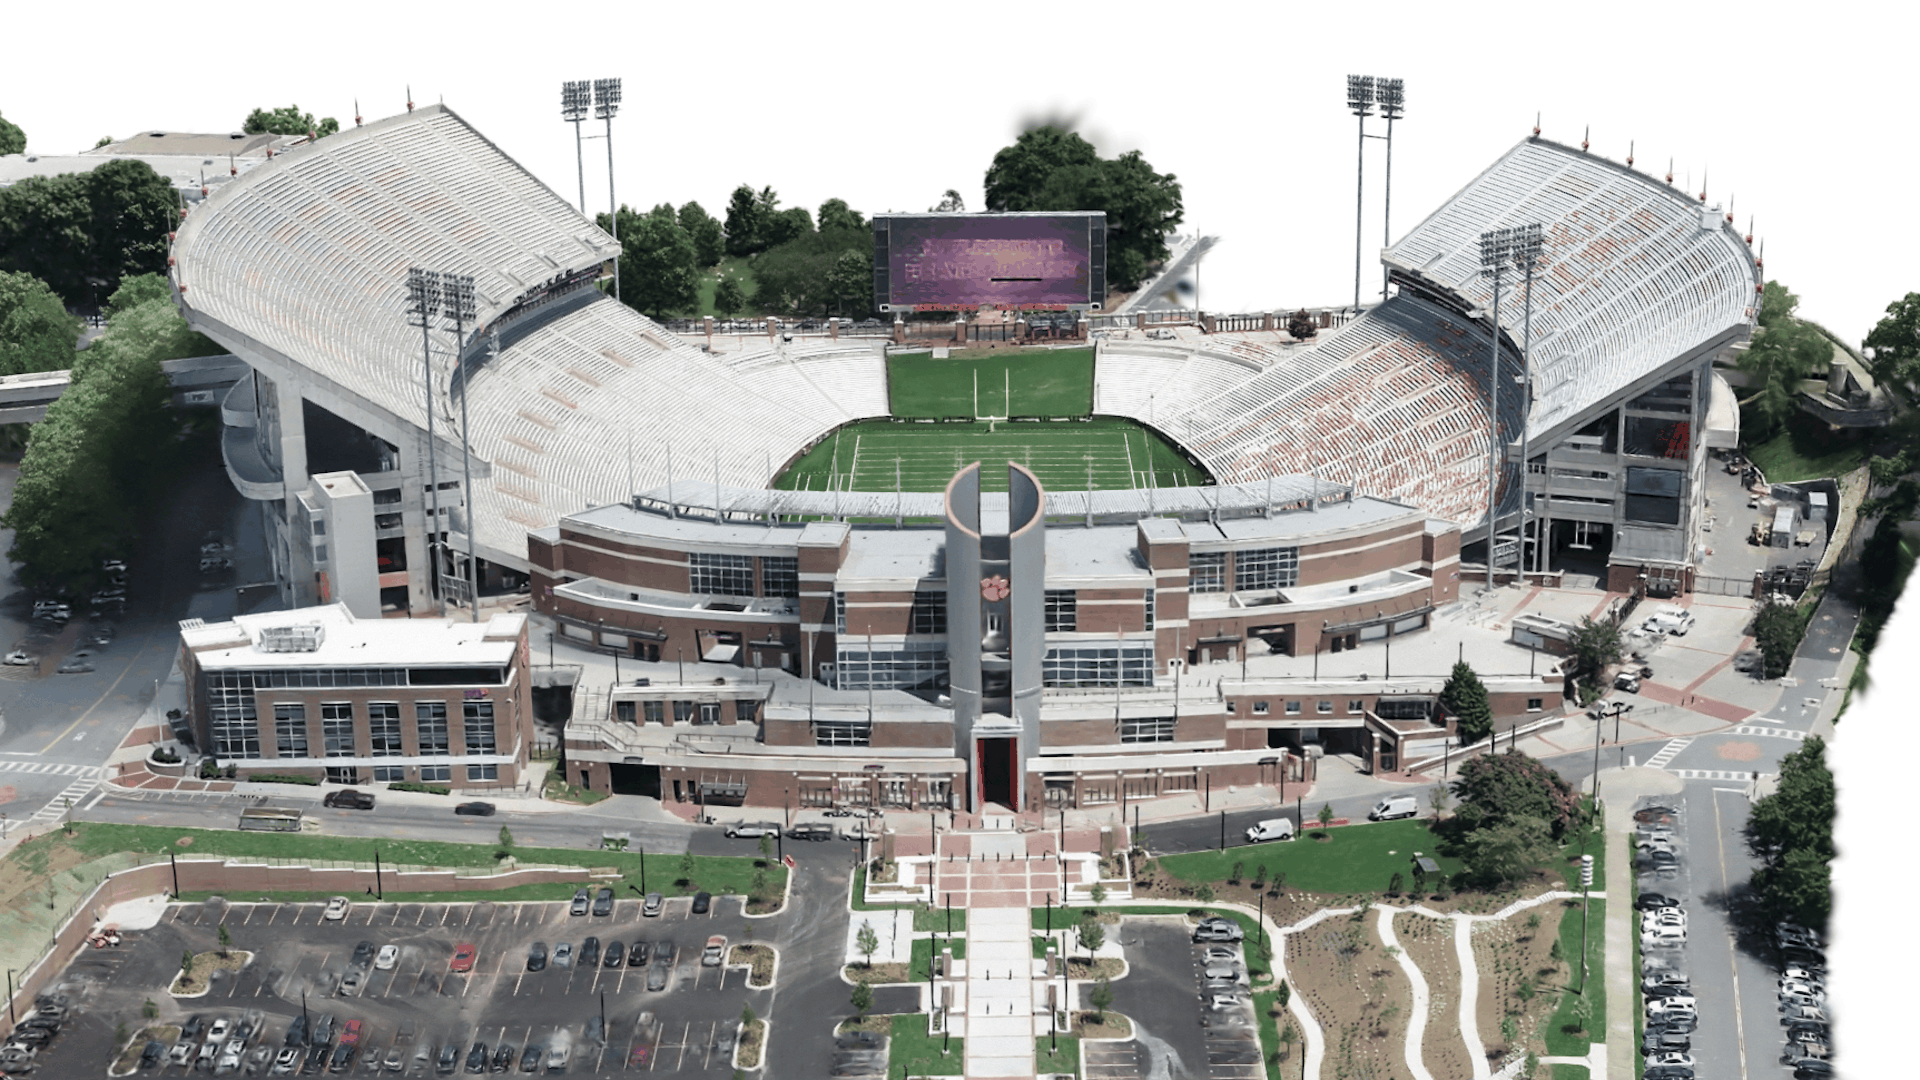
An interactive 3D scene of Memorial Stadium made with Gaussian splatting helps the school inspect facilities and better plan construction.
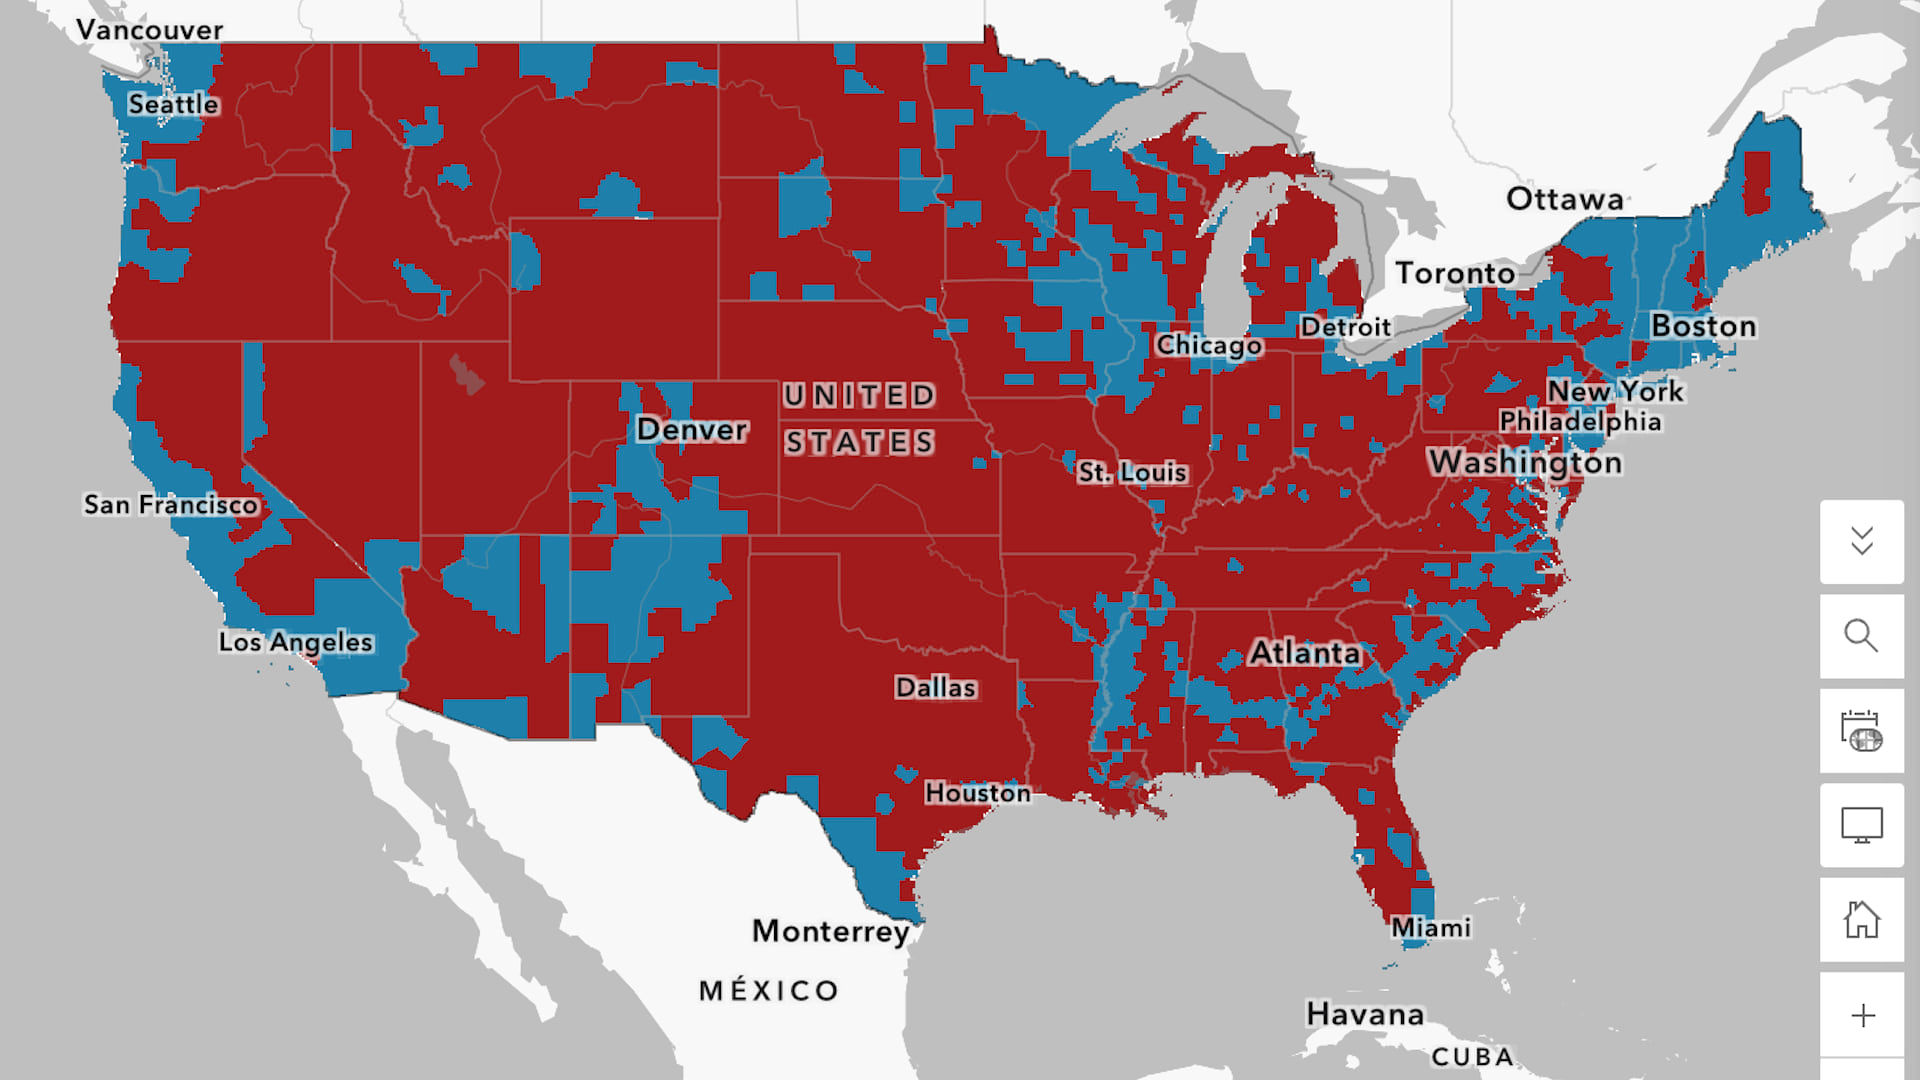
Election maps can show more than who won and who lost. Learn to build your own web map to visualize voting patterns around the US.
Do you like building systems and reducing risk? Learn how to get started in a vital industry that protects communities.
Discover why utilities are turning to these geospatial-powered models to more effectively manage assets, operations, and networks.
Officials in New Hanover County are collecting data to improve distribution via pantries and mobile food trucks.
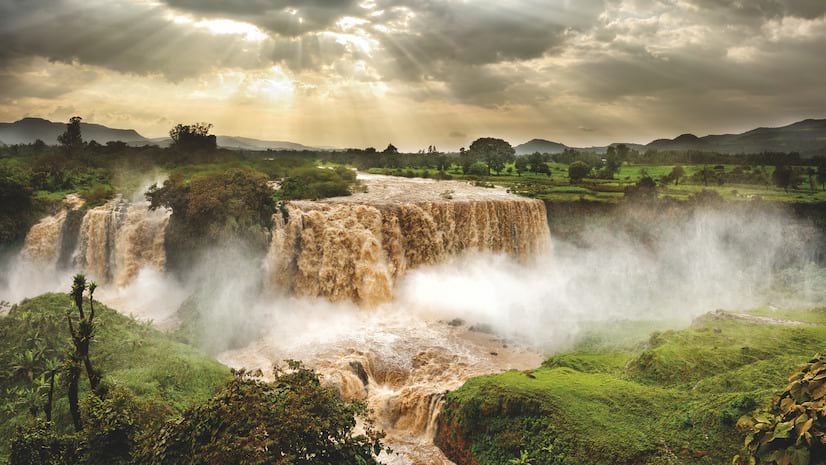
Explore stories of how we use data, science, and location to better understand and manage one of Earth’s primary resources.
This new extension provides measure-based data management capabilities to create, analyze, and share route and event data.
Join urban forestry leaders, practitioners, and community champions to share practical strategies for developing greener cities.
Learn three ways to include apps in your ArcGIS Hub site for a seamless user experience.
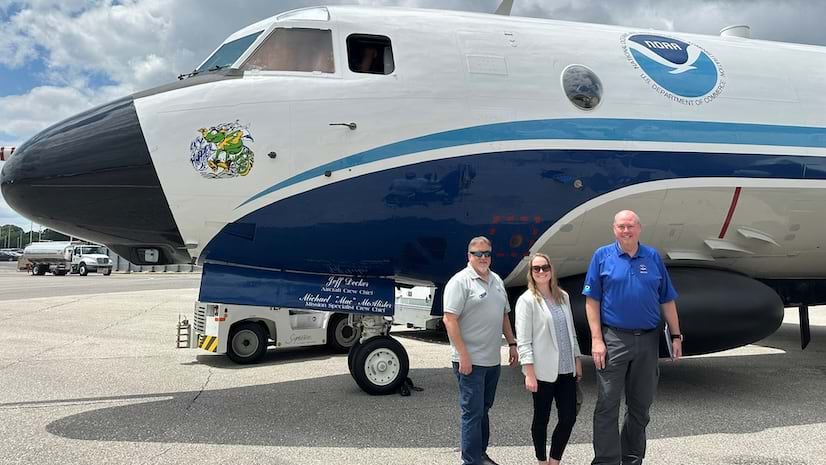
Use the ArcGIS Velocity Migration Tool to generate a custom transition guide and get resources tailored to your deployment.
Two complementary approaches—pre-trained foundation models and a toolset for classifying imagery—can help identify features of interest.
Moving from a central GIS model to a “spatial as a service” approach allows transport agency staff to access geospatial data when they need it.
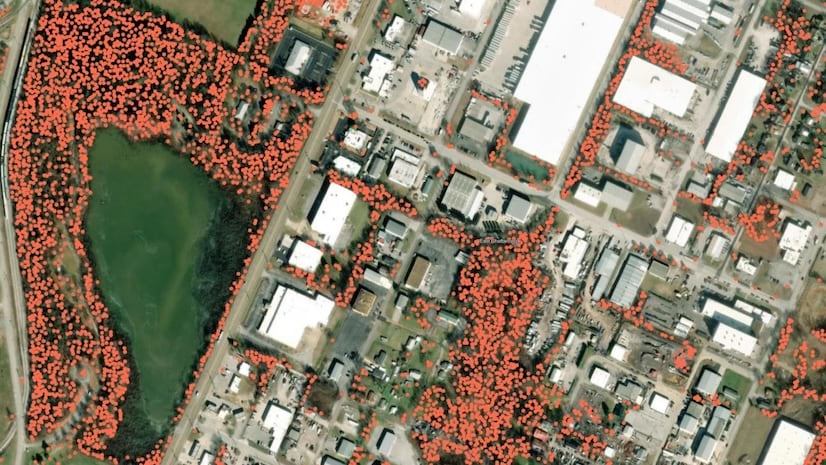
Deep learning models and visuals help officials see where tree canopy has been lost and where restoration efforts will have the most impact.
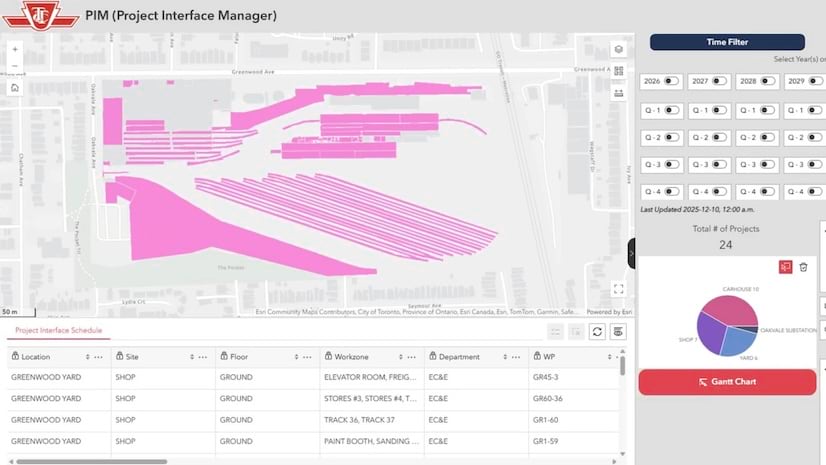
A project management system integrated with GIS changes fragmented project coordination processes into a centralized, data-driven workflow.
Join this live seminar to explore the latest product features and learn the steps to design a data collection form with Survey123 Studio.
Transform pixels into information. Explore common imagery applications and workflows to create and process derived raster products.
Practice key cartographic techniques to depict 2D and 3D data on a map and communicate insights with charts and dashboards.