
The brightest spot on New Hanover County’s food insecurity map sat directly over the university, an unexpected place to find so much hunger.
Linda Thompson, the county’s chief civic engagement officer, and Tyler Lockamy, its senior GIS solutions engineer, built the map years ago and have kept adding to it ever since, through the end of pandemic-era SNAP benefit boosts and, more recently, a federal SNAP freeze that hit more than 23,000 residents across the county. Thompson brings the urgency of feeding residents struggling with rising costs of food and the relationships with local food assistance programs. Lockamy brings the layers: poverty data pulled down to the census tract, cross-referenced against grocery store locations, bus routes, and housing. “Seeing the data on a map takes gender, race, and even politics out of the issue,” Thompson said. “It allows us to see our communities as just humans in need.”
That combination is what turned up the cluster near the University of North Carolina, Wilmington (UNCW). “We kept trying to figure out what that big spot was,” Thompson said. The data was built on income, and income data alone didn’t explain a university sitting inside a food desert, a pocket where low-income households sit too far from a grocery store, until someone called the campus and learned that students were sleeping in cars. “College students are broke,” Thompson said. Financial aid hasn’t kept pace with off-campus housing costs, and students were showing up hungry.
UNCW hosts a pantry on campus called Hawk’s Harvest, named for the school’s Seahawk mascot, operating out of two locations where students shop the way they would at any grocery store. Separately, the university’s marine science program runs an aquaculture fish farm to train undergraduates for this growing industry, and the program delivers fresh fish to a local seafood market. Thompson called it one of the more unexpected fixes she’s seen. “People are really starting to think out of the box about how we’re going to feed our community,” she said.
-
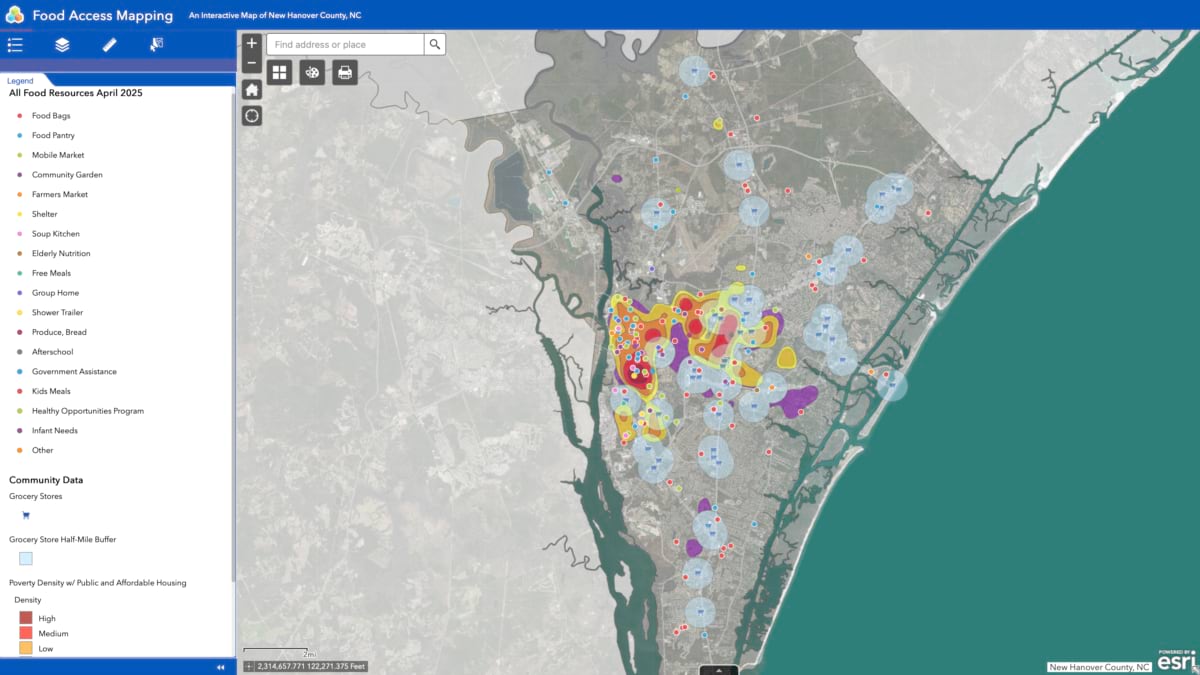
Tyler Lockamy created the Food Access Mapping tool to overlay poverty density and grocery store walking distance to map food deserts across all of New Hanover County, North Carolina.
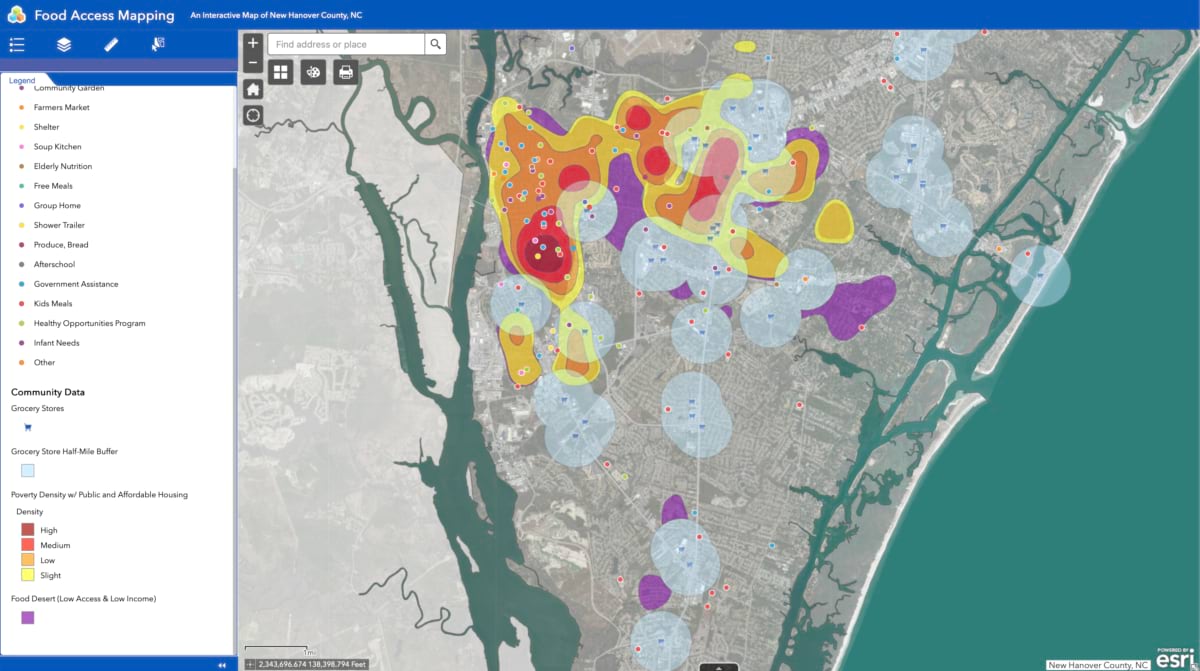
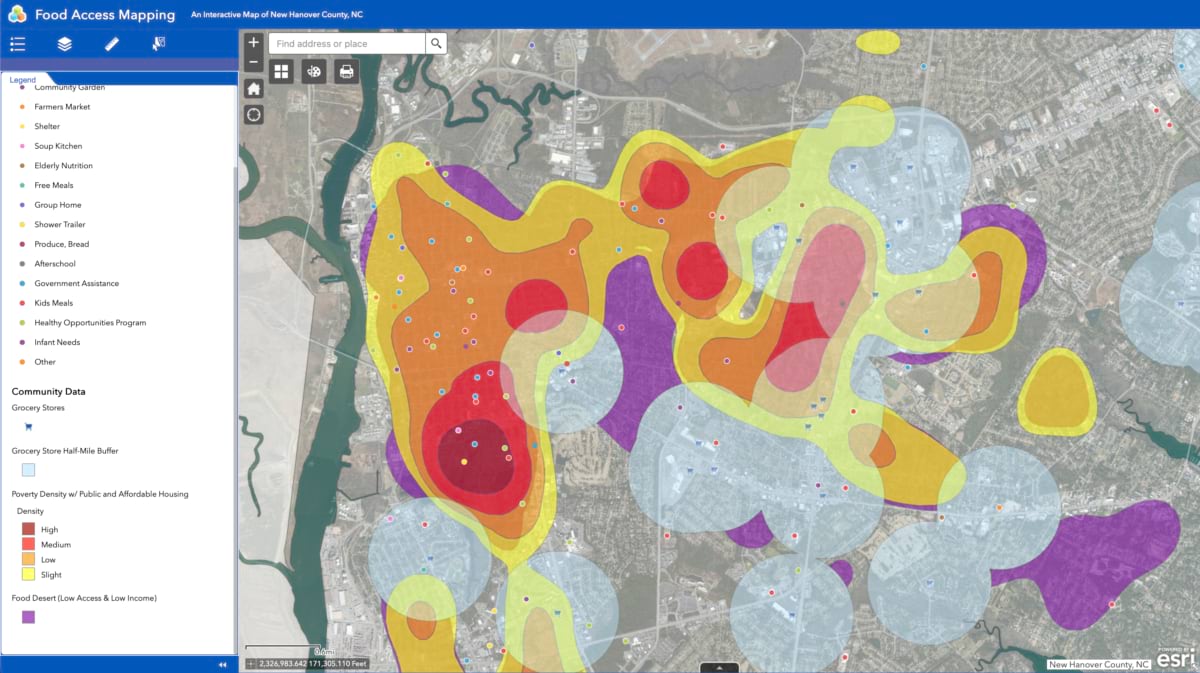
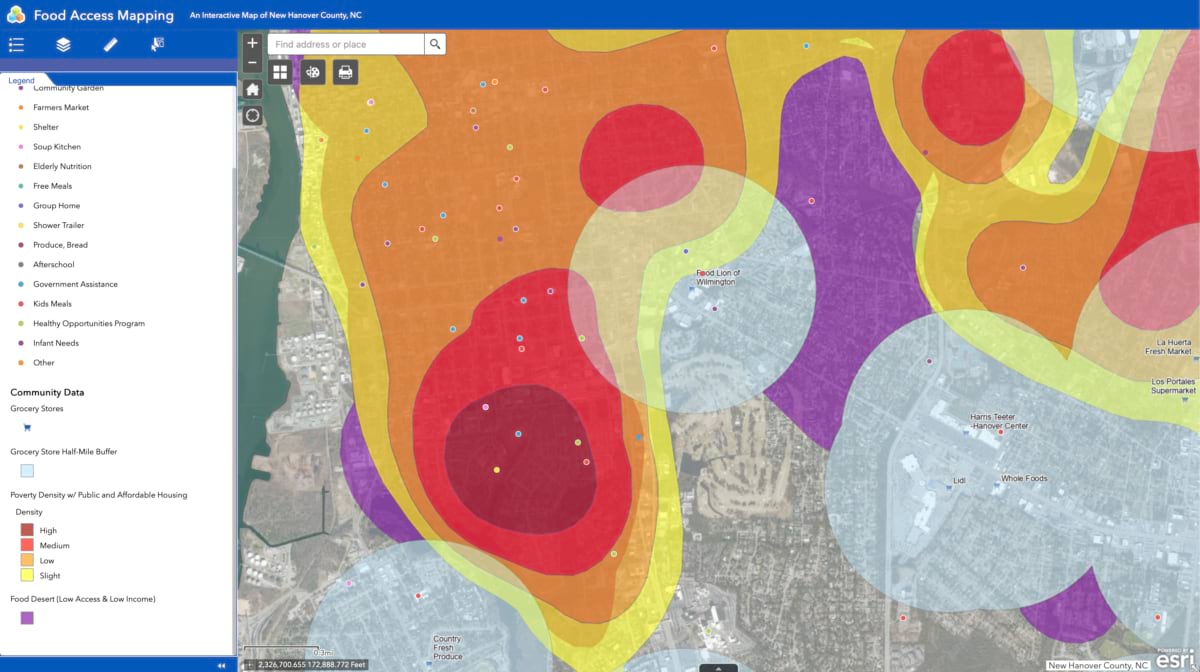
Thompson has carried the map into rooms far outside New Hanover County, watching it change the conversation every time. Presenting to a group of officials from another county, she pulled it up and pointed to what the color-coded zones meant. “You saw their eyes,” she said. “Nobody walked out of the room.” Officials who assumed their own communities were fine started pointing to neighborhoods they knew personally, asking why food programs clustered in the same few blocks while entire sections of the map lacked a food pantry.
The county brought that same map to their regional food council. Two years later, seven new food distribution sites have opened. Five of them landed in areas the map had flagged as food deserts.
Serving Themselves, Locally
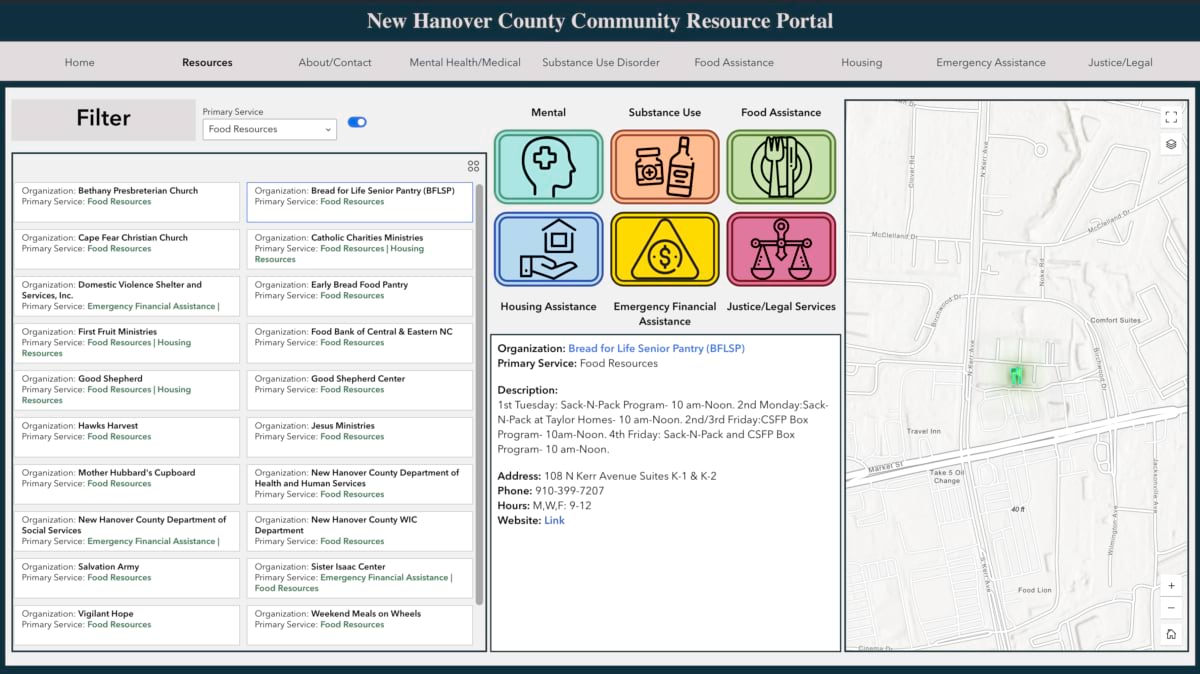
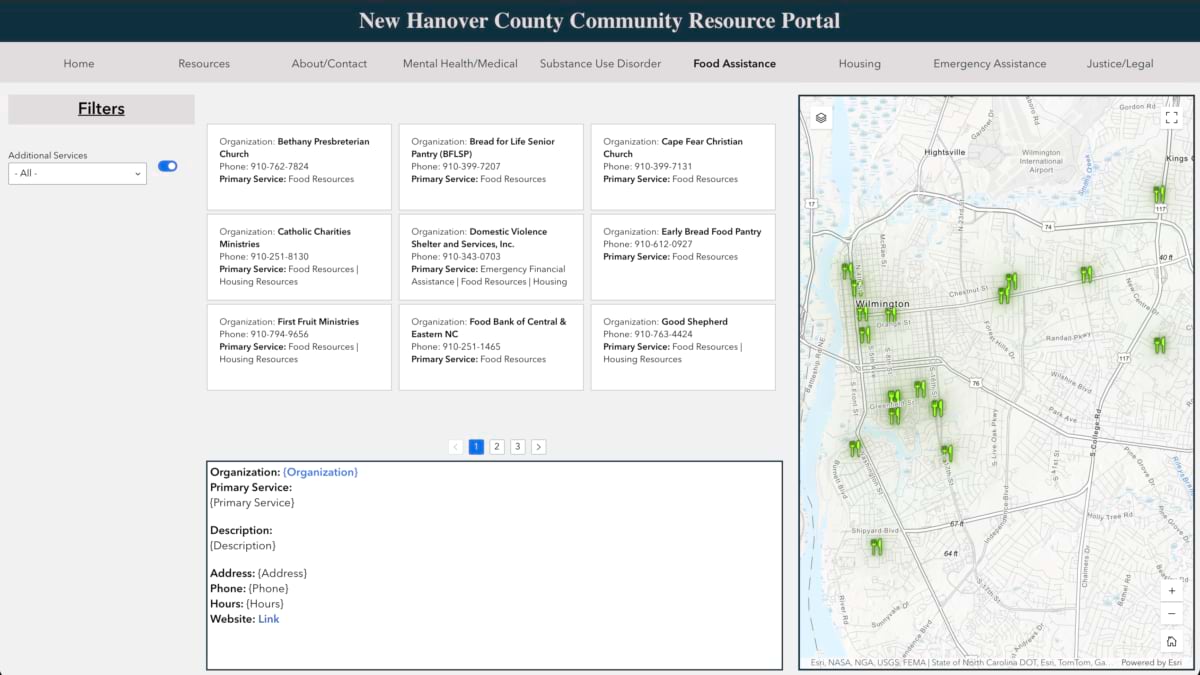
New Hanover built a second layer on top of the same data, a database of food assistance sites cross-referenced with hours and location and turned it into the New Hanover County Community Resource Portal, an app people can open on a phone or desktop to see what’s near them and when it’s open, without calling an office or asking around.
That self-service model runs through the county’s main food pantry too, just in physical form. Visitors push a cart through aisles and bag their own groceries at the register instead of waiting in a line. “There’s no shame, there’s no embarrassment,” Thompson said. “Anybody can go in. It provides dignity.” Staff there also screen visitors for other benefits they may already qualify for, turning a single pantry visit into a doorway toward broader support.
The same self-service logic had to solve a harder problem in the county’s rural pockets, where the map showed need but people without cars were stuck. Mobile food trucks now fill that gap, loading up and driving into communities with no walkable grocery store and little public transit. “That’s what makes it work,” Thompson said of the shift toward bringing the food to people.
-
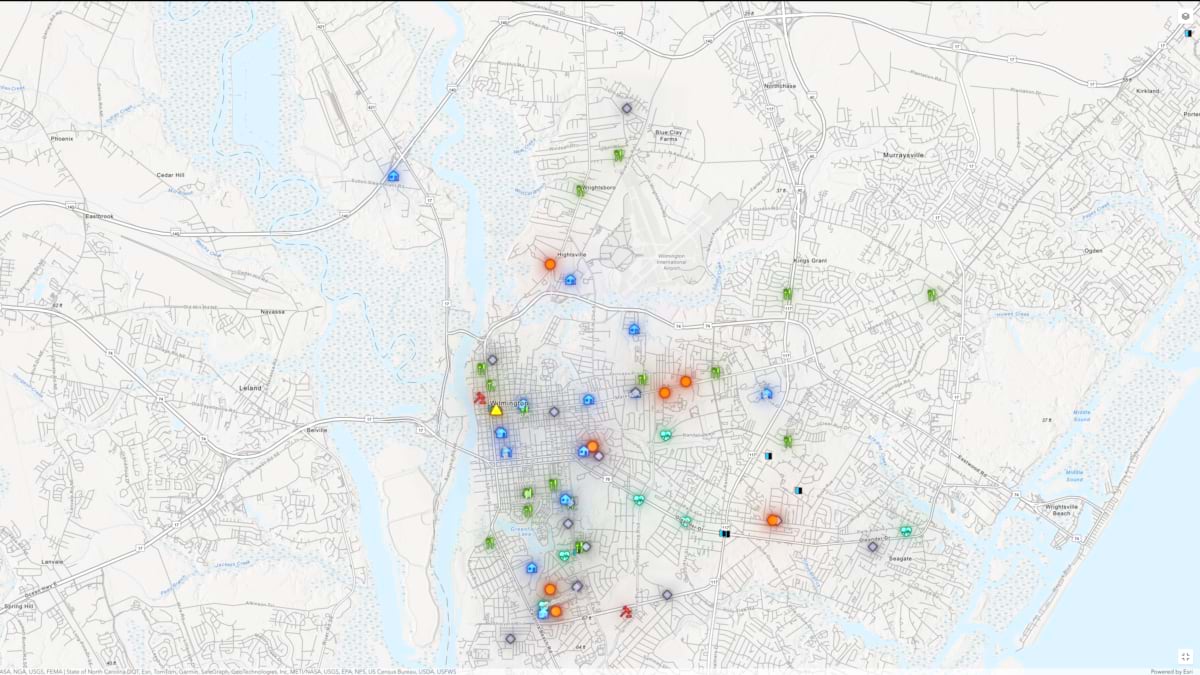
A density map layers food access points and service types across Wilmington, the kind of view that can help spot where new sites are needed most.
On a 300-acre farm outside the county, a grower affectionately known as Farmer Bill grew tired of the churn of trucking produce to farmers markets and restaurant accounts and made an unconventional choice. He sells almost exclusively to the Food Bank now. The Food Bank tells him what it needs, he sends photos as the crop comes up, and a guaranteed buyer replaces the uncertainty of chasing retail customers. When funding for the federal program that helped support the arrangement was cut, the Food Bank leveraged state funds and raised private funds to keep buying from him rather than let the relationship lapse. It’s a small trade that works for both sides, one farmer’s steady income for one steady, local source of fresh food.
One County Within a 34-County Network
New Hanover’s pantries and mobile sites draw the remainder of the food it provides from the Food Bank of Central and Eastern North Carolina. This regional supplier has to answer the question of need and available resources 33 more times, in counties with varied data systems, coordinating roughly 850 hunger relief partner agencies in Raleigh, Wilmington, Durham, Greenville, New Bern, and Sandhills. The Food Bank has its own FoodFinder tool that allows anyone to see pickup spots across all 34 counties, which can be filtered by hours, program type, and accessibility.
The Food Bank adopted its own GIS platform in 2022, at the start of a new strategic plan, after watching sister food banks use the mapping software to examine need compared to capacity. What started as a mapping exercise became something broader. “We needed to develop the culture of data, and not just any data, but the visuals as well,” said Angie Nesius, the Food Bank’s manager of Network Data and Capacity. Staff who once relied on spreadsheets and bar charts started asking to see things on a map.
The closer the data got to individual census tracts, the more it revealed about the variability of need across the service area. “It doesn’t do us any good to judge our service area by county scale alone,” Nesius said.
The Food Bank overlays Feeding America’s food insecurity estimates, built on the same federal census data Lockamy draws on in New Hanover, across its 34-county service area. It shows the characteristics of who lives there: age, ethnicity, income, and the shape of vulnerability. What it can’t tell them is the pattern of service at every site, such as how far people are traveling or whether a location 15 miles up the road would serve the same community or a different one. That’s the layer the Food Bank is building toward, using Feeding America’s digital intake platform Service Insights on MealConnect (SIMC) to move from where need exists to understanding how and where neighbors are accessing food assistance. That half of the picture still depends on the partner agencies collecting that data, and a number of them do not yet have the technology capacity to do so.
Nesius saw the importance of filling that data gap through a peer organization, Low Country Food Bank in Charleston, South Carolina. A census tract there looked unserved on paper, no partner agency, no pounds of food logged. But neighbor-level data showed people living in that tract had been receiving food all along, just never through a location anyone had added to the map.
-
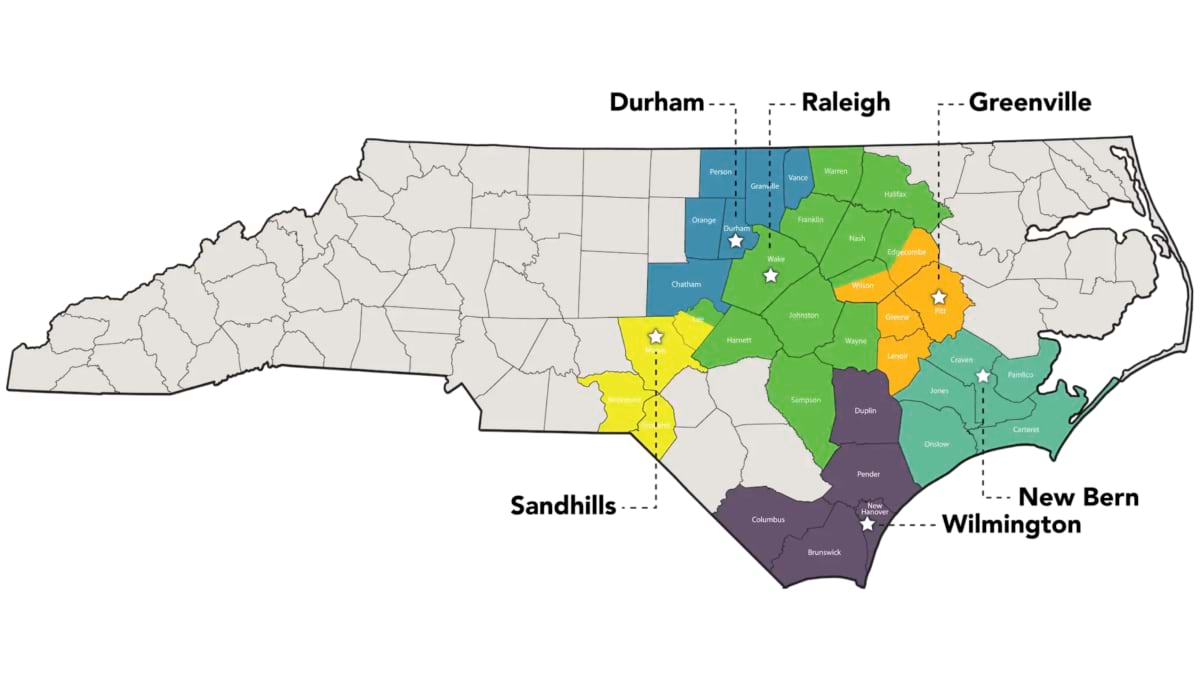
The Food Bank of Central and Eastern North Carolina's 34-county footprint runs through six regional offices, from Durham and Raleigh in the Triangle down to Wilmington on the coast.
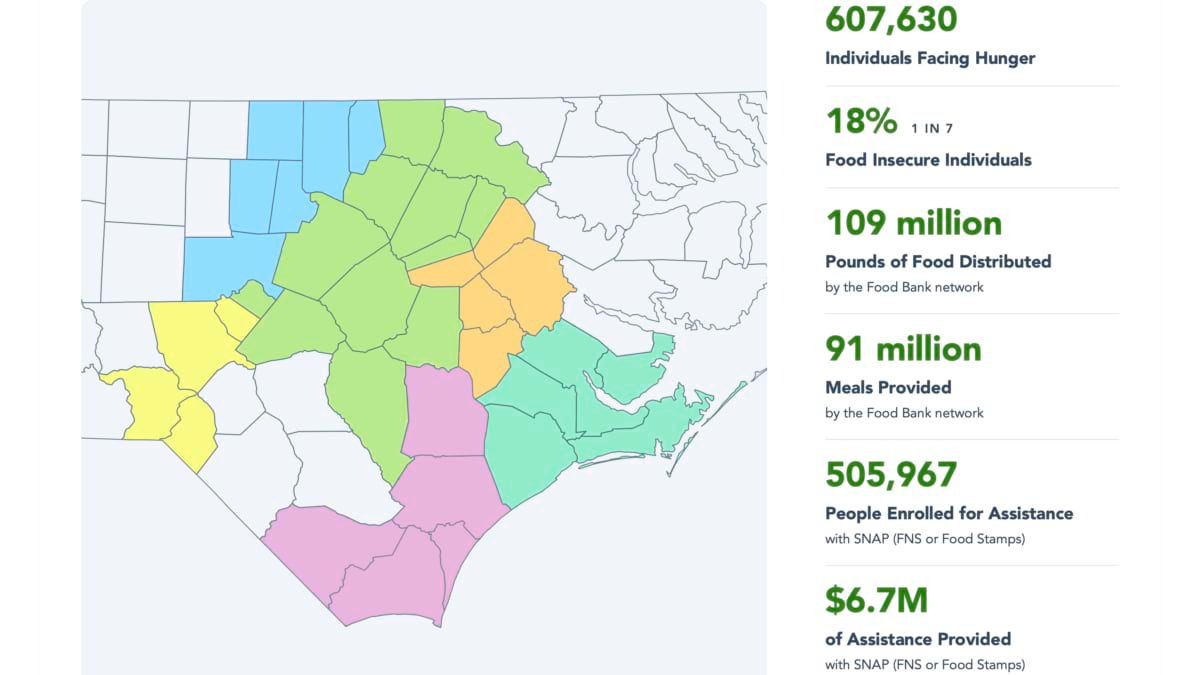
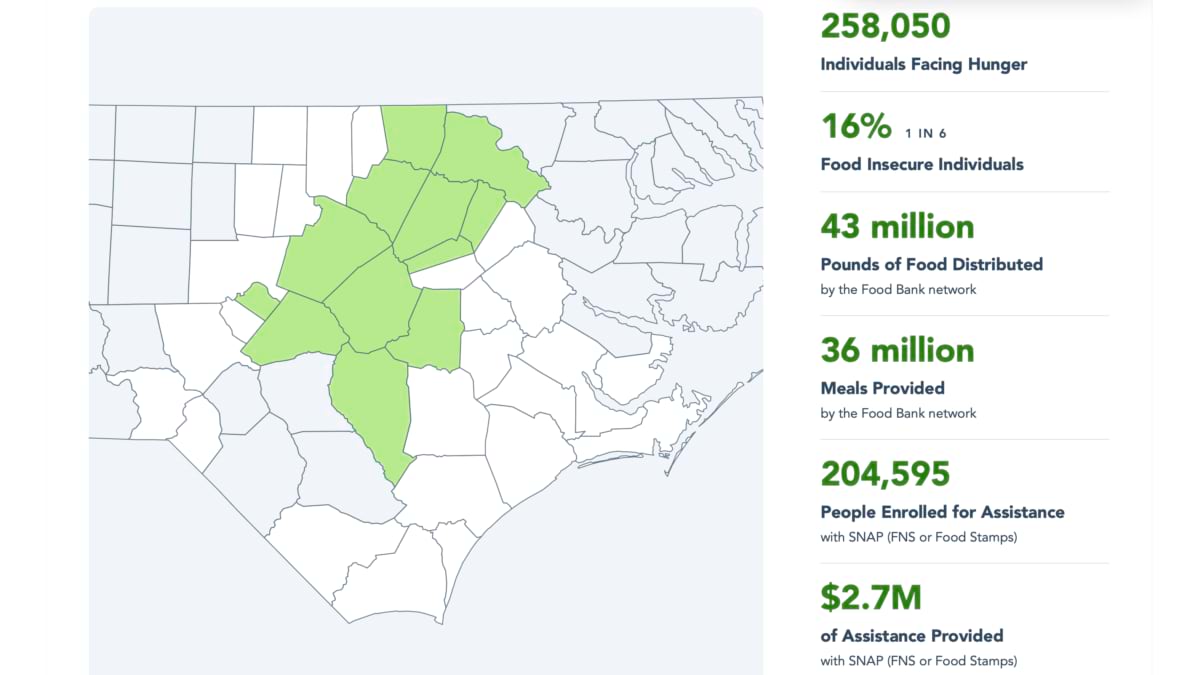
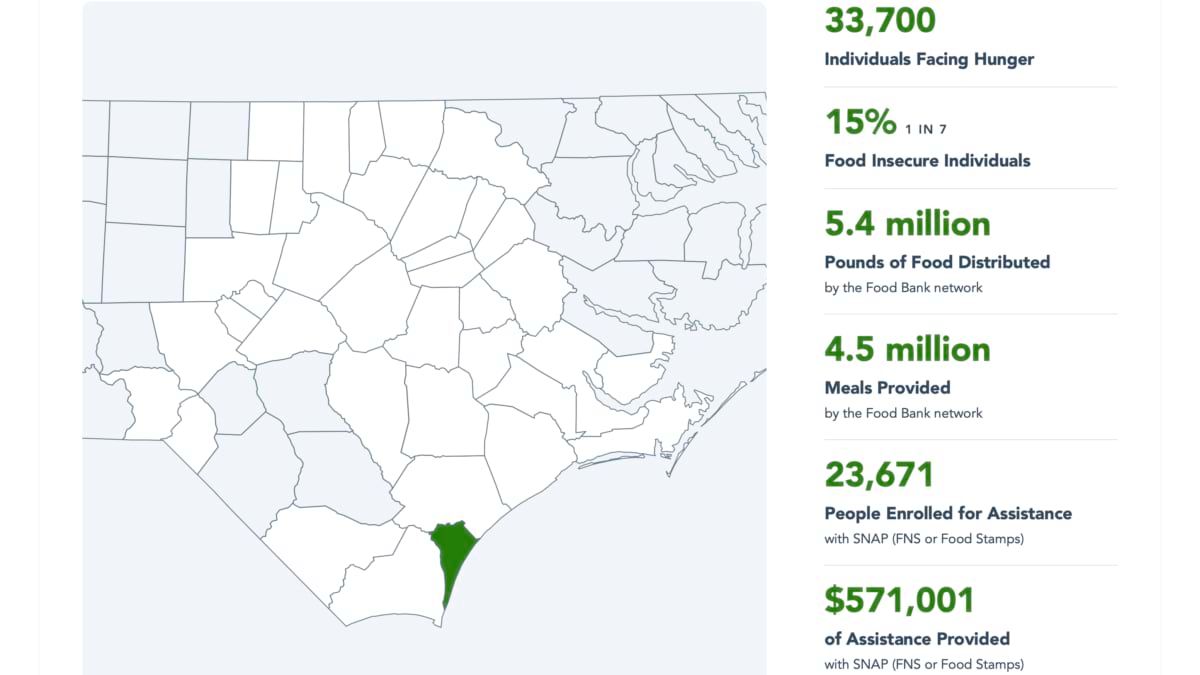
A number of the Food Bank’s 850 hunger relief partners still track visits with paper and a pencil, counting heads at the door rather than digitally recording household visits. The Food Bank has used a form built in ArcGIS Survey123 to capture whether a partner agency has internet access or a device they can use to record visit data. Where needed, the Food Bank helps address equipment gaps and trains staff, building the capacity needed to collect the neighbor-level data that can later support mapping and analysis.
Creating the data backbone one partner agency at a time will give the whole network a shared, more complete picture of how neighbors are accessing food assistance across the service area. It’s still early in that process of bringing eligible partner agencies onto SIMC, but as participation grows, so does the Food Bank’s ability to map where neighbors are being reached and identify opportunities to strengthen access.
Elijah Lopez, network data coordinator, joined the data team five months ago with no GIS background. Nesius says he’s picked up the department’s data analysis work fast enough that she considers him “born to be a food banker.” He now spends much of his time on onboarding partner agencies to SIMC, visiting partner agencies to walk them through the system that, for some, represents a significant shift from paper-based data collection.
New Hanover’s map, and the app it fed, mark what a county with a clear digital foundation can build. Across the larger region, the Food Bank is working to strengthen that digital foundation and gather the data needed to better understand need, reach, and access.
From Diagnosis to Delivery
New Hanover’s own map turned the diagnosis into a funded program. The New Hanover Community Endowment awarded the county $1.24 million this spring for a two-year Food and Medication Delivery (FAM) Program reaching all eight zones the map identified. The program delivers groceries, household essentials, and prescription medications directly to income-qualified households, along with a $120 annual Fresh Funds stipend.
The program marks a shift away from the assumption that a food desert gets fixed with a building. New Hanover spent years trying to land a grocery store on Wilmington’s north side, and when a planned development fell through last year, the county changed its model. It has partnered with Instacart to deliver food and prescription medications directly to residents living in the mapped food deserts. Applications opened August 18 at NHCgov.com/FAM.
The endowment behind that funding uses the same map in its own meetings, tracking poverty, food distribution, and school data before deciding where dollars go next. “They are able to see if they’re putting the monies in the right places,” Thompson said. The map keeps growing alongside that use. When Lockamy first built it, the county counted 95 food resources. The latest count is 159, including 14 community gardens, up from seven.