What Esri Consumer Spending Data Can Do for You
Esri Consumer Spending Data helps you understand consumer spending trends and measure local demand for goods and services.
Esri Consumer Spending Data helps you understand consumer spending trends and measure local demand for goods and services.
Learn about the history of GIS mobile apps, the popular uses for them, and what might be coming next.
Find out how to create easy-to-understand pictograms of skiers, snowboarders, snowmobiles, and tractors for a ski resort.
Offerings of the two-day course, Preparing Data for GIS Applications, will be held online throughout 2021.
October 22, 2021, is the deadline to enter the ArcGIS StoryMaps Challenge for Restoring Our Ocean.
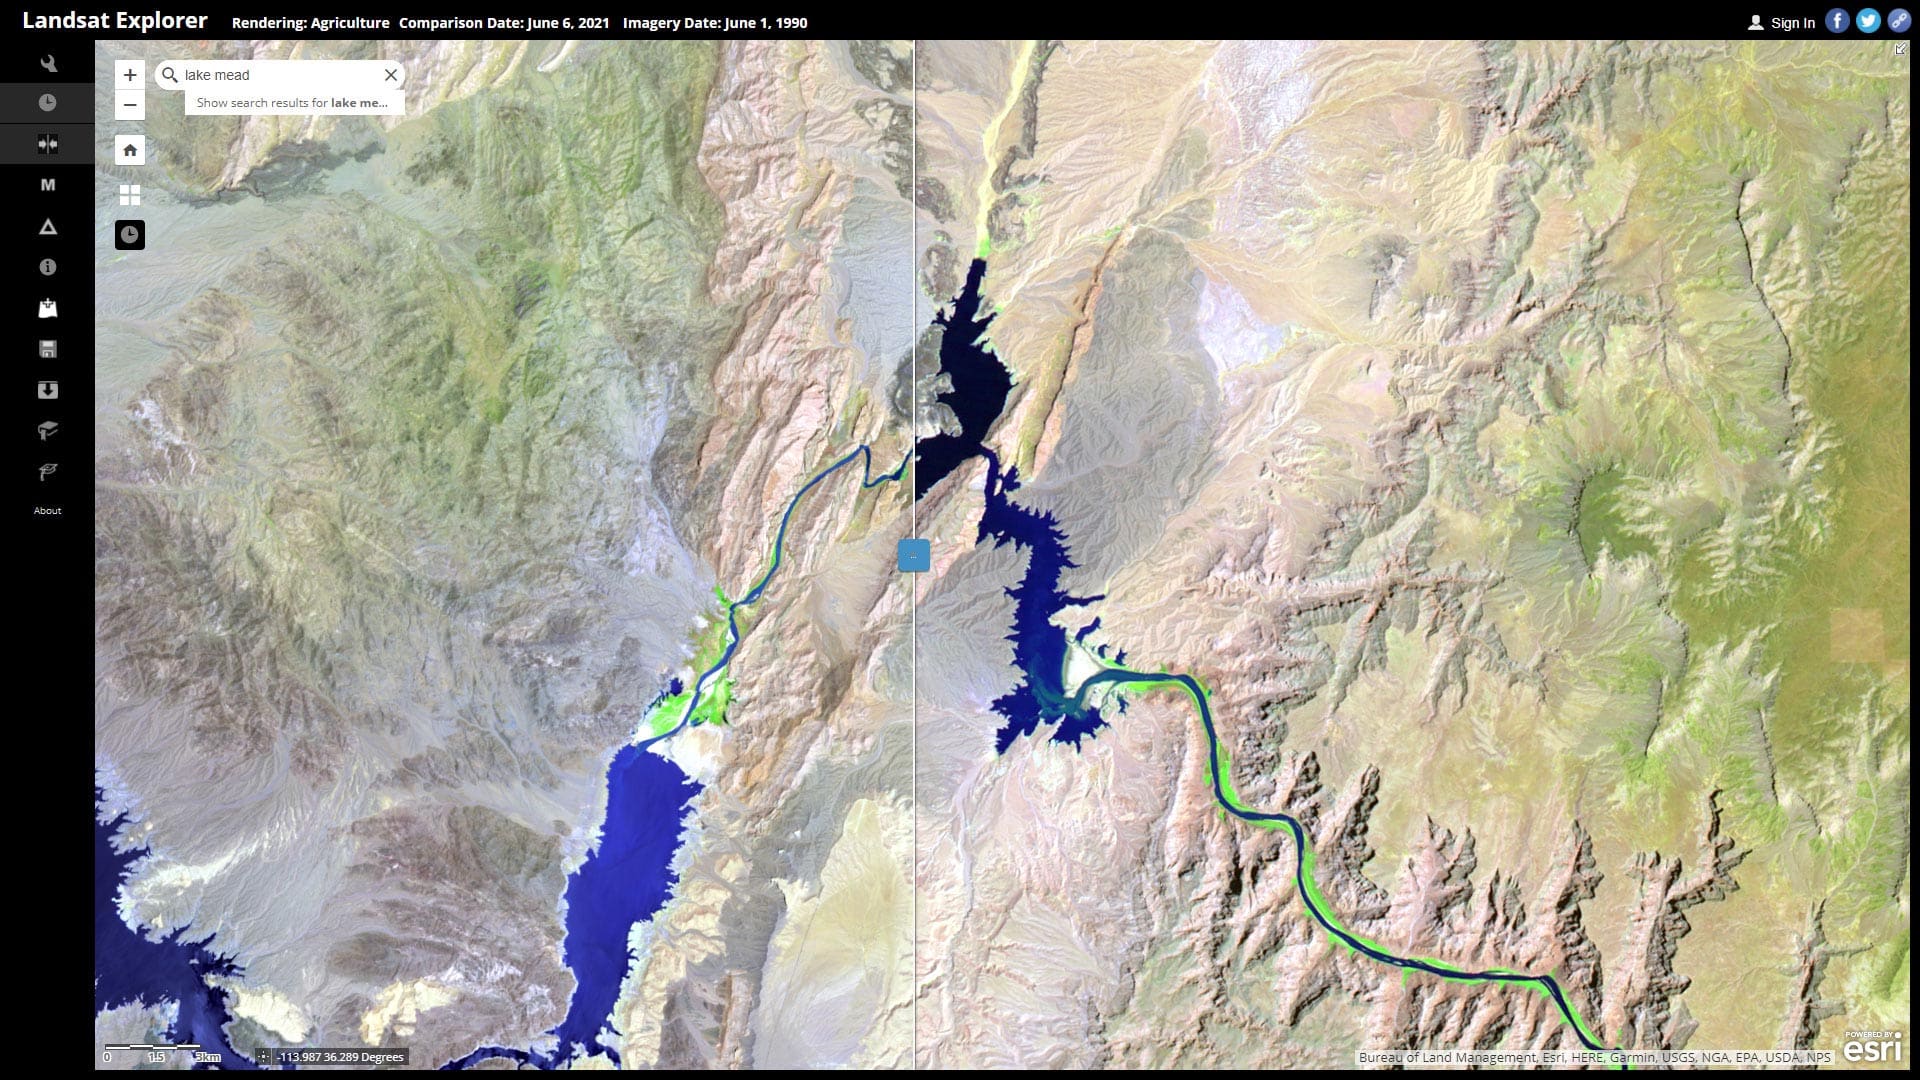
Learn how to explore Lake Mead water levels over time using ArcGIS Living Atlas of the World content and Landsat Explorer.
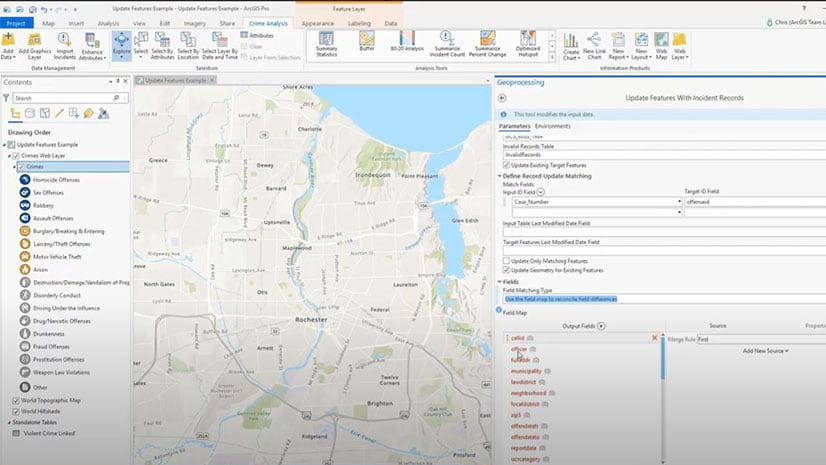
Use the Crime Analysis solution in ArcGIS Pro to automate the process of importing crime data from systems of record to a GIS for analysis.
There are tips you can follow to make your ArcGIS StoryMaps content easy to read for people who are colorblind or have other sight issues.
High school and college students, along with individuals ages 18-24, are invited to enter the ArcGIS StoryMaps Challenge for Restoring Our Ocean.
Esri technology evangelist Bern Szukalski shows you how to customize the item gallery in your profile in ArcGIS Online.
Make a map of the route of the Colonial Pipeline, which experienced a cyberattack this year, using ArcGIS Living Atlas of the World content.
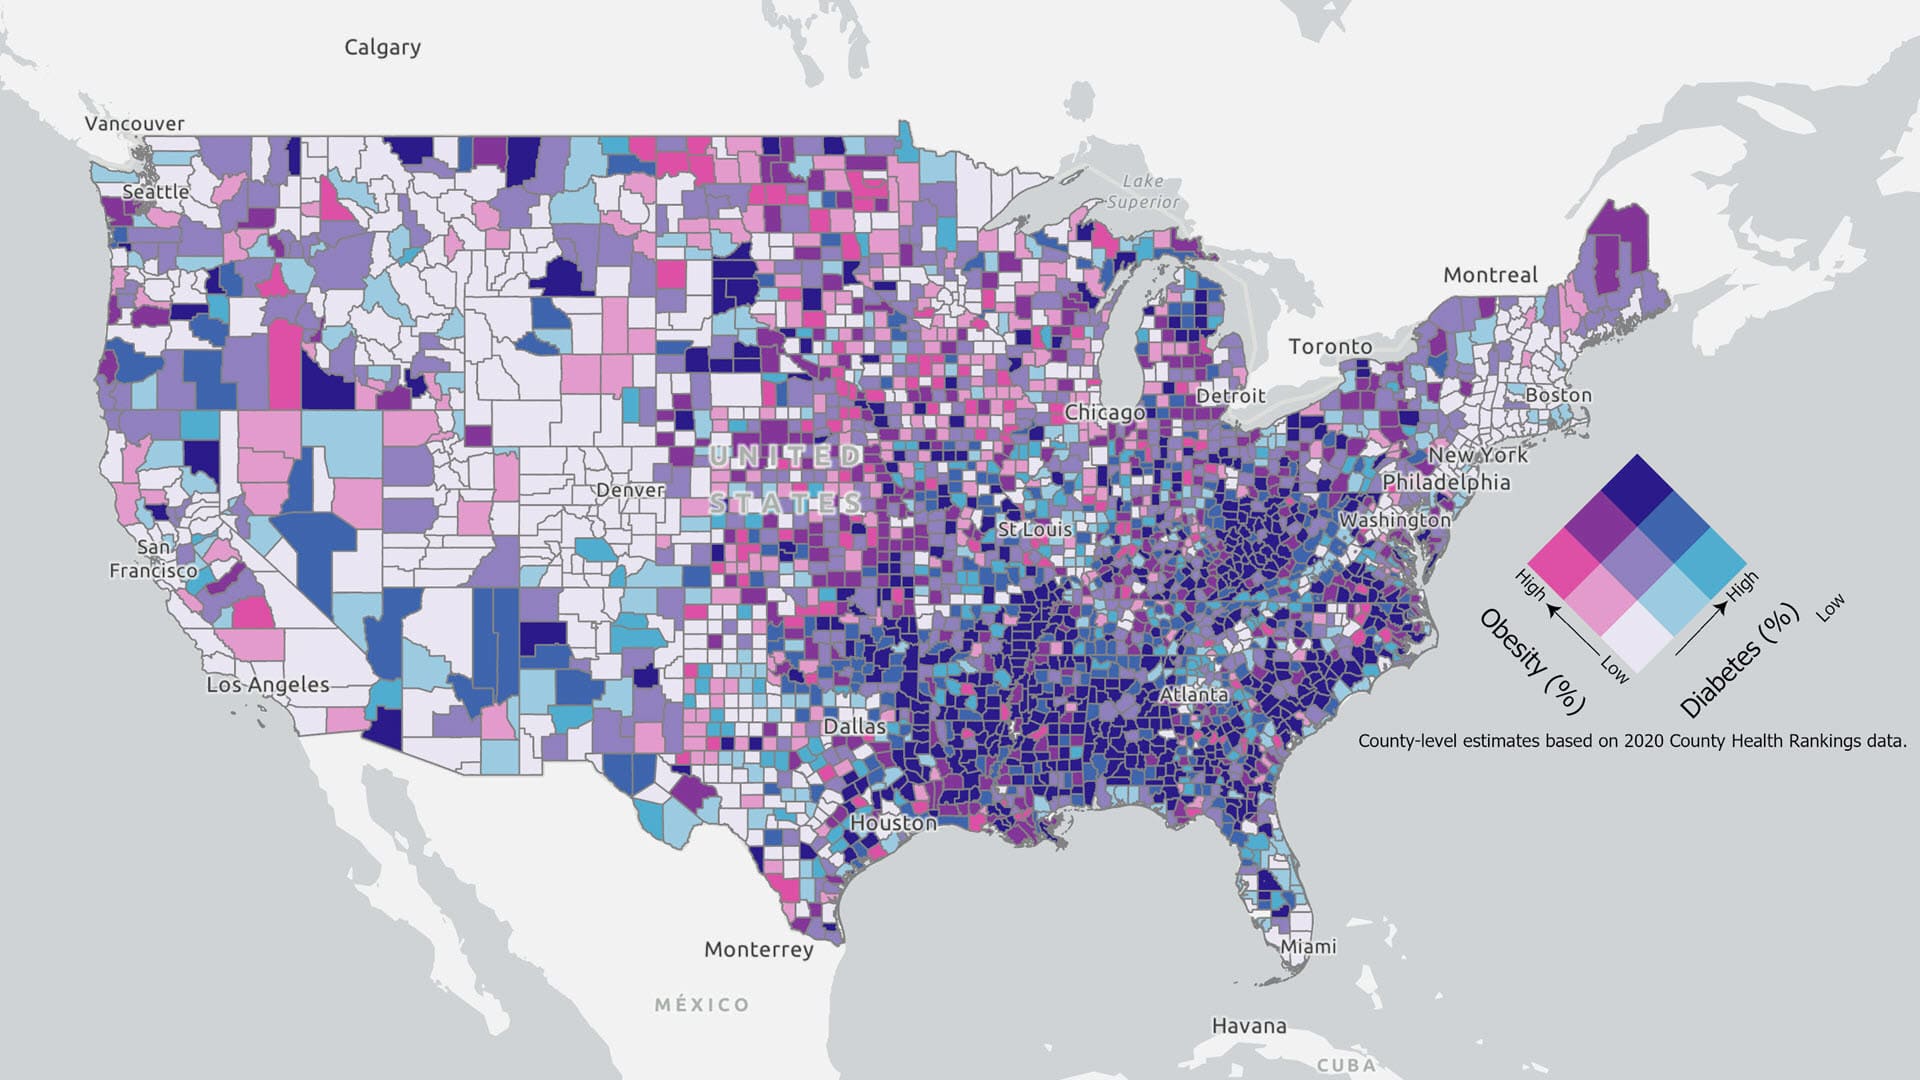
Esri cartographic researcher Aileen Buckley walks you through the process of customizing a legend for a bivariate colors map.