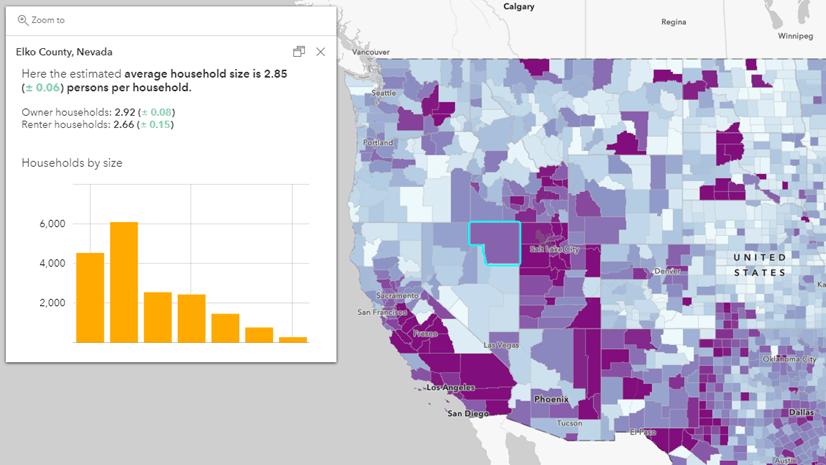
Do you want basic information on population and housing in your community? Do you work in childhood development, youth outreach, senior advocacy, or emergency preparedness and response? ArcGIS Living Atlas has ready-to-use feature layers designed specifically for you!
Each of these layers are sourced from the U.S. Census Bureau’s American Community Survey (ACS). The ACS enables local officials, businesses, and researchers to understand what’s taking place in their communities, and helps community programs allocate resources. This data determines how $675 billion dollars in federal and state spending are spent each year, so access to the latest available data is critical. ACS data is used by everyone from regional planners and program administrators, to entrepreneurs and big companies looking for their next location to set up shop, something that can lead to more local jobs.
ACS data in ArcGIS Living Atlas
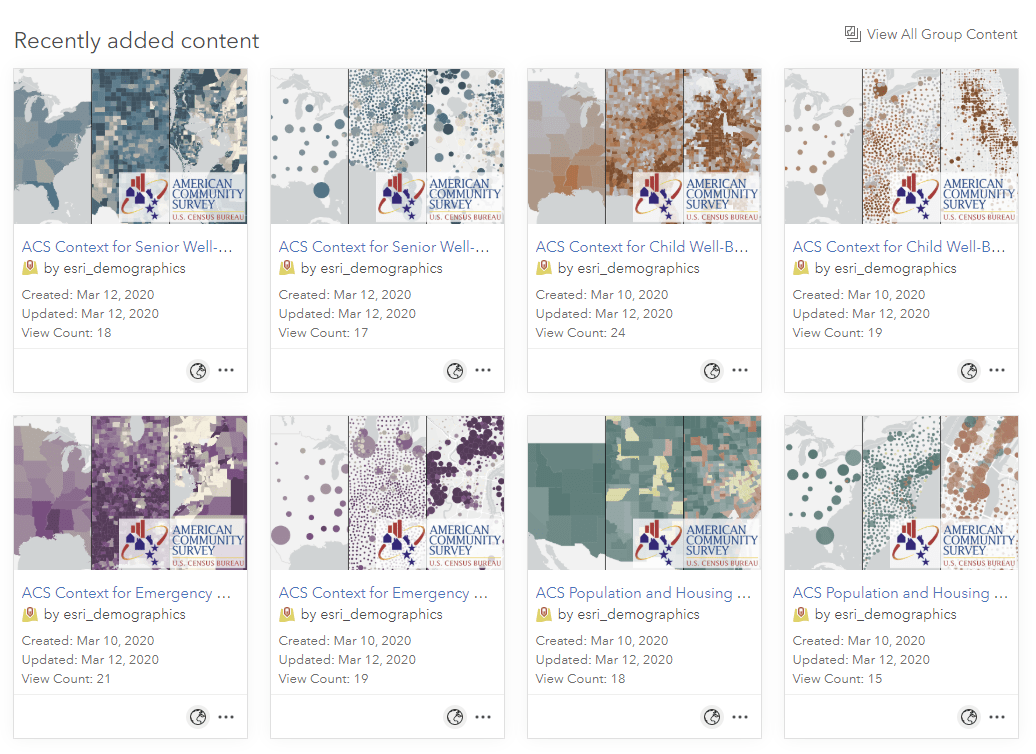
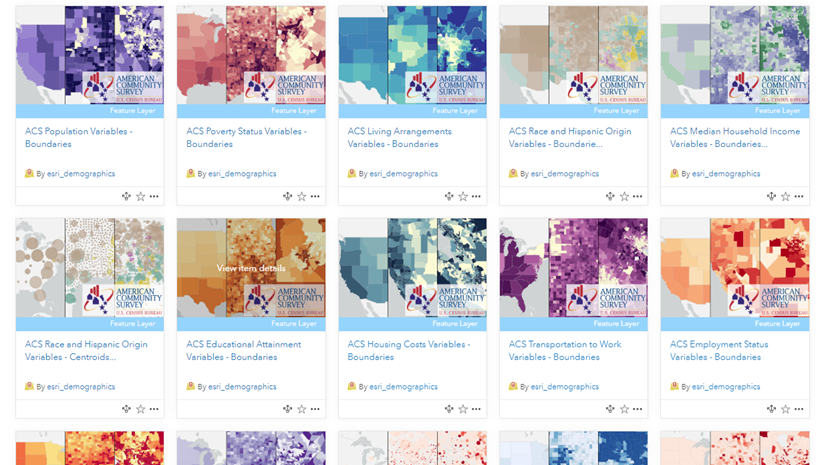
Last December, we updated 78 Living Atlas layers containing ACS data within 48 hours of Census releasing the 2014-2018 values. These layers are all grouped by topic, such as health insurance, internet access, and living arrangements. Recently, we released some new layers grouped by industry or user persona rather than by topic, that include the most essential attributes for specific use-cases. Our four highlights layers include:
- Population and Housing Basics
- Context for Child Well-Being
- Context for Senior Well-Being
- Context for Emergency Response
Now you can answer questions such as
- Where are kids who are uninsured?
- Where are kids who don’t have broadband access?
- Where are kids in single-female families?
all from one layer – Context for Child Well-Being.
Similarly, you can answer questions such as
- Where are seniors who are uninsured?
- Where are seniors who don’t have a computer?
- Where are seniors who live alone?
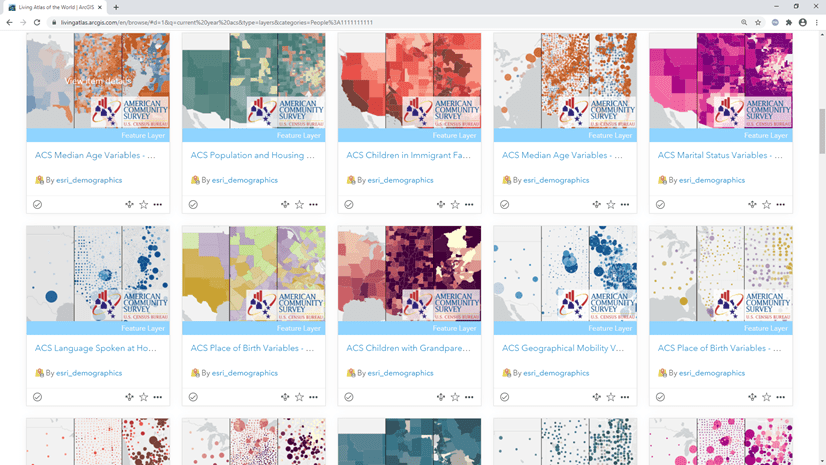
all from one layer – Context for Senior Well-Being. We’ve assembled key attributes that span across all topics into layers that are designed with you in mind. Each of these new layers has dozens of attributes that are of interest to a specific industry. All ACS layers in Living Atlas can be found in this ArcGIS Online Content Group.
Benefits of these new industry-specific layers
These layers have the same benefits as our existing ACS layers in Living Atlas
Just like our other ACS layers in Living Atlas, these layers have some value-added benefits to help you save time and make better maps:
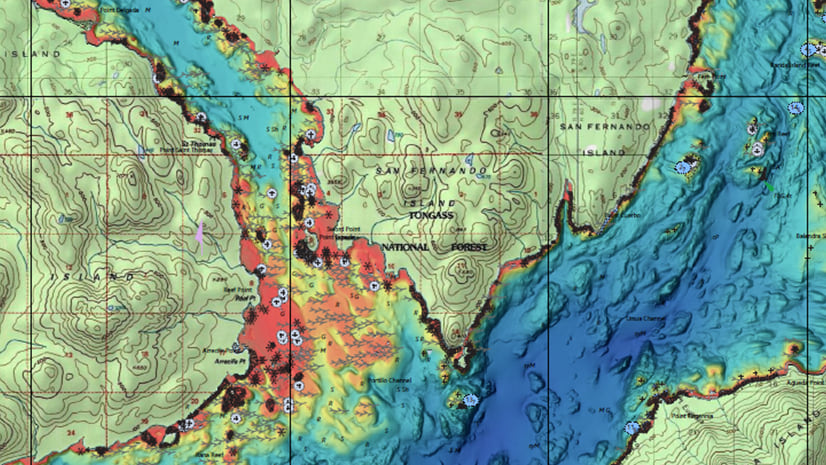
- These layers have cartographic-friendly geographies with nice coastlines instead of the international borders.
- We’ve taken the time to create descriptive alias names and complete field descriptions, which makes the layers more user-friendly. We’ve moved the technical documentation closer to the GIS analysts by incorporating the metadata into the layers themselves.
- We added calculated fields (noted by the “_calc_” stub in the field name) for common totals, percentages, and ratios that people often derive, along with the associated margin of error for each calculated field.
- We’ve created both boundaries and centroids versions of these layers, to support different types of use-cases. Unsure which one to use? Check out this StoryMap that describes when to use which.
- These layers will update automatically each year, within days of the Census Bureau’s release. Let me repeat that one:
These layers will update automatically within days of the Census Bureau’s release
You read that right. Any maps you make with these layers will be refreshed with new data values very soon after the new data is available. This means you do not have to build new web maps each year, because your maps will always display the latest data. We do recommend you check your maps after the data is refreshed to make sure that your symbology choices still make sense given the new values.
Additional benefits of these layers
With all the key attributes now grouped together, workflows that used to be cumbersome are now simplified.
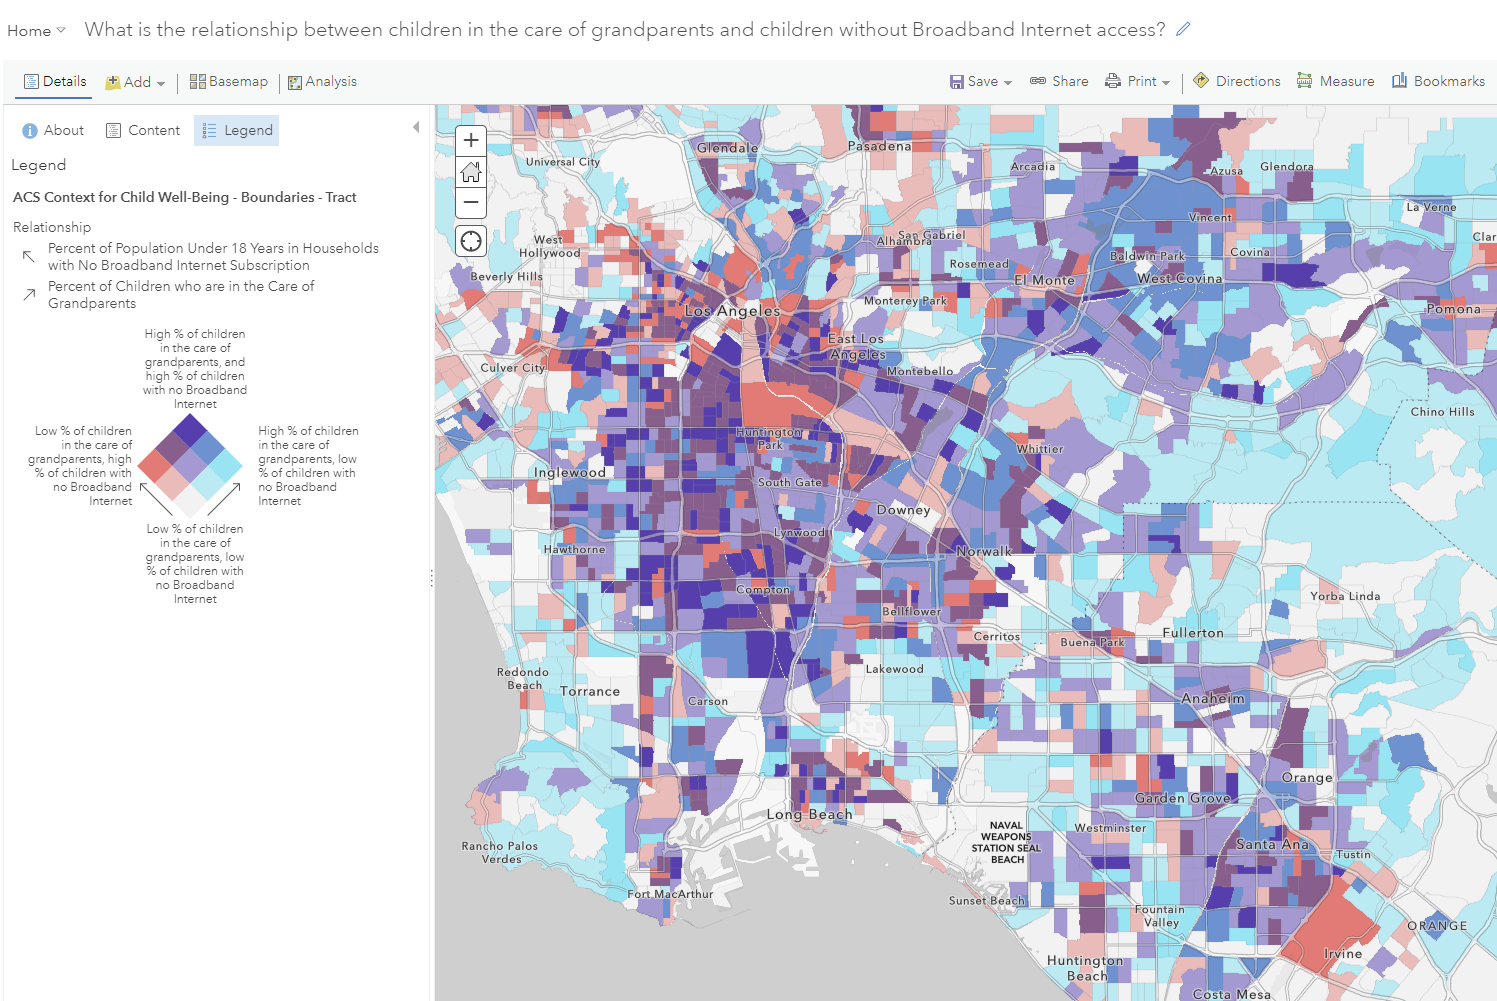
Relationship-style maps is now easier
With our new layers, it’s much easier to do a relationship map to visualize two attributes, such as the percent of children in the care of grandparents and the percent of children with no Broadband internet access. Because these two attributes are sourced from two different topic areas within the American Community Survey, they are attributes on two different layers (children with grandparent householder and internet access by age and race). Before, you would need to join the two layers together before you could produce the map below. Now, these two attributes, along with many others, are available on the same layer: Context for Child Well-Being. I was able to make the map below without having to do any joins.
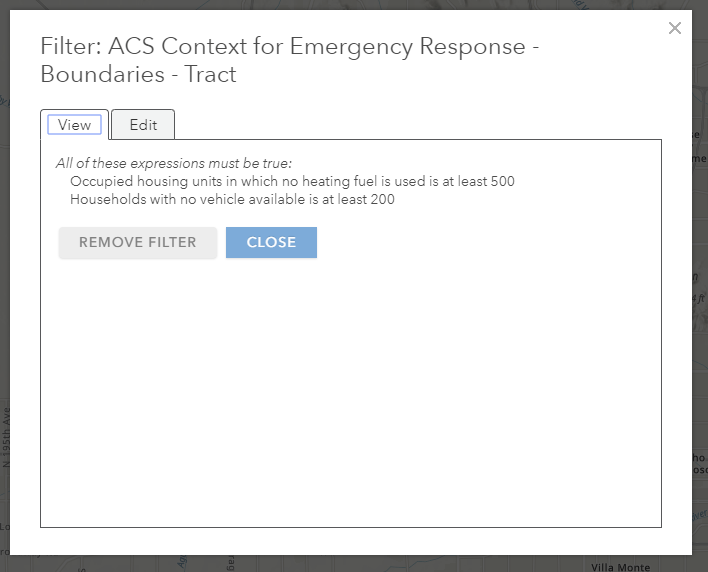
Targeting specific populations with filtering is now easier
Say you want to identify tracts that have high numbers of households with no heating in their homes and no vehicle available. With the new Context for Emergency Response layer, there’s no need to join two layers together. You can apply whatever filters you desire to the same layer, such as this example, which quickly gets you down to only 511 tracts in the nation.
How will you use these layers?
We are excited to see how you will use these layers to your advantage! Get inspired by browsing through some example maps and apps that use ACS Living Atlas layers. Try it yourself and make a map of your community in just a few easy steps.
Questions about these layers? See our FAQ site or post in Esri Community’s ArcGIS Living Atlas space.
Thank you to all the American Community Survey respondents who make all this data possible which is so important for America’s communities.


Article Discussion: