Global Audience Gathers Online for 2021 Geodesign Summit
The theme of the 2021 Geodesign Summit, Resilient by Geodesign, resonated with attendees, in part, because of the ongoing global COVID-19 pandemic. Resilience means having the ability to recover from adversity, which many communities are struggling to do as the pandemic’s effects continue to strain us physically, emotionally, and economically.
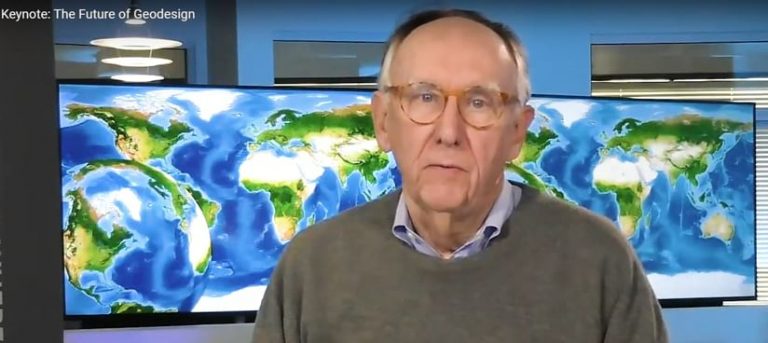
In opening the 12th annual summit in February, Esri president Jack Dangermond noted how the pandemic is one of the elements of what it means to live in an interconnected world. That interconnectedness, according to Dangermond, underscores the important role the science of geography will play in overcoming complex challenges.
“This is a very difficult time,” Dangermond said, citing issues in addition to the pandemic that concern him such as overpopulation, climate change, and loss of nature due to unconstrained development. “It’s going to require us to understand things better. It’s also going to require that we use the very best technology.”
Geodesign methodology in planning has been at the heart of the Geodesign Summit each year since the event’s inception in 2010. Since then, supporting technologies for geodesign, such as GIS, have only grown more robust. The methodology has improved too as it increasingly has been introduced to, embraced by, and refined by professionals and academics.
Books about geodesign have been published as well, including A Framework for Geodesign: Changing Geography by Design by Carl Steinitz. Even the definition of the term geodesign has become clearer over the years. At the summit, Shannon McElvaney, global director of geodesign at Jacobs, provided a succinct meaning of the term when he spoke about Jacobs’ use of the methodology for the Meridian Water housing and jobs project in the United Kingdom.
“The main actor in this story of digital transformation is geodesign, a powerful planning method that uses stakeholder input and spatial analytics to simulate the possible impact of alternative design scenarios,” McElvaney said.
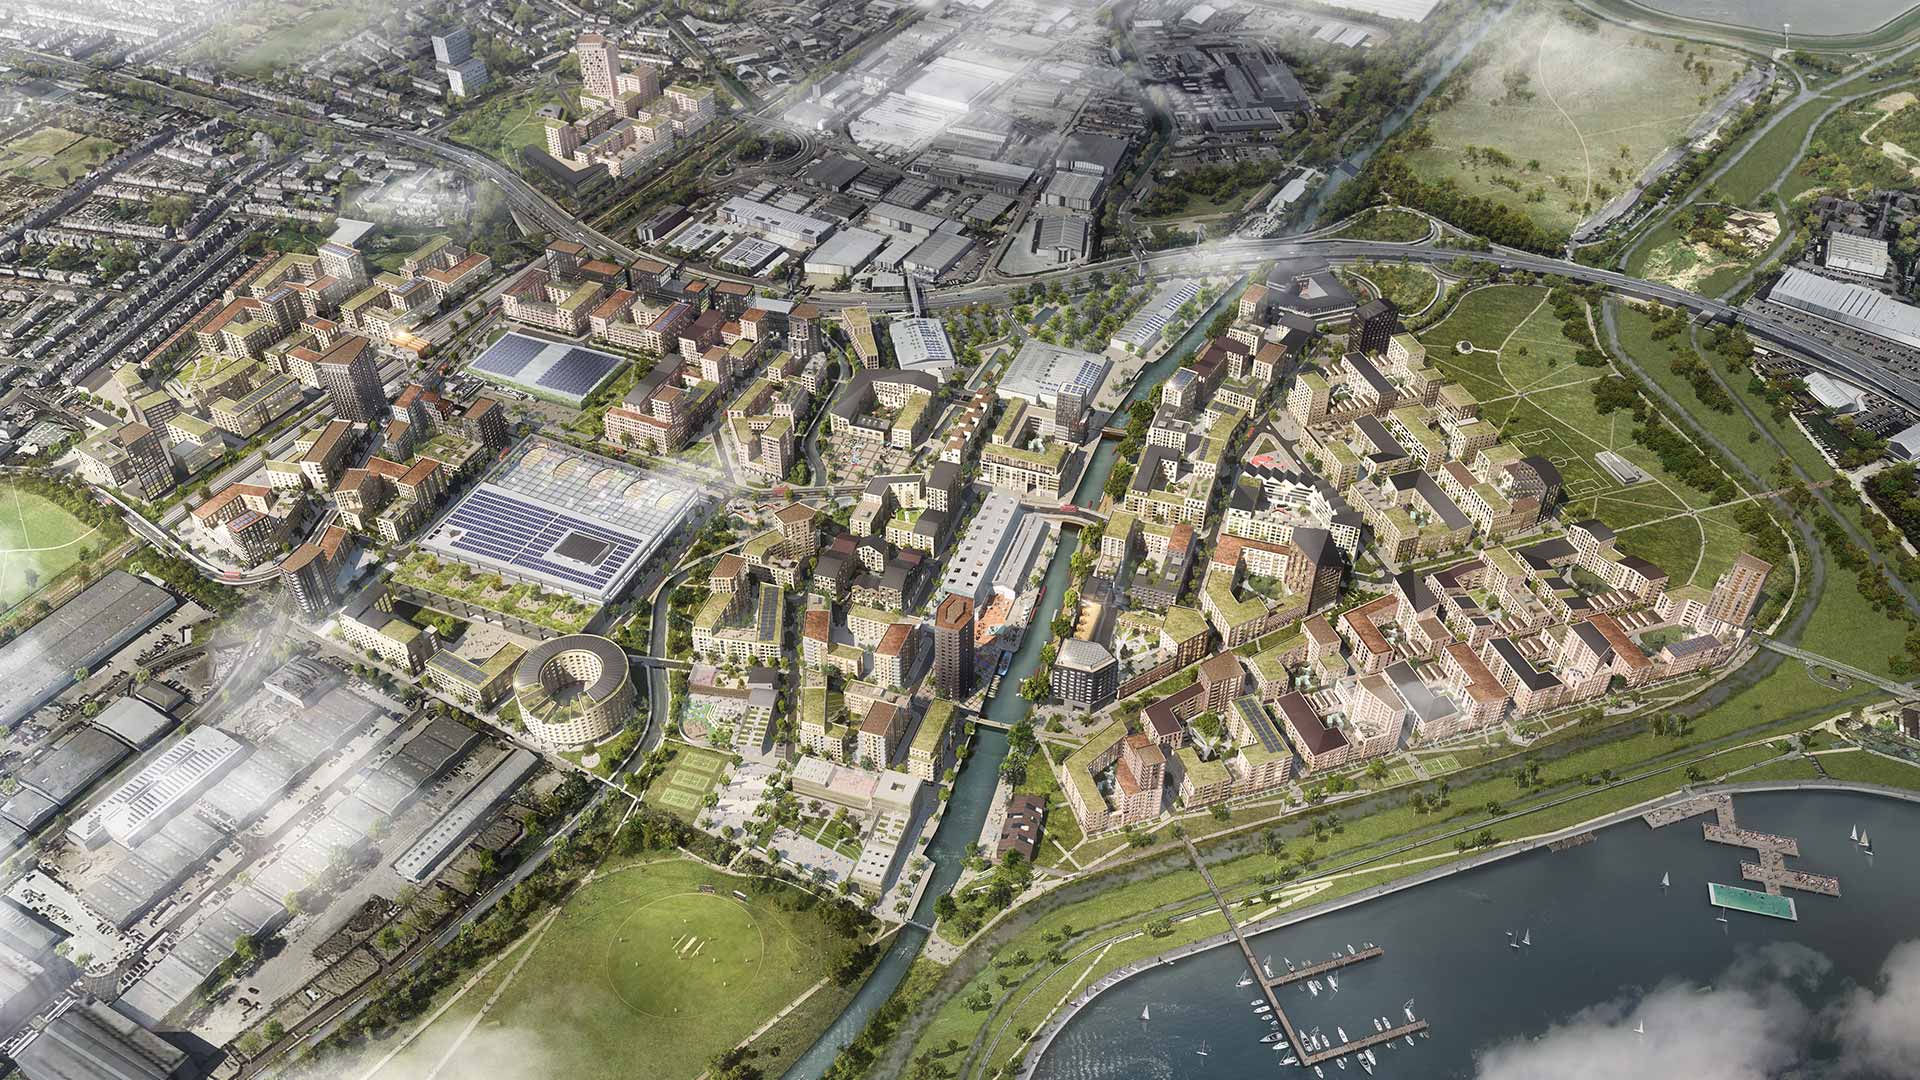
Meridian Water is a 20-year, US$7.8 billion sustainable development plan to bring jobs and affordable housing to the north London borough of Enfield. The Meridian Water presentation—along with the keynote address and 18 other user presentations at this year’s summit—highlighted how geodesign and supporting technologies are being used worldwide to help leaders reach well-informed decisions and build resiliency and sustainability for a wide variety of projects including the following:
- Housing and commercial developments
- Climate change action plans
- Water resource management
- Transportation networks
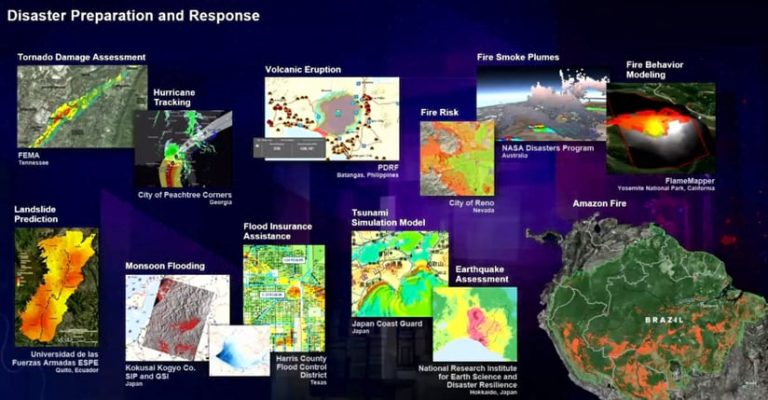
- Disaster response and recovery
- Community revitalization
- Conservation programs
The presenters demonstrated how they used GIS technology—including Esri software such as ArcGIS CityEngine, ArcGIS Urban, ArcGIS Pro, ArcGIS Experience Builder, ArcGIS GeoPlanner, ArcGIS Enterprise, and ArcGIS Survey123—in their geodesign projects. Some of the projects also made use of imagery, game engines, and machine learning.
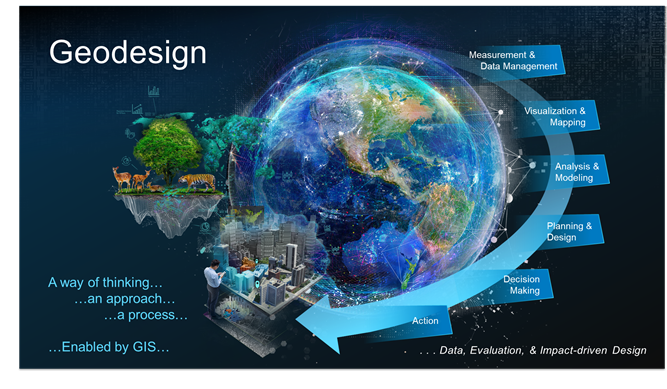
According to Ryan Perkl, geodesign practice lead at Esri Professional Services and the moderator of the Geodesign Summit, geodesign lets planners and stakeholders—including the public—see designs in advance to avoid possible planning pitfalls. “Geodesign is data evaluation and impact-driven design,” he said. “It’s an approach that encourages us to make mistakes in the digital world so we can avoid making them in the real one. Geodesign can help build resiliency, especially now at a time when it’s needed the most.”
Dangermond expanded on that theme. He told the online attendees—watching from around the world in countries such as Iraq, Uganda, and Switzerland—that digital technology is being used to design and create a better future, whether to track the impact of climate change, plan the distribution of vaccines during this pandemic, or envision proposed structures in a city. With the creation of digital twins using 3D modeling software such as ArcGIS CityEngine, designers, stakeholders, and the public can now better see—for example, in a downtown redevelopment project—alterative design scenarios and understand their impacts. “These digital twins are not just unique to cities, although that’s where a lot of the action is,” he said.
He also touched on reality capture, a means of capturing a digital 3D model representation of something in the real world, such as a city, by using lidar or photogrammetry. That lidar and imagery data can then be transformed into point clouds, phototextured 3D meshes, and true orthophotographs. “[This is] a new area that pretty much excites the heck out of me,” Dangermond said.
As the digital age progresses and a digital geospatial infrastructure is built, geodesign will be applied and keeping up with changes in real time, according to Dangermond. “The digital infrastructure will wire up virtually everything that moves and changes. It’s going to be able to understand how to analyze and make design decisions in near real time, much like your brain does, “he said. “It’s going to be fascinating.”
Dangermond reiterated a message he has made during past Geodesign Summit events. He encouraged attendees to pursue geodesign in a professional capacity and use the methodology and supporting technologies, such as GIS, to address the big challenges the world faces. “I’m not a person who is going to be overwhelmed by doom and gloom—looking at all the forecasts, one can easily do that,” he said. “What I’m about is trying to really [kick-start) it and keep [promoting] the technology and these methods of geodesign, [which] brings it all together to create a better world.”
The user presentations, demonstrations from Esri staff, and a keynote talk this year by Lilian Pintea from the Jane Goodall Institute (JGI) focused on using geodesign methodologies and supporting technologies on projects that increase resilience and sustainability. This could be in planning for future land use; setting aside areas for conservation; creating networks for transportation options including walking and bicycling; redeveloping urban downtowns and neighborhoods; or protecting areas under stress from climate change or hazards such as flooding or other natural disasters.
Geodesign also is being used to protect chimpanzees in Africa. In his role as vice president of conservation science at the Jane Goodall Institute, Pintea uses geospatial technologies for conservation efforts in Africa to protect the chimpanzees there and help communities thrive. During his 45-minute talk, he described how the JGI is partnering with local governments and residents in Tanzania, working to regenerate woodlands critical to the chimpanzees while also improving the lives of people. In that effort, JGI utilizes imagery, ArcGIS software including the ArcGIS Survey123 mobile app, and geodesign methodologies. He described the JGI’s Lake Tanganyika Catchment Reforestation and Education (TACARE) program], a community-centered approach to conservation and development in Tanzanian villages. In the TACARE program, input is sought from local residents on conservation and land-use decisions. Stakeholder input is a key component of geodesign methodology.
What follows are highlights from some of the other presentations:
Designing a Resilient Community
For the Meridian Water project, Jacobs has built a data visualization platform and created key performance indicator (KPI)-driven geodesign processes that are helping decision-makers plan the 202-acre site next to Lee Valley Regional Park in Enfield. Traditionally the area has been industrial, but it will be transformed over time into what borough officials and planners see as a lively mixed-use development. The development will include 10,000 homes, half of which are slated to be affordable; 6,000 high-skill jobs for local residents; retail spaces; a network of walking and cycling paths; recreational areas; cinemas; and theaters. A new school and train station have already opened.
During their presentation, McElvaney and colleague Mary-Jane Wood, a senior urban designer at Jacobs, demonstrated how geodesign methodology was used to review proposed designs against quality-of-life metrics to ensure that the designs met the vision of the Enfield Council. According to Wood, the design for Meridian Water always needed to be tested to meet the following three placemaking pillars laid out by the council: Mixing Uses and Animating Streets; Park Life on Your Doorstep; and Your Place to Make and Create. The Enfield Council foresees a vibrant community that includes play space for children; work space for artists and craftspeople; green space for residents to walk and cycle in; and entertainment space for restaurants, theaters, and cinemas.
Wood said that one of the strengths of using geodesign is being able to take subjective statements—which are hard to measure—like the three placemaking pillars, and translate them into something quantifiable—in other words, a measurable matrix of agreed-on project ambitions, KPIs, and targets. “These targets,” Wood said, “cover various themes—of open space, density, housing, sustainability, environment, and transport, for instance—which operate over varying scales and contribute to the performance of individual buildings to the site itself and the borough region.”

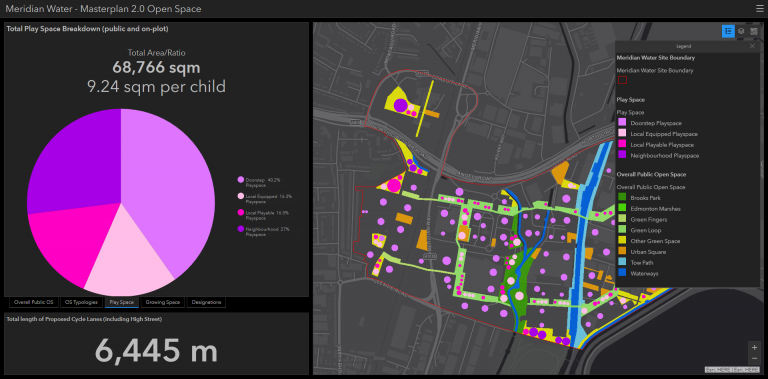
How does this work in an analysis? “If I take the placemaking pillar of Park Life on Your Doorstep, this is translated into a series of KPIs and targets, such as maximum walking distance for all residents to a local park, or the percentage of public open space provided across the site,” Wood said. Analyses like these were done at even more granular scales. For example, one requirement was that there must be, within 400 meters of all residential buildings, a minimum of 10 square meters of play space per child.
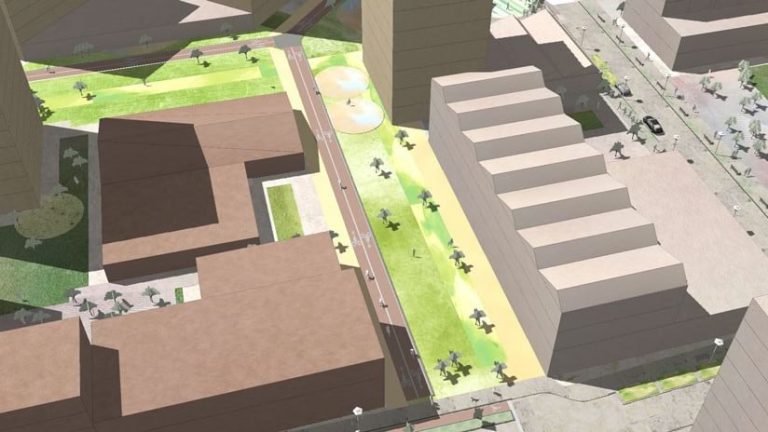
Esri technology—including ArcGIS CityEngine, ArcGIS Enterprise, and ArcGIS Pro—was used to integrate project data and create both 2D and 3D models to visualize and analyze the project plan data. This would ensure that the requirements would be met. “Where [designs] weren’t working, alternatives could be tested live within CityEngine, for instance, or scenario designs could be generated externally and then resubmitted and processed for analysis again,” Wood said.
CityEngine also was used to conduct viewshed analysis to determine the value of units within buildings that were going to be developed. “We could use the viewshed analysis tool and take a particular floor from any building and assess the percentage of views from each facade to open space, roads, and buildings, which could inform the value of those units and feed into a financial model,” Wood said.
“Each step of the way, geodesign is helping to enhance community resilience by design while balancing sustainability goals to make Meridian Water a great place for people to live, work, play, and thrive,” she said.
Designing a Climate Action Plan
At the 2020 Geodesign Summit, Cape Cod Commission executive director Kristy Senatori demonstrated the Cape Cod Coastal Planner. The web-based tool was designed to help users better understand and plan for the impacts of climate change on Cape Cod, Massachusetts.
Senatori came to this year’s summit to talk about how the commission is now developing Cape Cod’s first climate action plan. The commission believes this is necessary because the cape has 500 miles of coastline that’s vulnerable to threats such storm surge, flooding, erosion, and sea level rise.
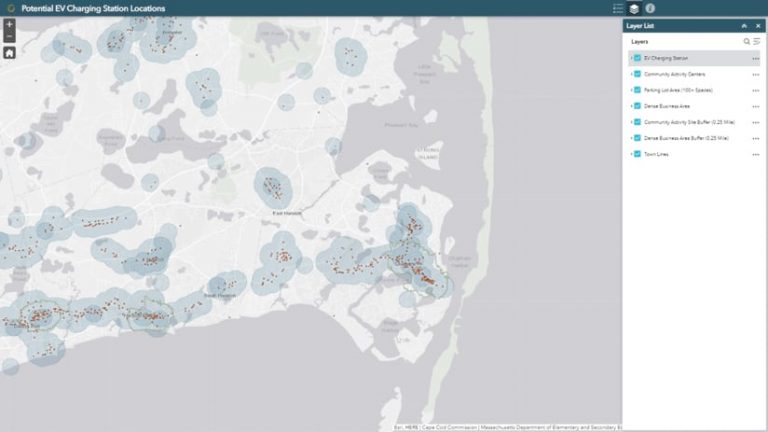
Applications are being developed to better understand and reduce the sources of greenhouse gas emissions as well as slow down the effects of climate change. These applications include mapping apps created using Esri software such as ArcGIS StoryMaps. One of the apps displays locations that would be optimal for electric vehicle charging stations. Another mapping app the commission developed is a large-scale solar screening analysis tool, which shows users areas that may be good locations for renewable-energy projects such as the installation of ground-mounted solar arrays or solar photovoltaic (PV) systems.
“Cape Cod’s climate-related hazards will only worsen unless bold action is taken,” Senatori said. “Created using a collaborative, data-driven process, the Cape Cod Commission’s climate action plan is designed to help our region mitigate the causes of climate change and adapt to its effects.”
Hearing from the People of the Place
One of the pillars of practicing geodesign is to elicit feedback from residents of the locale most affected by a new or changed design. They are the stakeholders whom Steinitz—a former Harvard University professor and a longtime advocate for and practitioner of geodesign—often calls “the people of the place.”
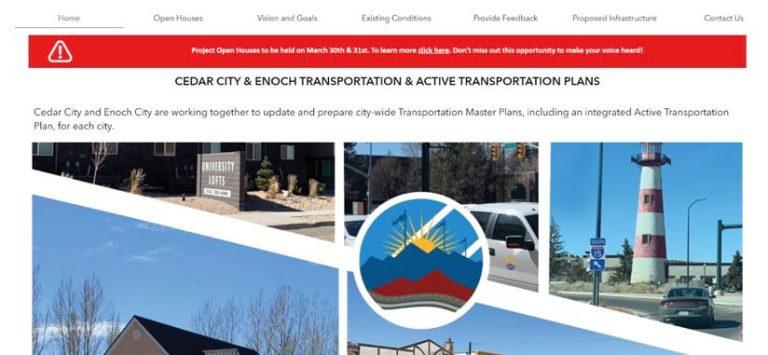
Emilie Jordao—a project manager at Avenue Consultants, based in Taylorsville, Utah—believes in hearing from residents when she works on projects. Her presentation, Planning with People: Fostering Participation and Public Buy-in during the COVID-19 Era, highlighted how her firm solicited feedback from hundreds of residents of two Utah communities, Cedar City and Enoch, on the cities’ transportation and active transportation plans. The two cities have a total population of 40,000 people and are experiencing rapid growth that calls for new transportation solutions.
In part due to the COVID-19 pandemic and being unable to meet with people face-to-face, Jordao used technology—Esri ArcGIS Online, apps such as ArcGIS Survey123 and ArcGIS Experience Builder, and the Crowdsource Reporter configurable application template—to survey and communicate with people online about various aspects of the plans. These plans included everything from designing roadway improvements to reduce traffic accidents to adding bike lanes and paved trails to increase recreational opportunities. On the ArcGIS Survey123 form, participants were asked questions related to walking, biking, choosing bus service, riding in car pools, driving alone, and using ride share options. Questions also were posed about transportation-related problems such as congestion, safety, connectivity, the lack of safe biking/walking paths, and the need for public transportation.
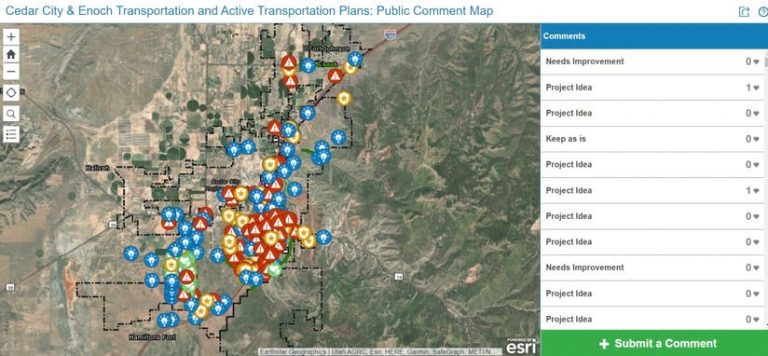
Using ArcGIS Experience Builder, people were able to pin a location on a map and leave a comment, express a concern, or propose an idea. The map was created using Crowdsource Reporter. Custom symbols were created to indicate an idea, a safety concern, an area that should be kept as is, and an area that needs improvement. One person, for example, left a hazard symbol on the map and commented, “Roundabout or light [needed] ASAP. This is a dangerous location.” Another person pinned an idea symbol on the map and suggested building a dedicated bike path alongside one highway.
Jordao said that using apps shouldn’t be the only way to get feedback, because some people may have no internet access or be uncomfortable with technology and would, therefore, be left out of the participatory process. But using ArcGIS Survey123 and ArcGIS Experience Builder created great public response, especially when the links to these applications were shared on social media by prominent local people such as the mayor, or on city websites and online news media outlets. “[We received] 573 survey responses and nearly 300 pins on the map,” she said. “We [also have] had over 1,300 views on our website since launching.”
For Jordao, the use of ArcGIS technology to solicit response about the transportation plans was successful. “We had great feedback from users and clients alike,” she said. “ArcGIS Experience Builder works more like a mainstream website, with a multipage environment and easy navigation, so users felt comfortable navigating through it and providing feedback. For me, it was a relief to be able to set up a website, comment map, and survey in [ArcGIS]. In the past, I used three different platforms for the same task, which resulted in having to acquire different subscriptions and having to download data three different ways. Keeping everything within ArcGIS Online saved me a lot of time during the data download and curation process. Also, because all the [software products] are based on the same environment, they interact more seamlessly with each other, which also saved me time.”