
January 21, 2021 |
Brooks Patrick | Infrastructure
December 14, 2021
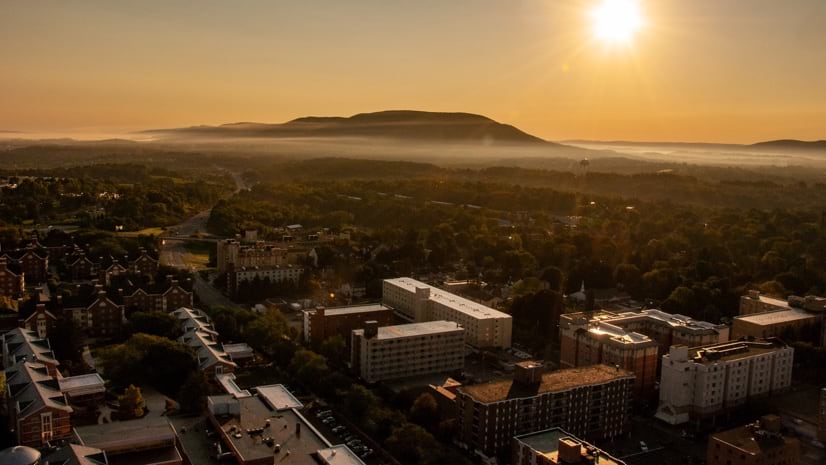
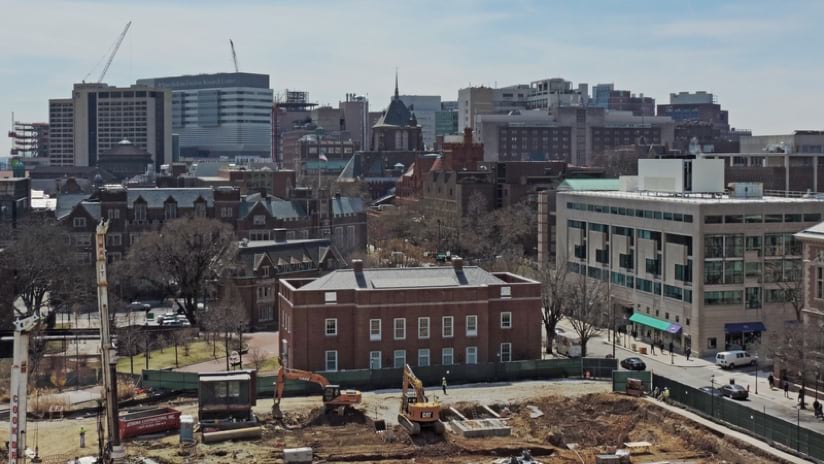
Everyone in State College, Pennsylvania—home to Penn State University—is faced with adjusting to the city’s transformation into one of the densest of its size in the nation. With a population of 42,000 squeezed into four and a half square miles, the downtown area’s unique geography leaves nowhere left to build but up.
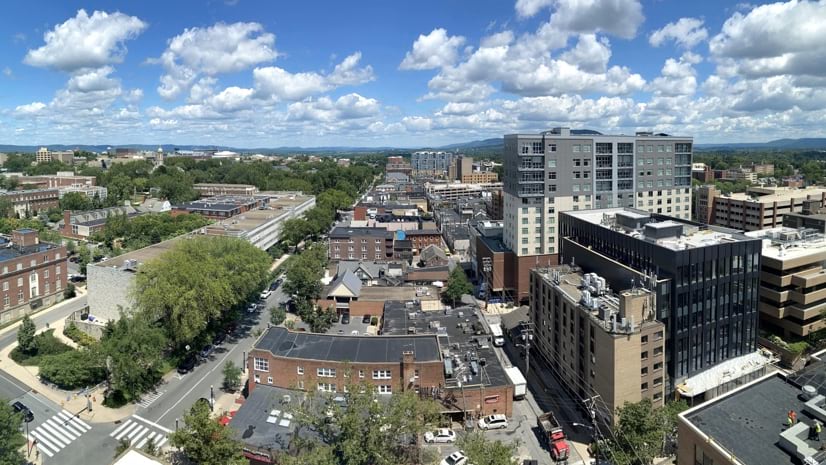
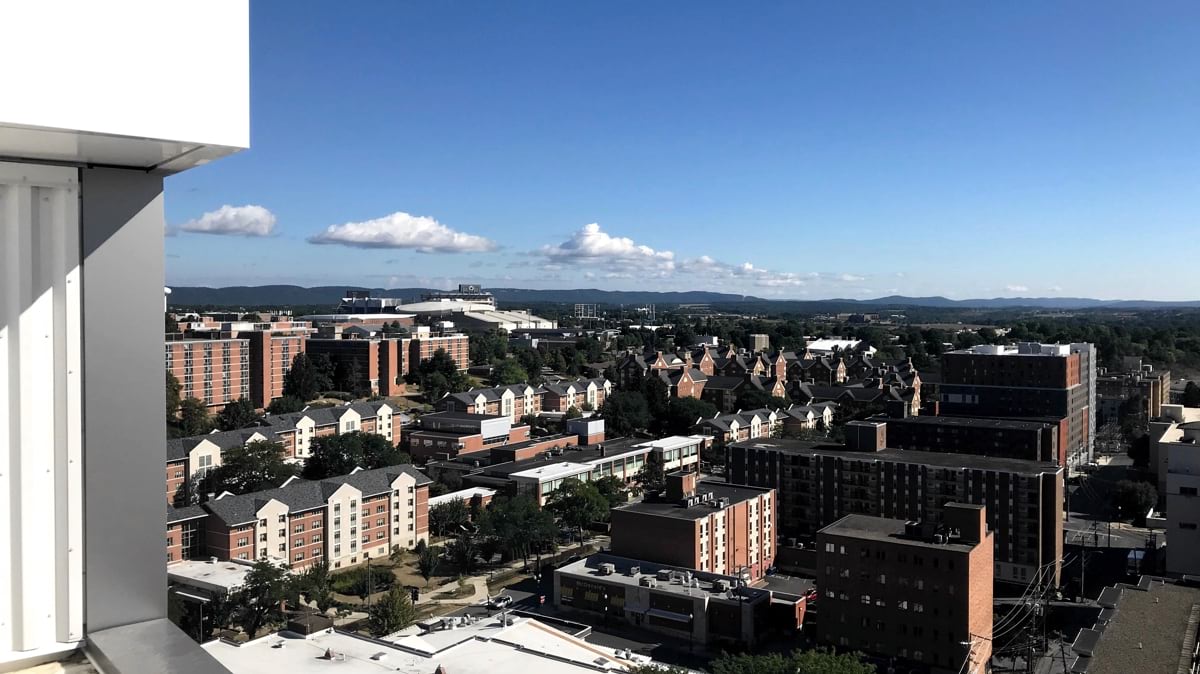
Tall, mixed-use, luxury apartment buildings, often covering an entire city block, with retail and office space on the lower floors, dominate the recent construction. Many of these high-rises are aimed at Penn State students looking for off-campus housing, with perks like rooftop pools and other “resort style” amenities.
For residents, the construction whirlwind can be off-putting. “We’re seeing the biggest building boom since the 1970s, and we wanted to be in a better position to explain what’s happening,” said Ed LeClear, State College’s director of Planning and Community Development.
To track and share information about the rapid development, LeClear and his team are using geographic information system (GIS) technology. GIS allows them to visualize changes and analyze impacts on residents and the local economy. They can also share plans and progress via online maps and 3D models with residents who are increasingly interested—and in some cases concerned—by the changes to their town.
Across the country, student housing projects are part of the trend of real estate speculation funded by private equity. Bigger and nicer apartments are transforming college towns with investors reaping returns from the steady stream of students needing a place to live. The boon means many college towns have taken on a more urban character in recent years.
Colleges and universities welcome the new development because it attracts new students and brings customers to downtown businesses. Firms like Blackstone have invested billions of dollars to amass thousands of student housing beds. CoStar, a real estate data firm, puts the value of the market at $100 billion.
In State College, The RISE opened in 2016 for students “double majoring in luxury and style,” and The Standard opened in fall 2021 with promises of “modern student living for trendsetting students.” Another 12-story luxury apartment building will be breaking ground soon.
In the short term, the real estate frenzy has been positive for renters. “We’re starting to see vacancies in other apartment buildings because we’ve added 8,000 beds, and Penn State’s enrollment has barely gone up,” LeClear said. “We’re seeing more power for tenants to negotiate a 10-month lease instead of the traditional 12-month lease, and a lot of the owners of buildings from the 1950s and ‘60s are rehabbing them.”
The confluence of money and investors looking to buy student apartment buildings parallels an overall expansion in the housing market. The prior average of $106 per square foot for an apartment building has been eclipsed by a transaction that reached $575 a square foot. “No one has ever seen numbers like that in State College, and that’s just to buy the land,” LeClear said. “They plan to demolish the building and put up a new one.”
The city council passed more lenient zoning in 2013 that opened the downtown area to the larger and taller buildings. Builders have responded favorably.
Chicago-based firm Core Spaces recently finalized the purchase of the Park Hill Apartments for $23.1 million. In a statement, the vice president of new business, Chip Schell, said, “We are naturally drawn to downtown State College for several reasons. We love areas that are vibrant and charming like downtown and near one of the top academic institutions in the country. We believe these characteristics will always be in high demand.”
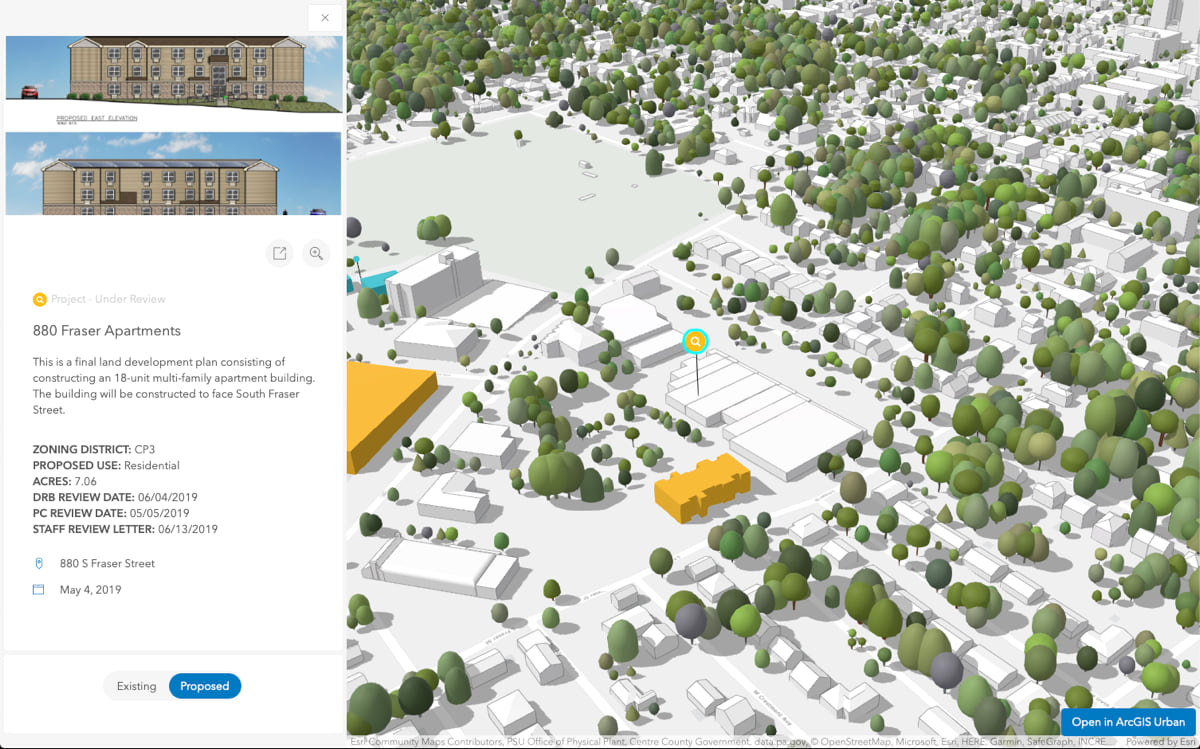
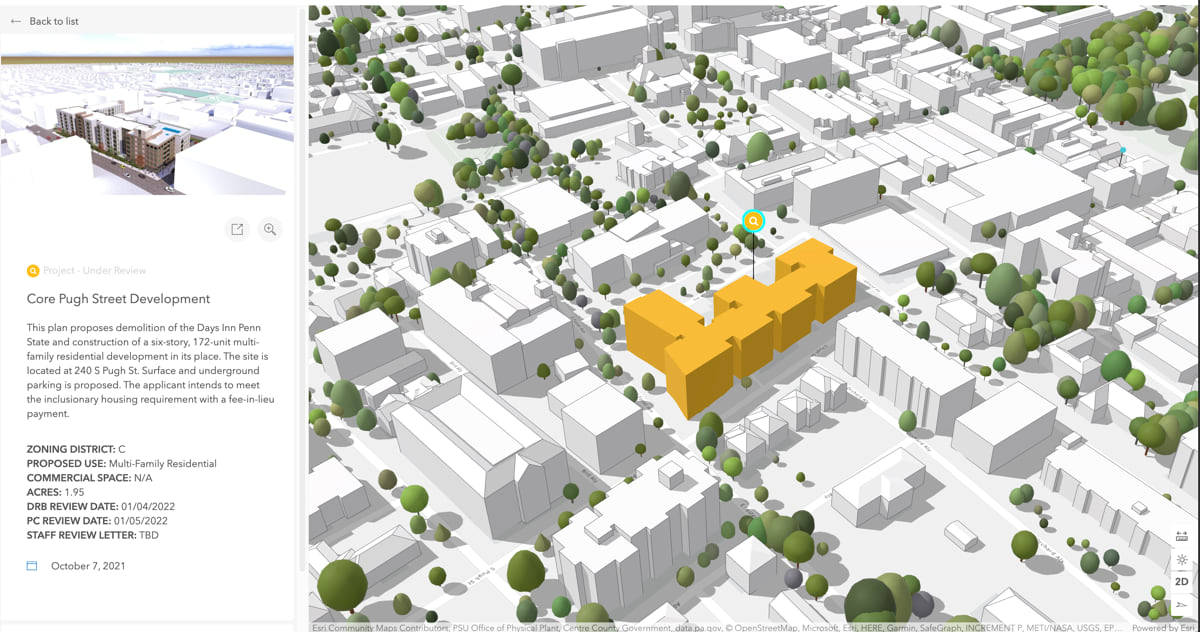
Overlapping and shifting project timelines make it difficult for State College planners to keep residents updated on new developments. To be more transparent, the city recently launched a 3D map showing location-based data for each development plan.
Some of the complaints that planners hear come from alumni who just lost their favorite hang-out as older buildings are demolished to make way for new ones. For full-time residents, it’s been tough to see recent plans to demolish an iconic hotel and restaurant and replace it with student housing.
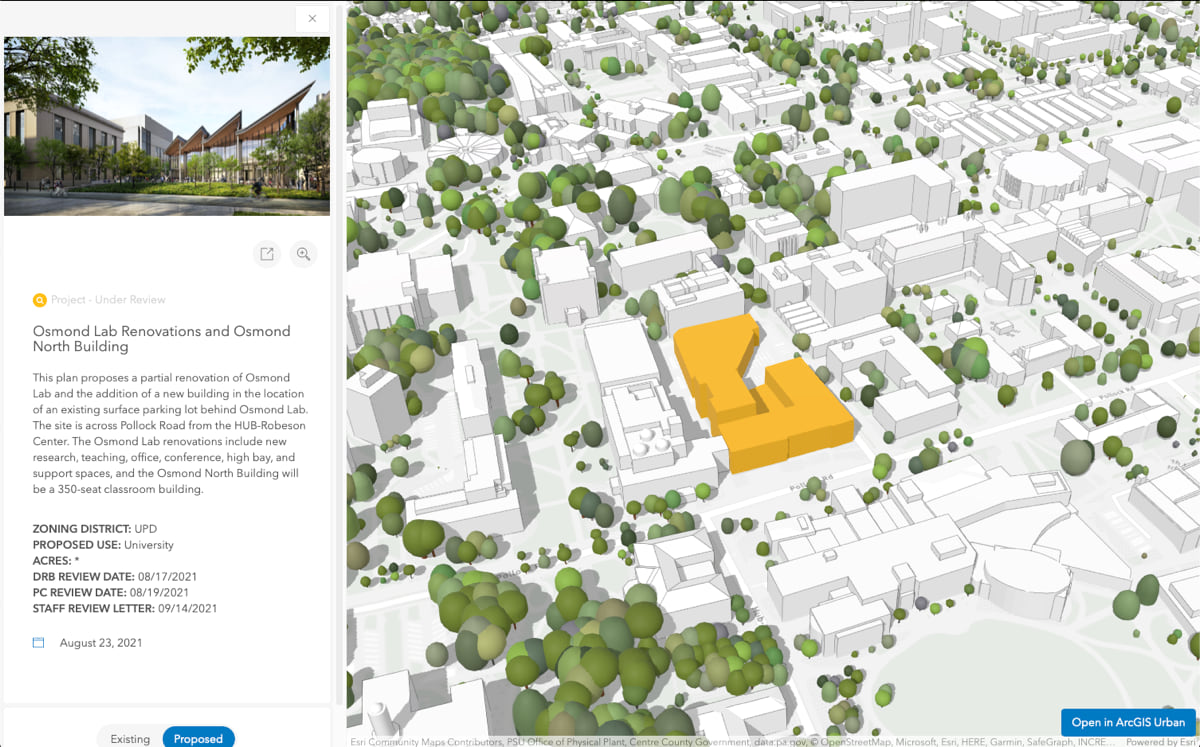
To get a sense of how downtown is changing, LeClear teamed with colleagues Greg Garthe, a planner and zoning officer with a background in GIS, and Brian Fahringer, a GIS analyst who brings visualization skills from a prior job at an engineering firm. The team created a digital twin, a combination of a map and a 3D model of buildings and infrastructure, using ArcGIS Urban, a web-based 3D application that supports scenario planning and impact assessment.
The digital twin enables the team to share and compare features, such as heights and setbacks, and see how streetscapes are changing. For city planners, the look of downtown is important, but so is the economic mix that contributes to the city’s vitality.
“The hotel building is nothing hold up as historic architecture, but the hospitality use is something we’re sad to see go,” LeClear said. “There’s a lot of attention being paid to the loss, so being able to show the change has been important.”
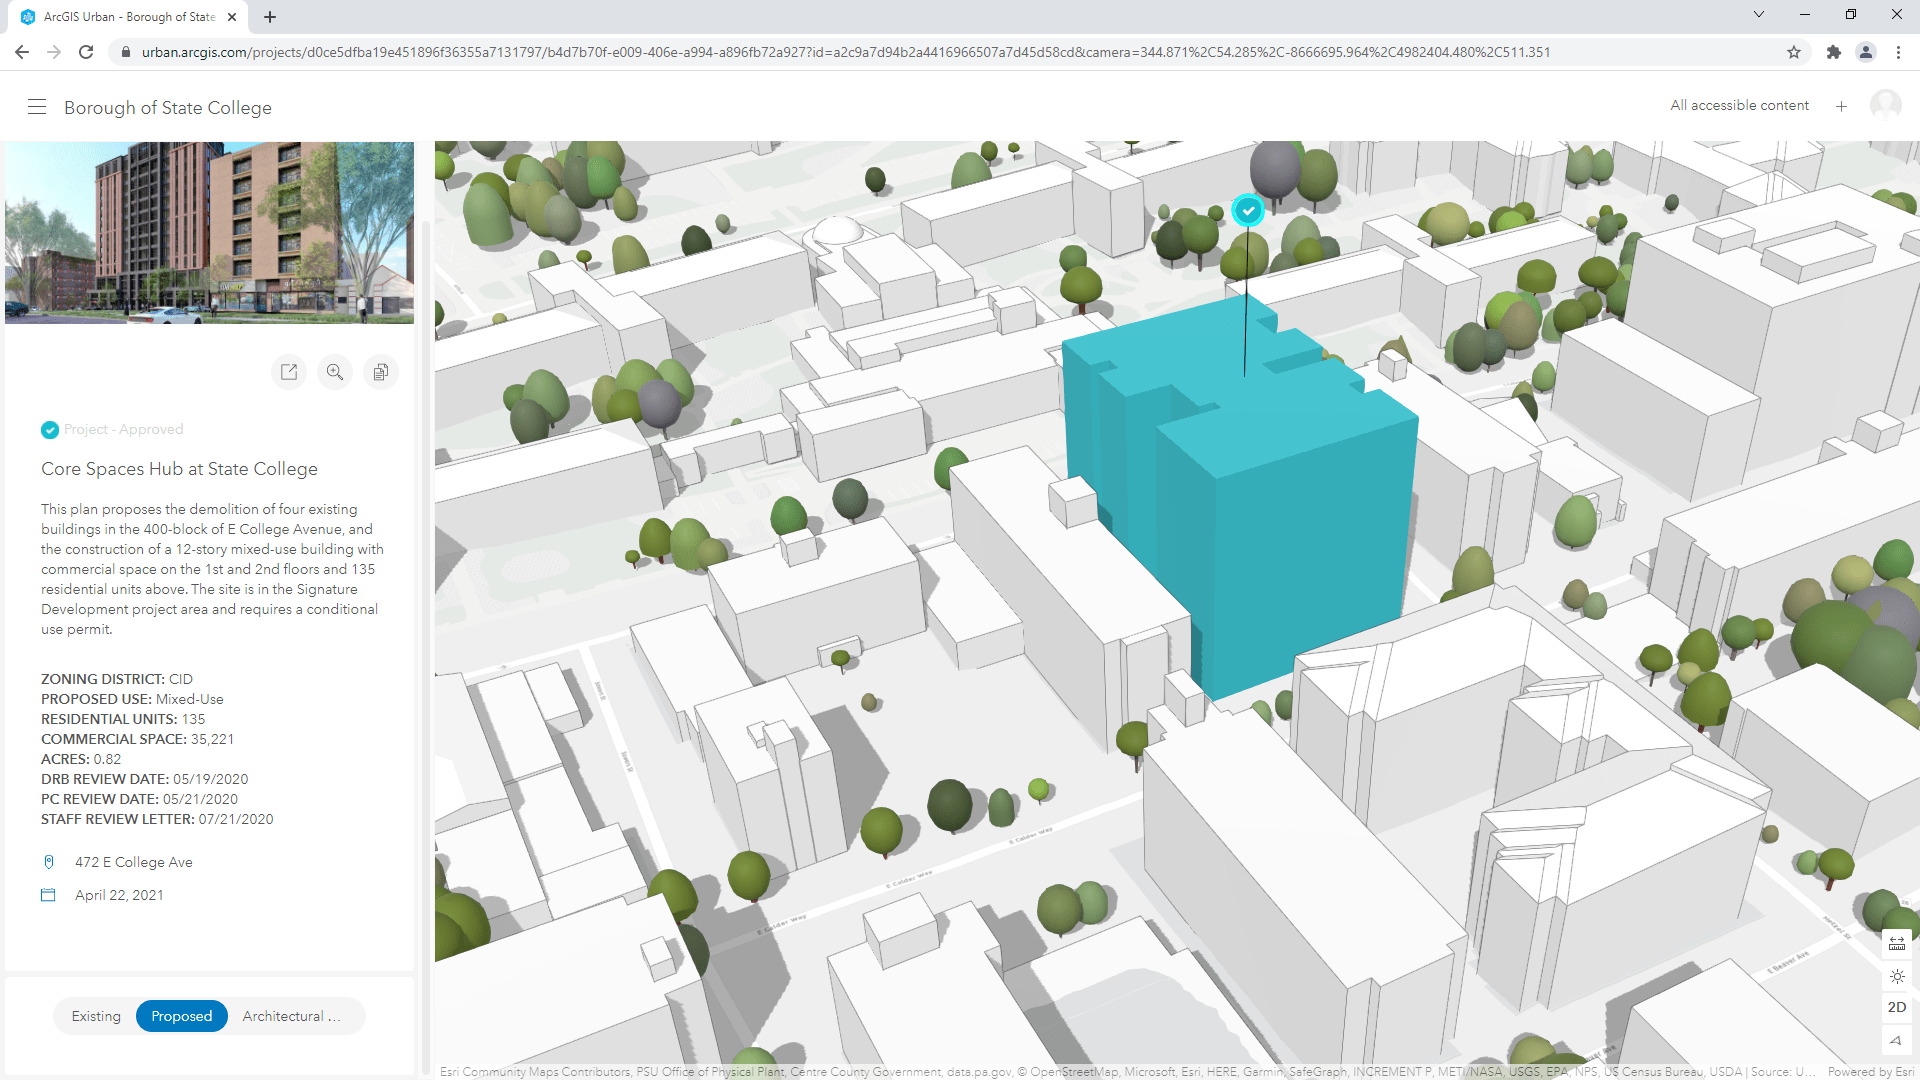
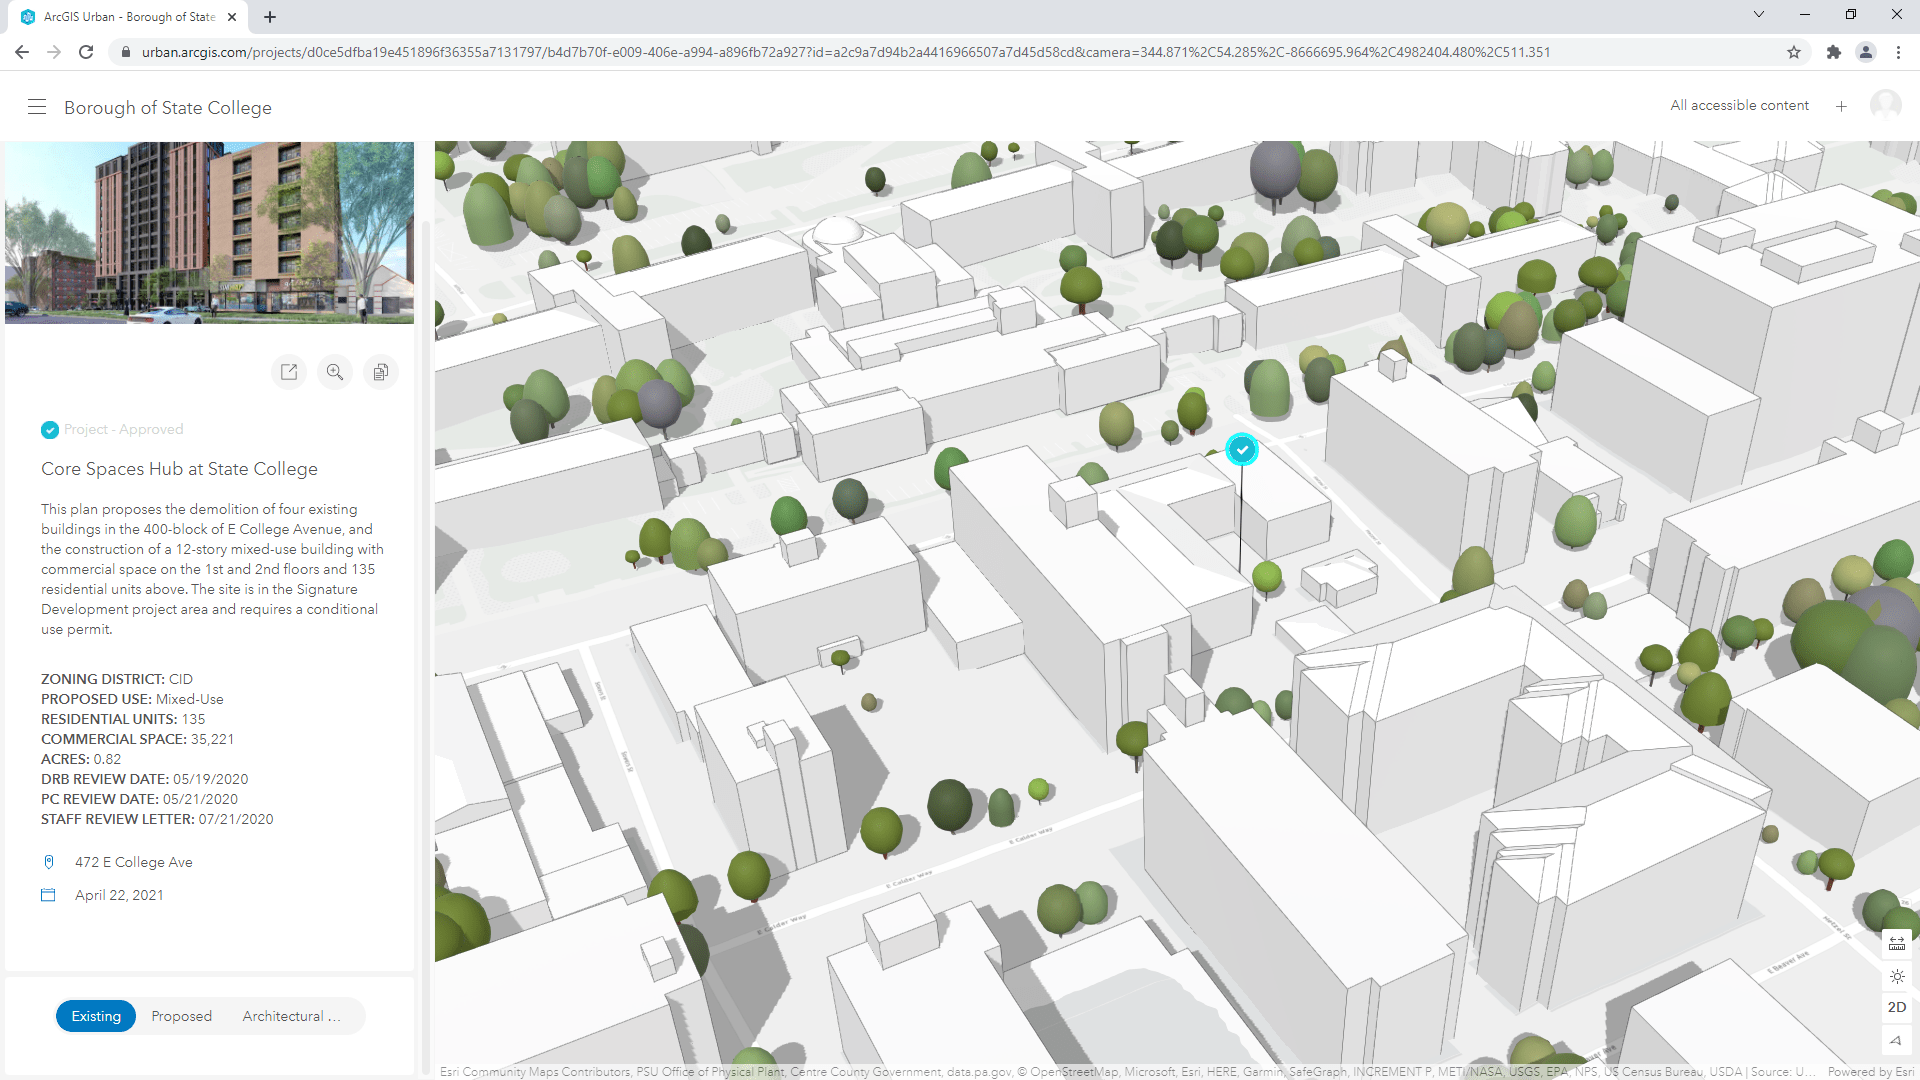
LeClear and the other planners shared a walk-through of the downtown’s digital twin, modeling how the new towers have transformed the area. Viewing the recently approved Core Spaces Hub at State College project, “you can see that The RISE building forms a gateway coming into town but the surrounding buildings are relatively modest in comparison,” Garthe said. “Then if we flip to the proposed view of the area, you can see how the new Core Spaces building will completely change the look of the eastern gateway into downtown.”
The team continues to add detail to the model, and Fahringer hopes to have a drone capture imagery data soon. Toggling between images of existing structures and renderings of proposed construction helps the planners visualize and illustrate potential impacts to the landscape.
By using the digital twin to compare The RISE project to the Core Spaces Hub building from all angles, the team can see precisely how the new building will stand out. Though it’s roughly the same height as The RISE, the Core Spaces Hub is higher up a hill, which makes it look two stories taller.
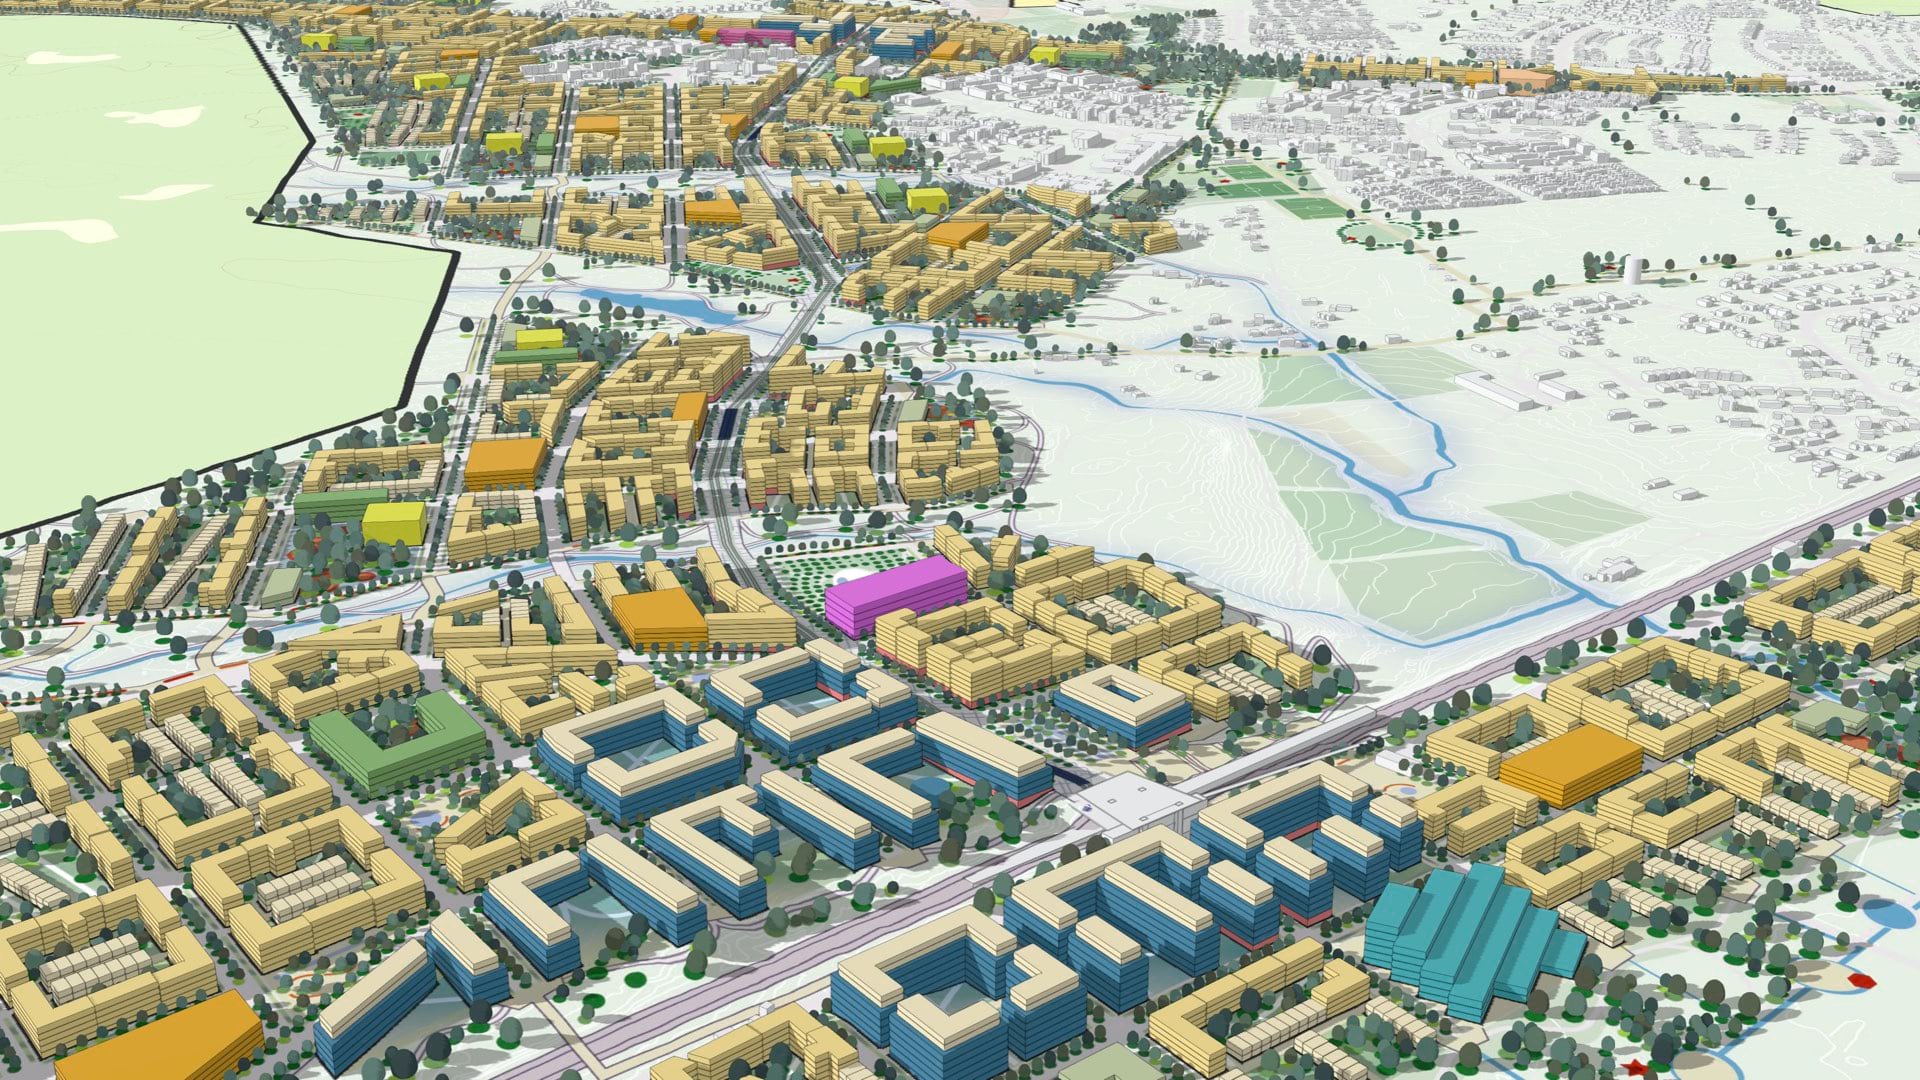
The digital twin also helps in preparing for new development. “The university has been putting a massive amount of investment into its West Campus, which is immediately adjacent to a somewhat under-utilized neighborhood called West End,” LeClear said. “There’s a lot of potential redevelopment energy that could happen over there, but it’s hard to get people thinking about what could be.”
Planning department staff are in constant conversation about how to create an environment that supports new development projects that don’t clash with the existing downtown. Planners must answer questions about the look and feel of the city, and they often present visualizations of their answers to city officials and the public. They make maps and models and share examples that show how the city is now, who is served and impacted, and what the city could become.
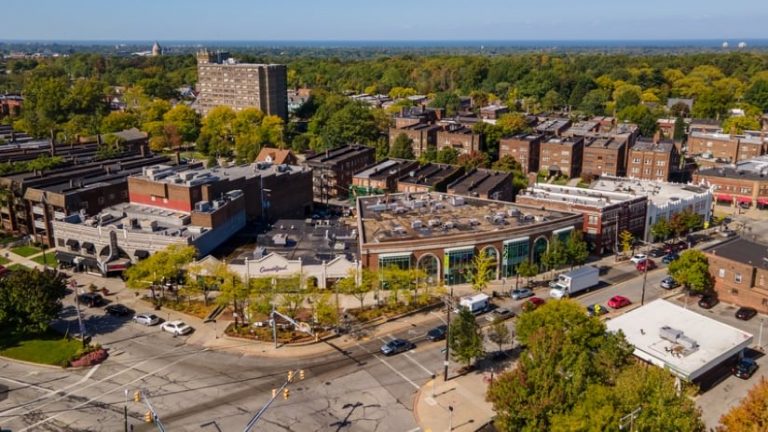
“I’m a huge fan of the development that was done in the ’20s and ’30s,” LeClear said. “Whenever I travel to a city I haven’t been to before, I try to find the Cleveland Heights of that city. Those initial suburbs of that era aged incredibly well. We got away from that for decades, and now we’re getting back to it.”
The State College city council recently approved a planning department proposal for an economic feasibility analysis of their comprehensive rezoning effort. An outside firm will use GIS and other tools to conduct analysis and create development prototypes based on potential zoning changes. Planners, elected officials, and the public can use the results to gauge the impact of future development. The planning department plans to use once again ArcGIS Urban to help all stakeholders visualize these potential changes, which may play a crucial role in the council’s decision making.
The visualization tools will be especially helpful in 2022 when the city will usher in three new council members and a new mayor. The incoming officials ran for election as a group, with affordable housing as one of their main planks. Their win signals that balancing luxury with affordability is top-of-mind for most residents.
As the new leaders take office, LeClear and his team plan to lean on their GIS maps and models to help developers and the city find that balance for residents. “This digital twin tool will be helpful to orient new local officials about the issues,” LeClear said.
Learn more about smart city planning with GIS.