
January 21, 2021 |
Brooks Patrick | Infrastructure
June 2, 2021
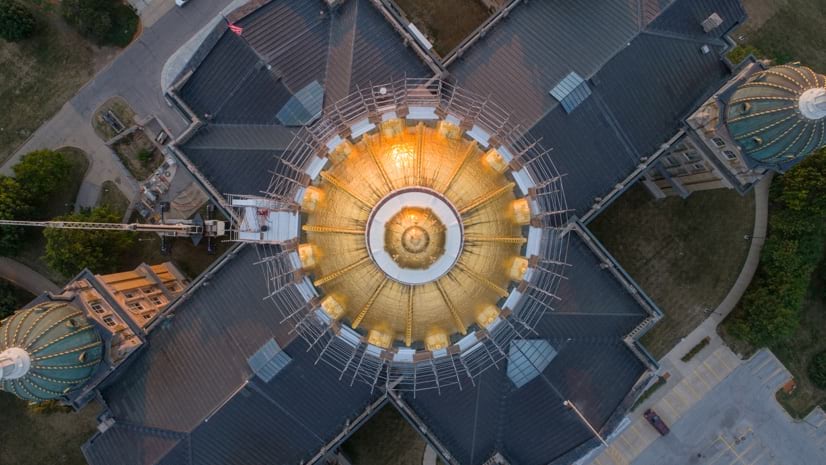
Principal Park is a great place to view the historic past of Des Moines. As the homefield for the Iowa Cubs, the city’s Triple-A Minor League Baseball team, the stadium affords a picturesque view of the Iowa State Capitol, beyond center field. Iowans are justifiably proud of their statehouse. The building, constructed in a Renaissance style and topped by a gold dome, is a fixture on lists of the nation’s most beautiful state capitols.
But what about the future of Des Moines? Until recently, it seemed like a proposed reinvigoration of a neighborhood on the far riverbank could threaten that ballpark view. Using a cutting-edge geographic tool, city officials found a way to green-light the project while preserving the view.
The capability for such spatial analysis is arriving at a crucial time as shifting demographic patterns and spiraling living costs on the coasts and Sunbelt are resulting in a resurgence of interest in the Midwest. In Des Moines, the population of the region increased by 15 percent between 2010 and 2018, making it the Midwest’s fastest-growing metro area. In 2014, The Atlantic declared moving to Des Moines “the most hipster thing possible.”
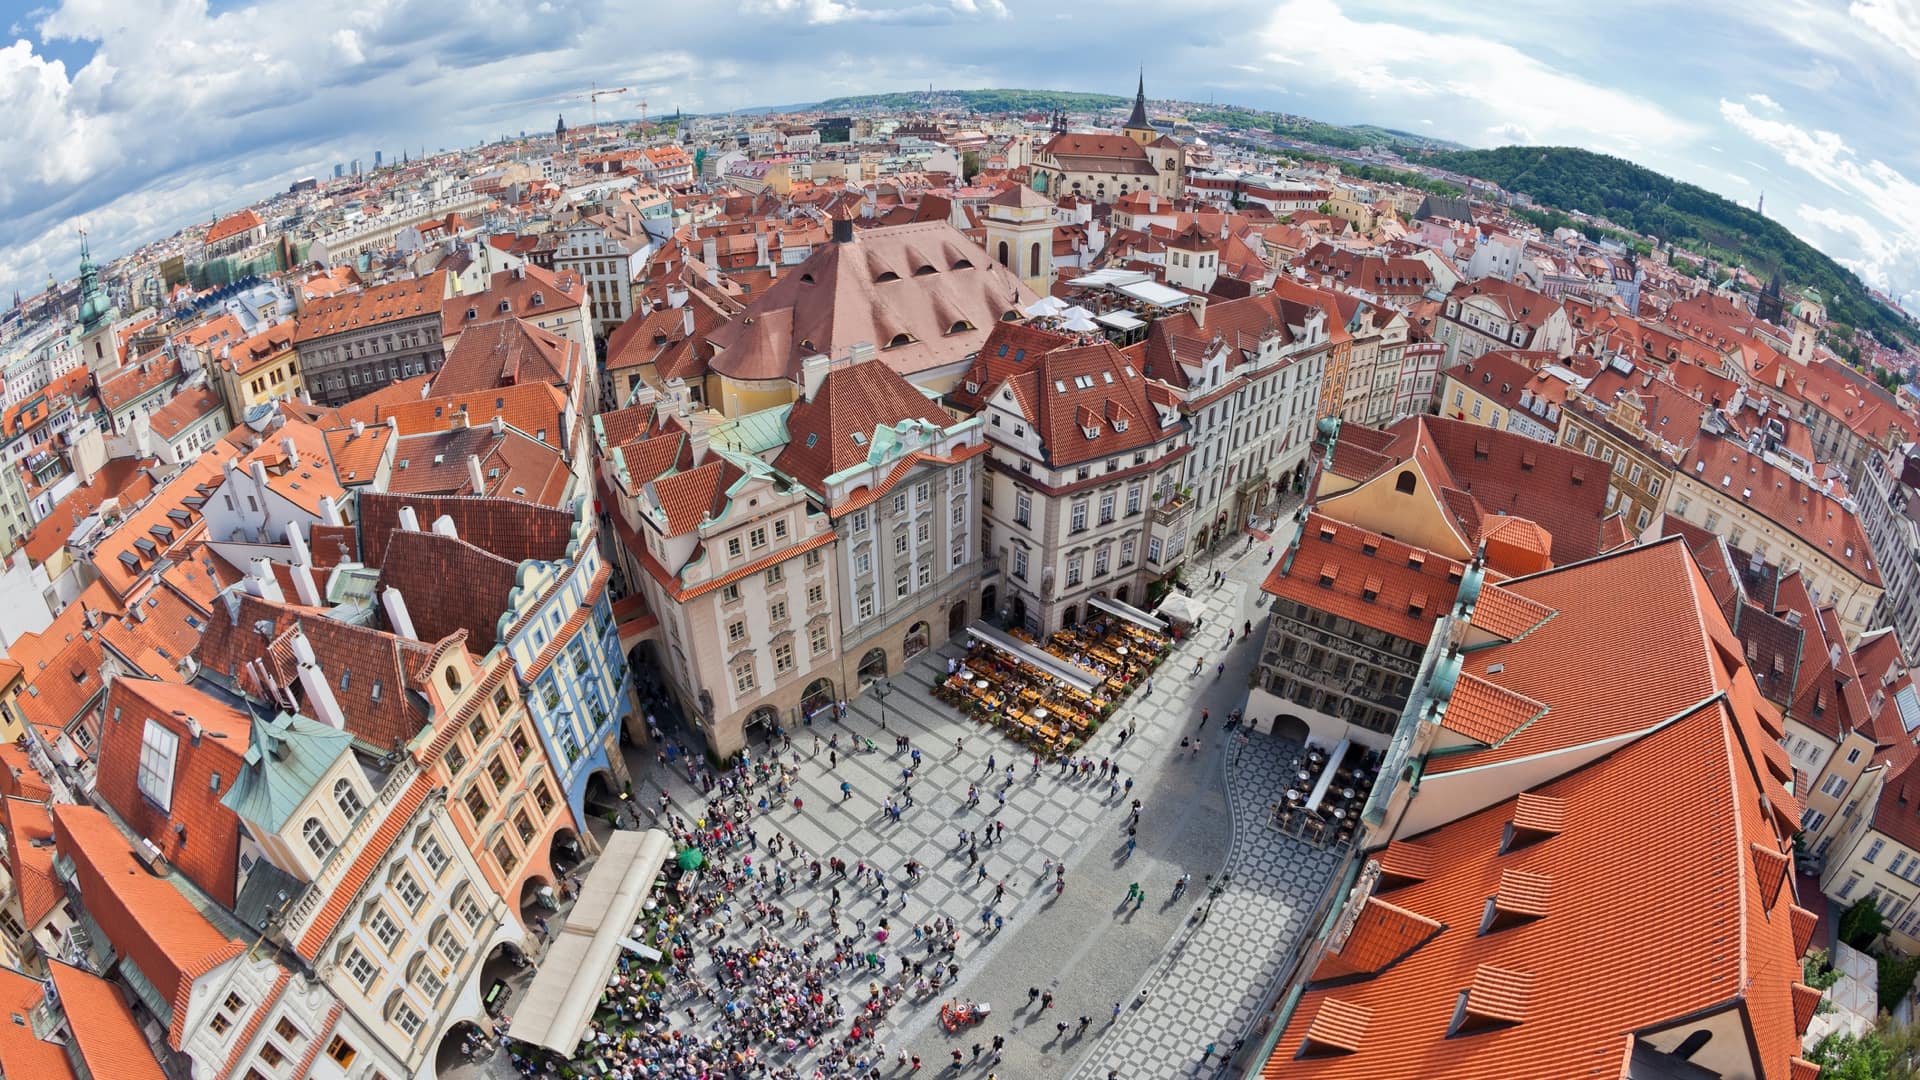
In past eras, this might have been a boon to Des Moines suburbs. Today, more people want an urban experience. What better way to provide that experience than by reinvigorating a well-preserved but neglected reminder of the city’s bygone urbanity? Enter the revitalization of Des Moines’s East Village, which stretches from the statehouse to the riverbank, a longstanding project just waiting to be revived.
“You could tell that the neighborhood had that cool, urban vibe that a lot of people seek out,” said Ryan Moffatt, City of Des Moines economic development coordinator. “It was the next natural path of urban development. It’s adjacent to downtown, it’s on the city’s waterfront, and it’s near a recreational trail system. Plus, it’s got a great view of the downtown skyline.”
The southern part of the neighborhood also lies between the statehouse and Principal Park, and that raised the specter of blocked views from the ballpark. In 2017, the city began to take a closer look at a 2002 City Council agreement that capped building heights at 75 feet. A vision to expand the East Village as a “walkable, dense mixed-use neighborhood began to emerge,” Ludwig said, “with green architecture and a focus on sustainability.”
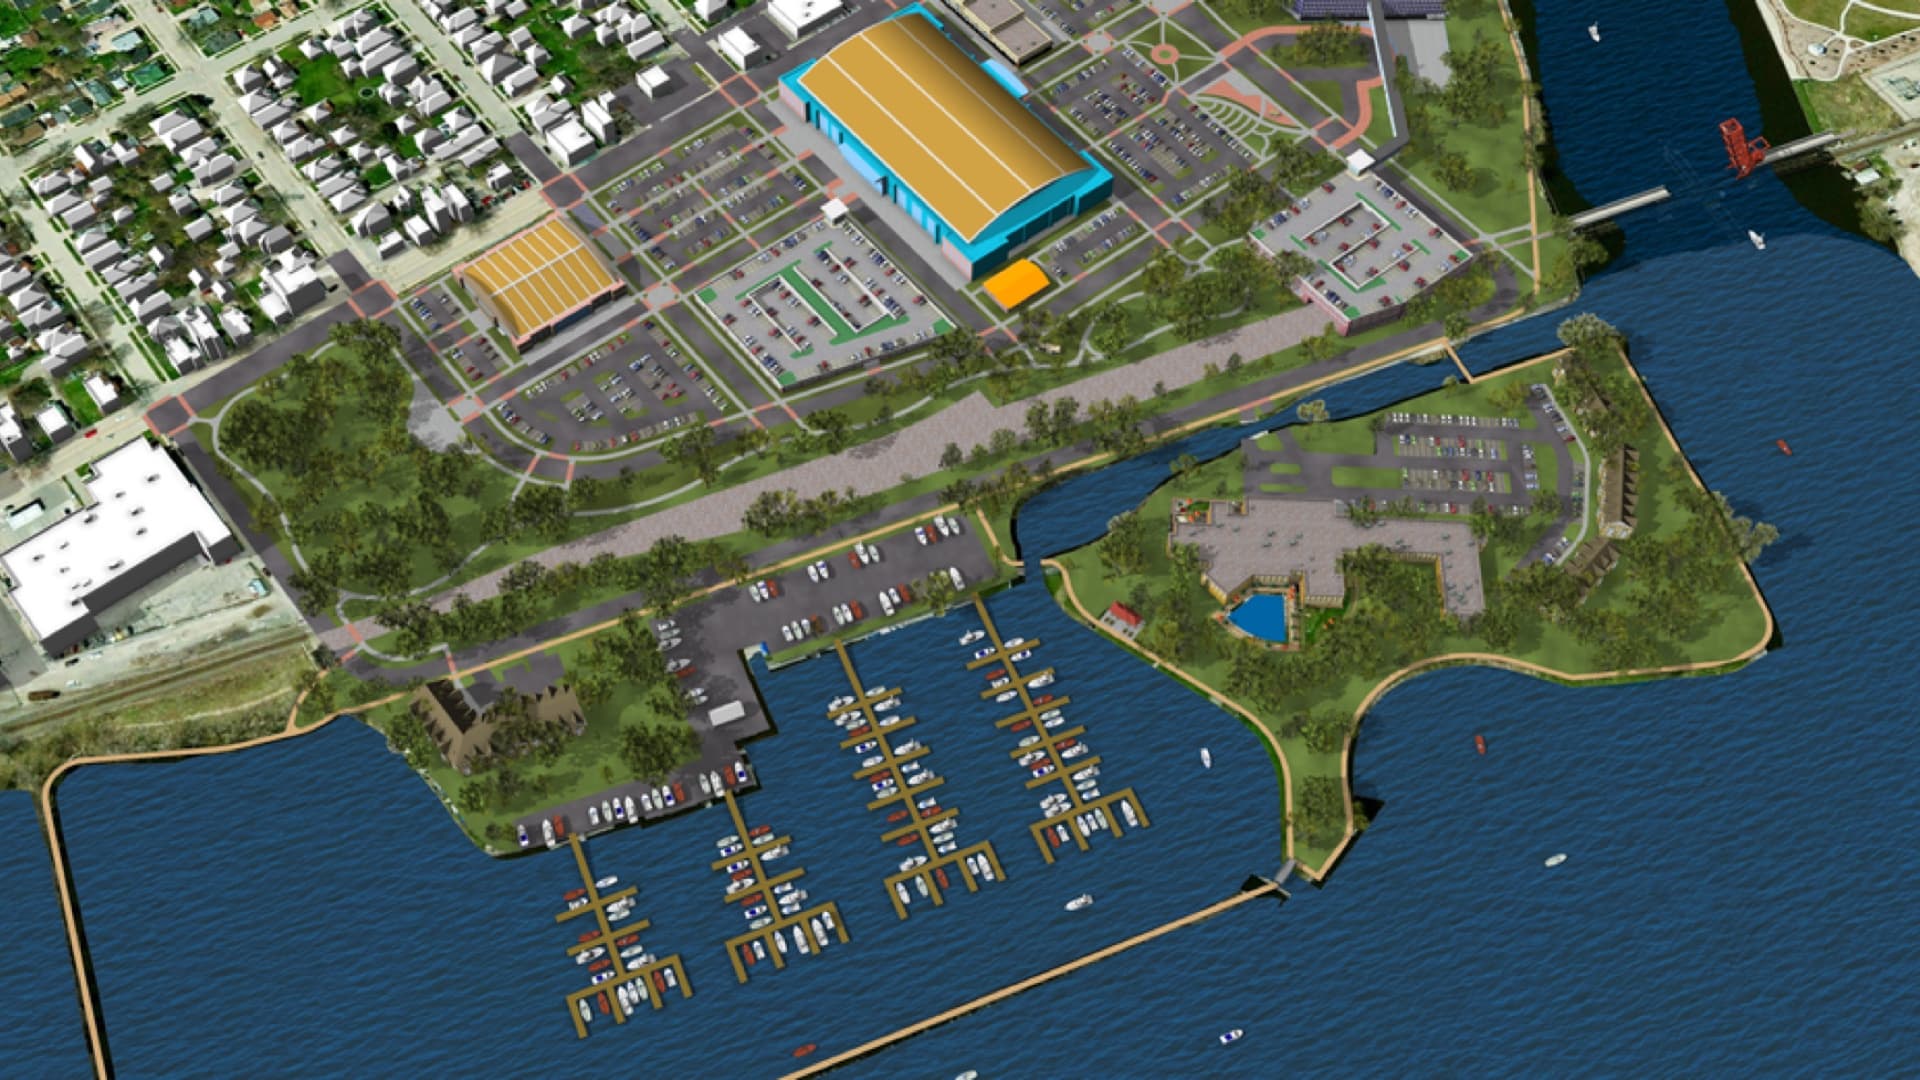
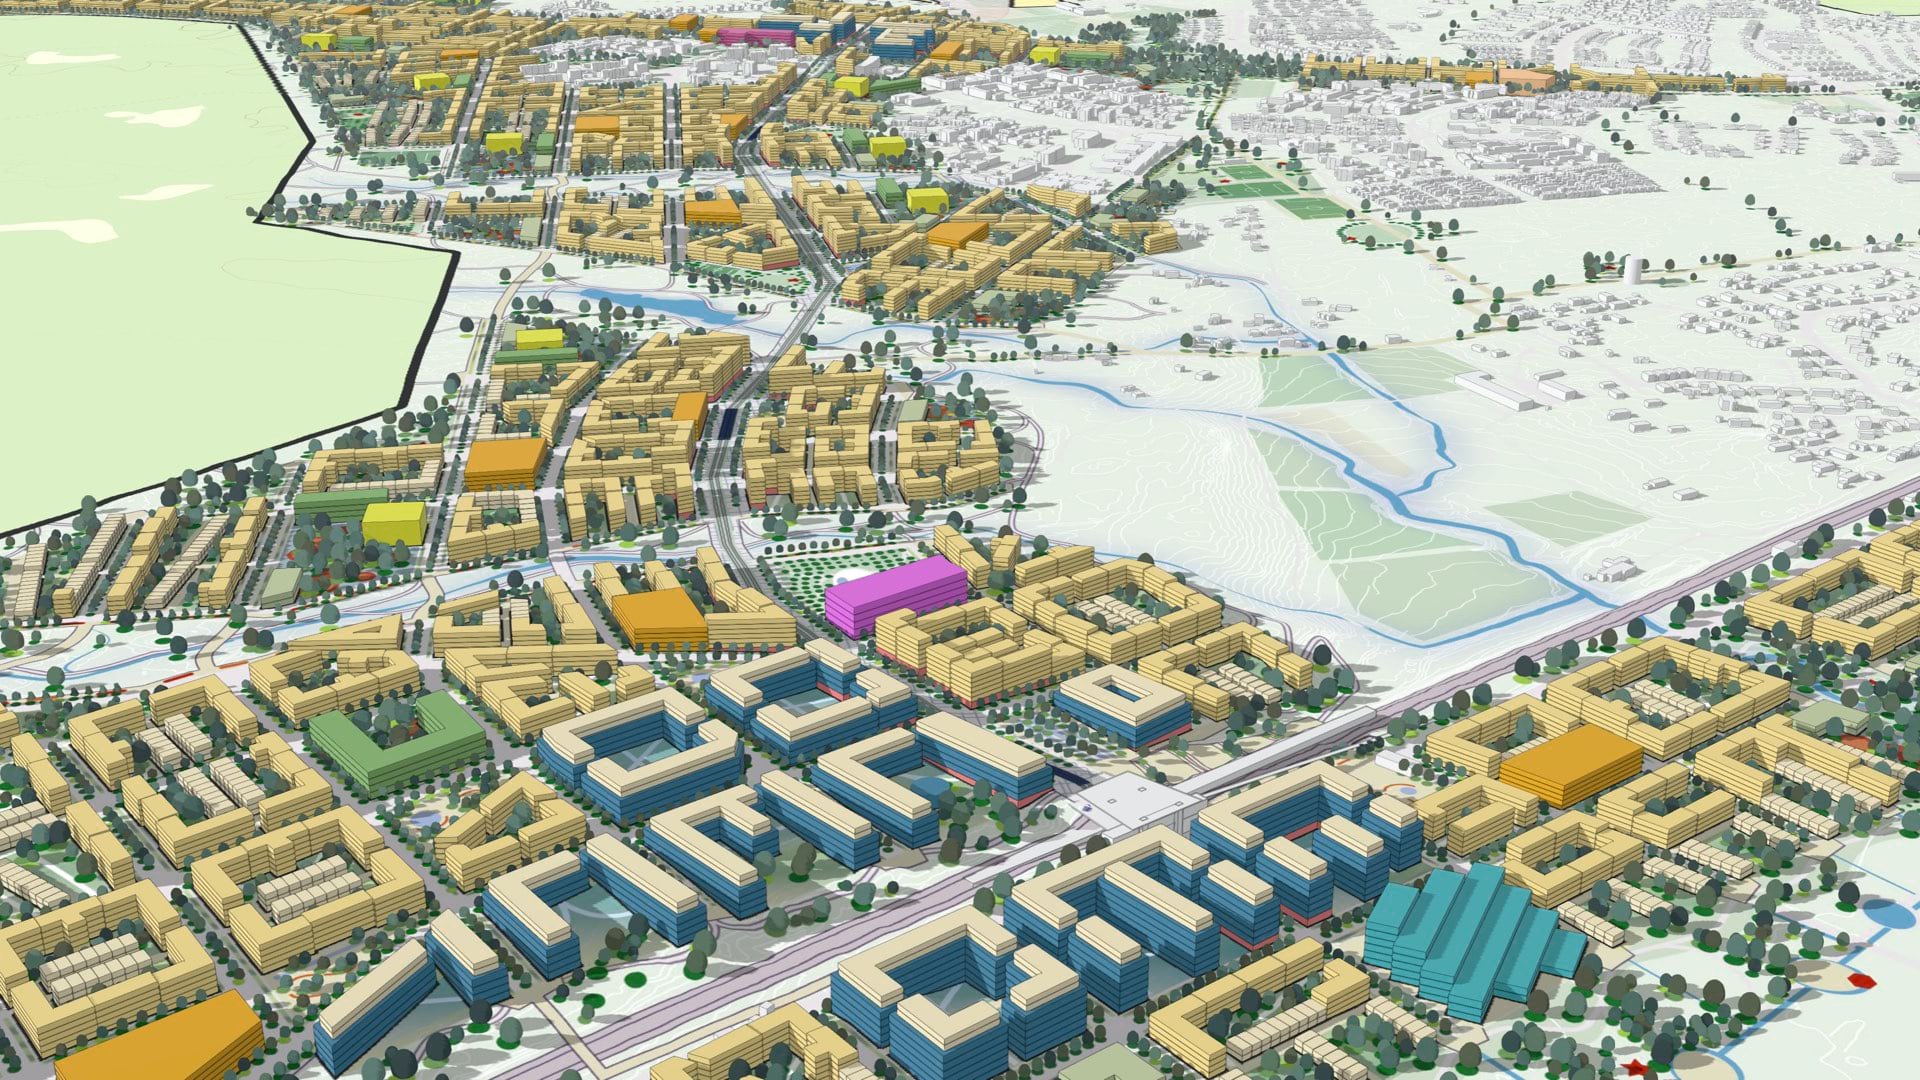
JSC Properties, a local developer, floated a proposal to create that neighborhood, transforming 40 acres of the East Village into what would be called the Market District. The plans were embryonic, but they would almost certainly include buildings that rose above 75 feet.
JSC estimated that the total cost of developing the Market District would be around $750 million. That figure is about 10 times as much (in inflation-adjusted dollars) as the cost of the capitol’s construction in the 19th century.
That represented a huge investment in the city’s future, but was it worth besmirching the fans’ vision of Des Moines’s shining beacon on a hill?

The situation was not necessarily intractable. Although the 75-foot rule was legally binding, it was merely the best guess at the time by planners who did not have the benefit of today’s technology for urban planning and economic development.
More specifically, modern geographic information system (GIS) software with reality capture, imagery analysis, and advanced visualization, offered a way forward.
“The developers were talking about space, but they couldn’t visualize it,” said Aaron Greiner, City of Des Moines GIS manager. The city was considering hiring a consultancy, but Greiner proposed a different option.
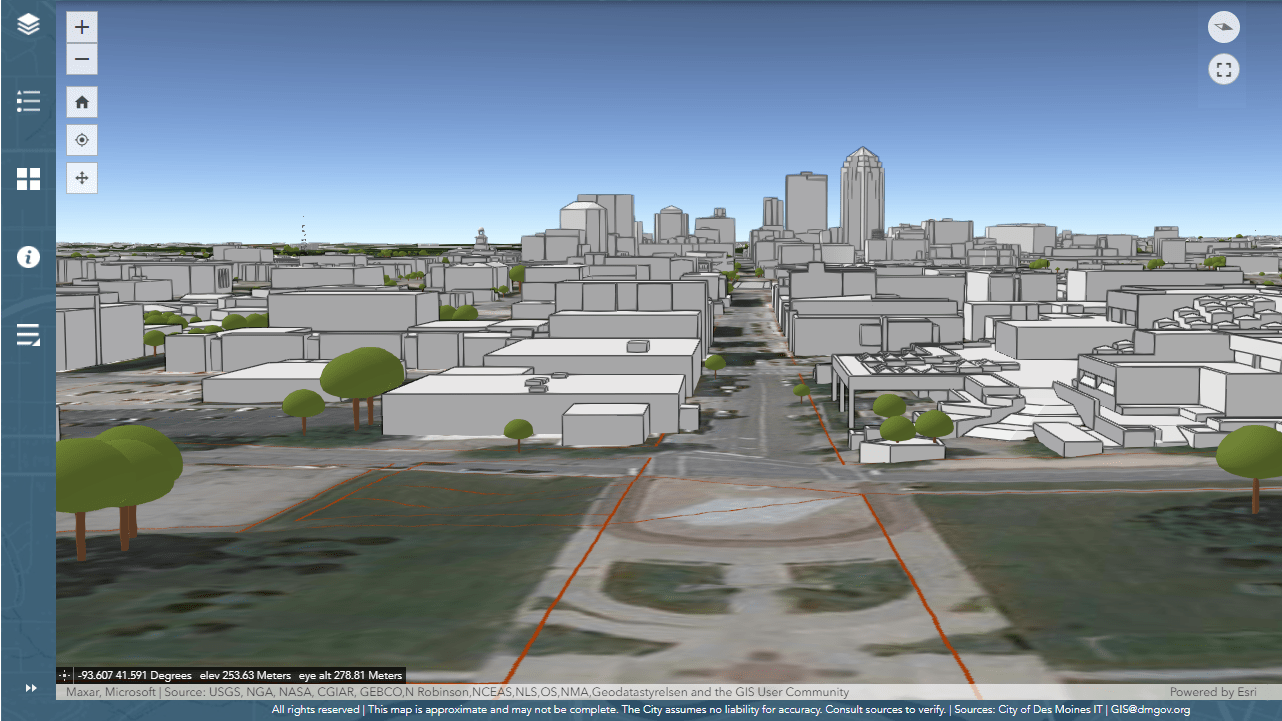
For $20,000—a fraction of the cost of using outside consultants—the city could hire an aerial imagery company to fly over the area and take lidar readings. Greiner’s office could then use the lidar data and GIS software to build a 3D basemap.
Greiner was describing the creation of a “digital twin,” a virtual representation of the processes, relationships, and behaviors of a real-world system. The concept originated in manufacturing to keep detailed records of factories and assembly lines. More recently, digital twins have been used to analyze geographies in real time.
For city planners, a digital twin functions as an authoritative crystal ball. The idea is not to create a record of the way things are (or were), but of how they might be if certain changes are made to the city.
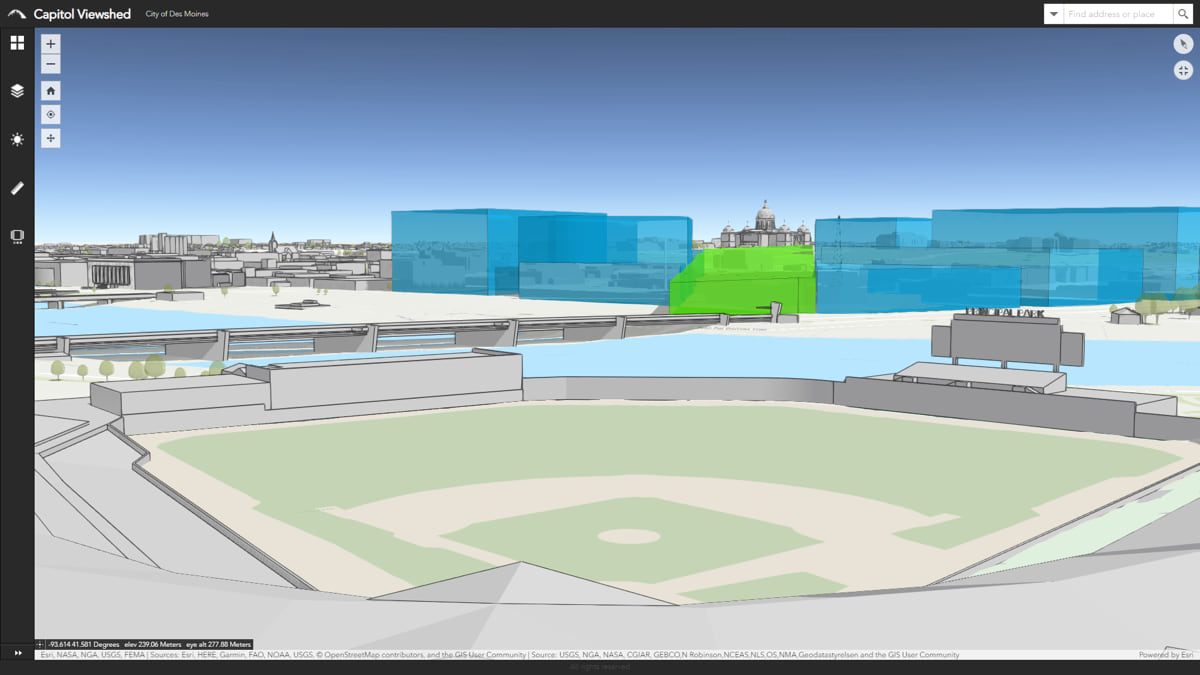
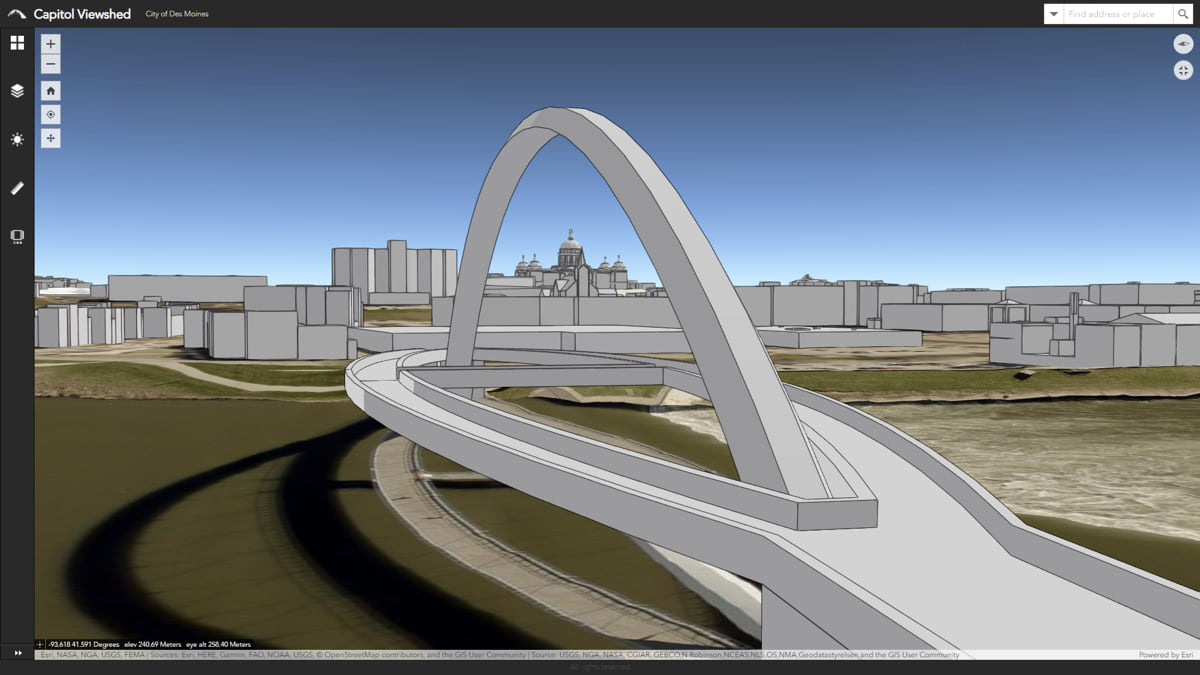
Erik Brawner, a GIS analyst for the City of Des Moines, recently demonstrated how the digital twin has helped make the Market District possible. After calling up the 3D map on a monitor, he “flew” into Principal Park, showing the perspective from just behind home plate, the spot where a catcher crouches. Out in the distance, the statehouse was visible on the hill.
Brawner pointed out green shading that extended beyond the stadium. “That’s the original viewshed, defined by the original 75-foot rule,” he said.
On the fringes of the green were some blue areas. “That’s the rest of the development area the developer is proposing,” he explained. “So the digital twin is showing the height that buildings could go up to and not create too much of a tunneling effect on the view.”
Working with the digital twin, JSC could collaborate with planners like Michael Ludwig, deputy director of development services for the city of Des Moines, introducing models of proposed buildings and seeing the visual effect they would have.
“This has blown his mind,” Greiner said of Ludwig, “because in the past, they’d go out and do hand measurements, then put it on graph paper and scale up. They’d spend weeks, if not months, doing calculations.” Now, he said, it was merely a matter of dropping building models into the digital twin and observing how they impact the view.
Last year, JSC and the city used the digital twin to conduct an extensive viewshed analysis, discovering that some buildings could indeed extend above 75 feet without obstructing the view. Using the findings, the city approved a new ordinance in January that codified how the Market District could proceed.
While the other viewsheds have not yet been tested, Ludwig explained, Principal Park offered an important proof of concept. “This was the big one,” he said.
“Balancing the desire any city council would have for $750 million in development with the desire to protect aesthetics and the view of the capitol building, this has been an extremely valuable tool,” he added. “If we didn’t have it, they would’ve probably said, ‘Forget about that 20-year-old agreement—we can’t pass this up.’ What this really helped us do was find a happy medium.”

The tool is poised to help Des Moines manage its growth—especially as more people realize that with remote work increasingly the norm in the post-pandemic world, they can work from anywhere. As the Market District evolves with these new arrivals, the 3D basemap that began as a way to preserve a ballpark view will help facilitate the overall development and design.
“When the individual projects come into the area, they’ll give us their building plans in whatever form they have,” Ludwig explained. “We can plug them into the model and see whether they’re projecting through the zoning restriction ceiling, and quickly evaluate them.”
The GIS office plans to make the digital twin available to other City offices. As more data increases the complexity of the tool, these managers will find new uses for it that enhance overall understanding of the area.
“Just this week, I got an email from the parks department, asking if they can use it for shadow modeling, because they’re interested in finding a place for a community garden that would have adequate sunlight,” Greiner said. “We haven’t quite tackled that one yet, but we will.”
Learn more about how planners use GIS for urban and community planning initiatives and economic development.