
August 4, 2021 |
Mike Bialousz | Conservation
January 29, 2026
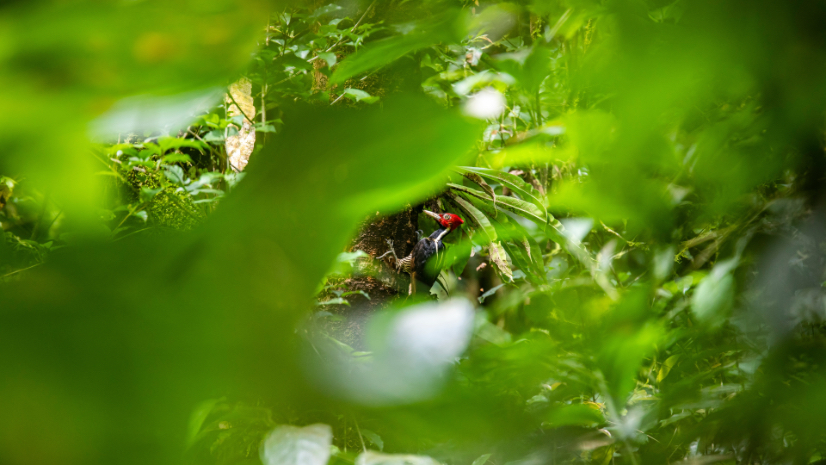
Does the Lord God Bird still hold court in the forests of Alabama? Doubtful, but not impossible. The last confirmed sighting of the bird, formally known as the ivory-billed woodpecker, was decades ago.
Of the over 140 experts consulted on Alabama’s new State Wildlife Action Plan (SWAP), one believes the Lord God Bird still reigns. Rather than labeling the bird “extirpated” (nonexistent) in the state, the expert believes this woodpecker species should receive Priority 1 status, the Alabama SWAP’s highest conservation category.
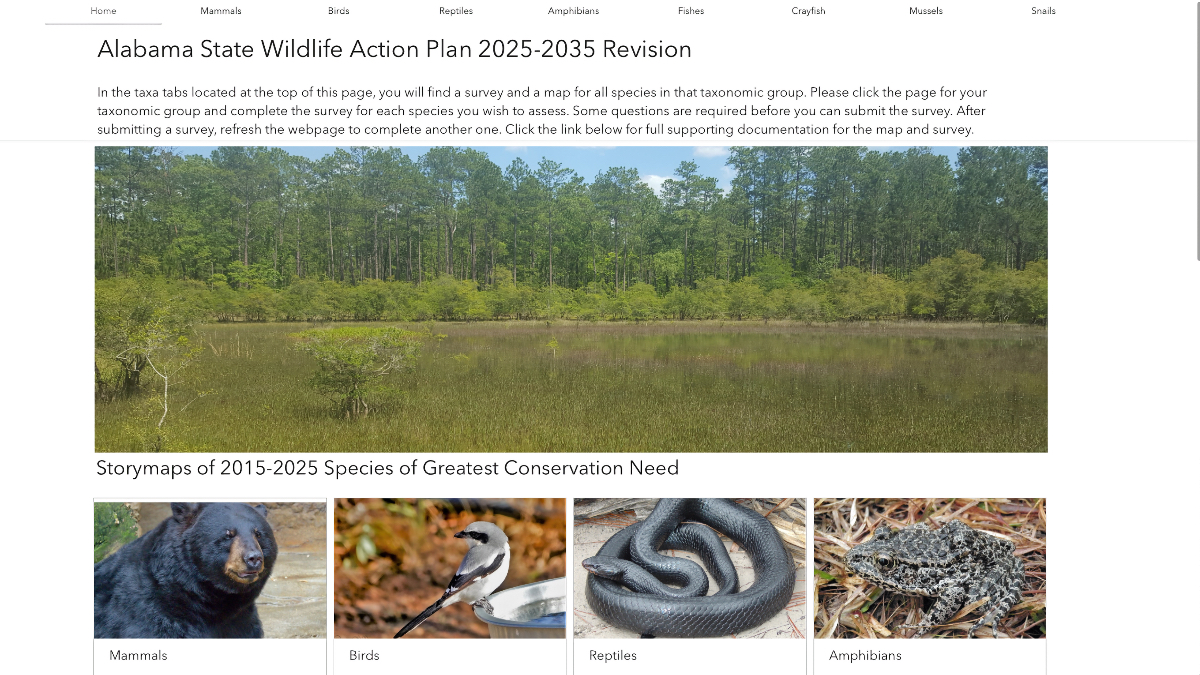
The Lord God Bird is just one of around two thousand species the Alabama Department of Conservation and Natural Resources needs to consider as part of its SWAP. This time, the department has simplified the process by using geographic information system (GIS) technology to gather input, map species locations, and talk about the results.
Alabama hosts a special combination of habitats because it sits at the crossroads of major biogeographic regions. The Appalachian Mountains sweep down from the Northeast with cool, moist forests that are home to amphibians. The Gulf Coastal Plain spreads across the state’s southern half with warm wetlands and longleaf pine savannas. The Tennessee River Valley cuts through the north, and the Mobile-Tensaw River Delta is the second largest in the continental US.
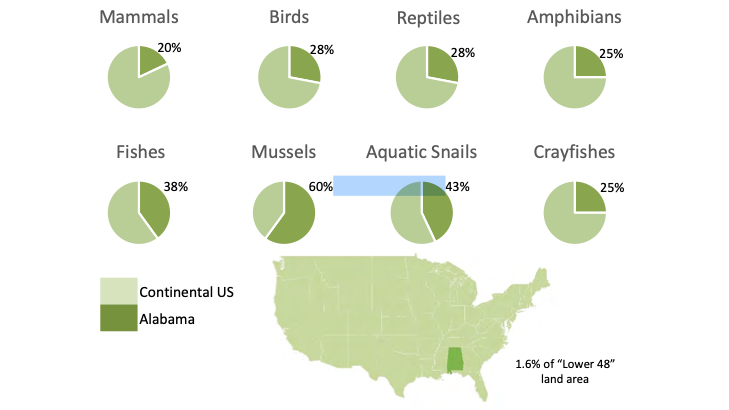
This makes Alabama one of the most biodiverse states east of the Mississippi, and fourth in the country overall. Over 6,300 species live in Alabama, with the country’s most diverse collection of freshwater fish (340 species), mussels, crayfish, snails, and turtles.
Getting a read on the health of each species across these distinctive ecosystems is no easy task.
In 2015, the last time Alabama compiled a SWAP, the state assembled eight “taxa” teams—mammals, birds, reptiles, amphibians, fish, crayfish, mussels, and snails—each comprised of 15–20 experts in these fields. The teams met for three days, discussing and reaching consensus on species threats and necessary conservation actions.
To solicit further information, the agency sent spreadsheets to other experts. The data had to be cleaned up, collated, and considered alongside the teams’ recommendations. The number of species reviewed jumped from 1,200 in 2015 to 2,100 in 2025, with experts ranking each one for its conservation priority. From there, officials would compile the SWAP report.
In addition to the status of protected species, the report included information on the geographic distribution of species, the threats they face, and suggested conservation plans. The process was time-consuming, a marathon of classification that inevitably threatened to go into overtime.
“It’s one thing to go through the mammal species in three days—we only have about 70—but it’s another thing to go through 400 birds,” said Ashley Peters, a GIS specialist with the Alabama Department of Conservation and Natural Resources’ State Lands Division.
Beginning in 2023, the department began a radical overhaul of how species information would be gathered for the 2025 SWAP, to improve the process and accuracy of the data. Peters worked closely with Katie Lawson, a GIS expert and professor in Auburn University’s Department of Crop, Soil, and Environmental Sciences.
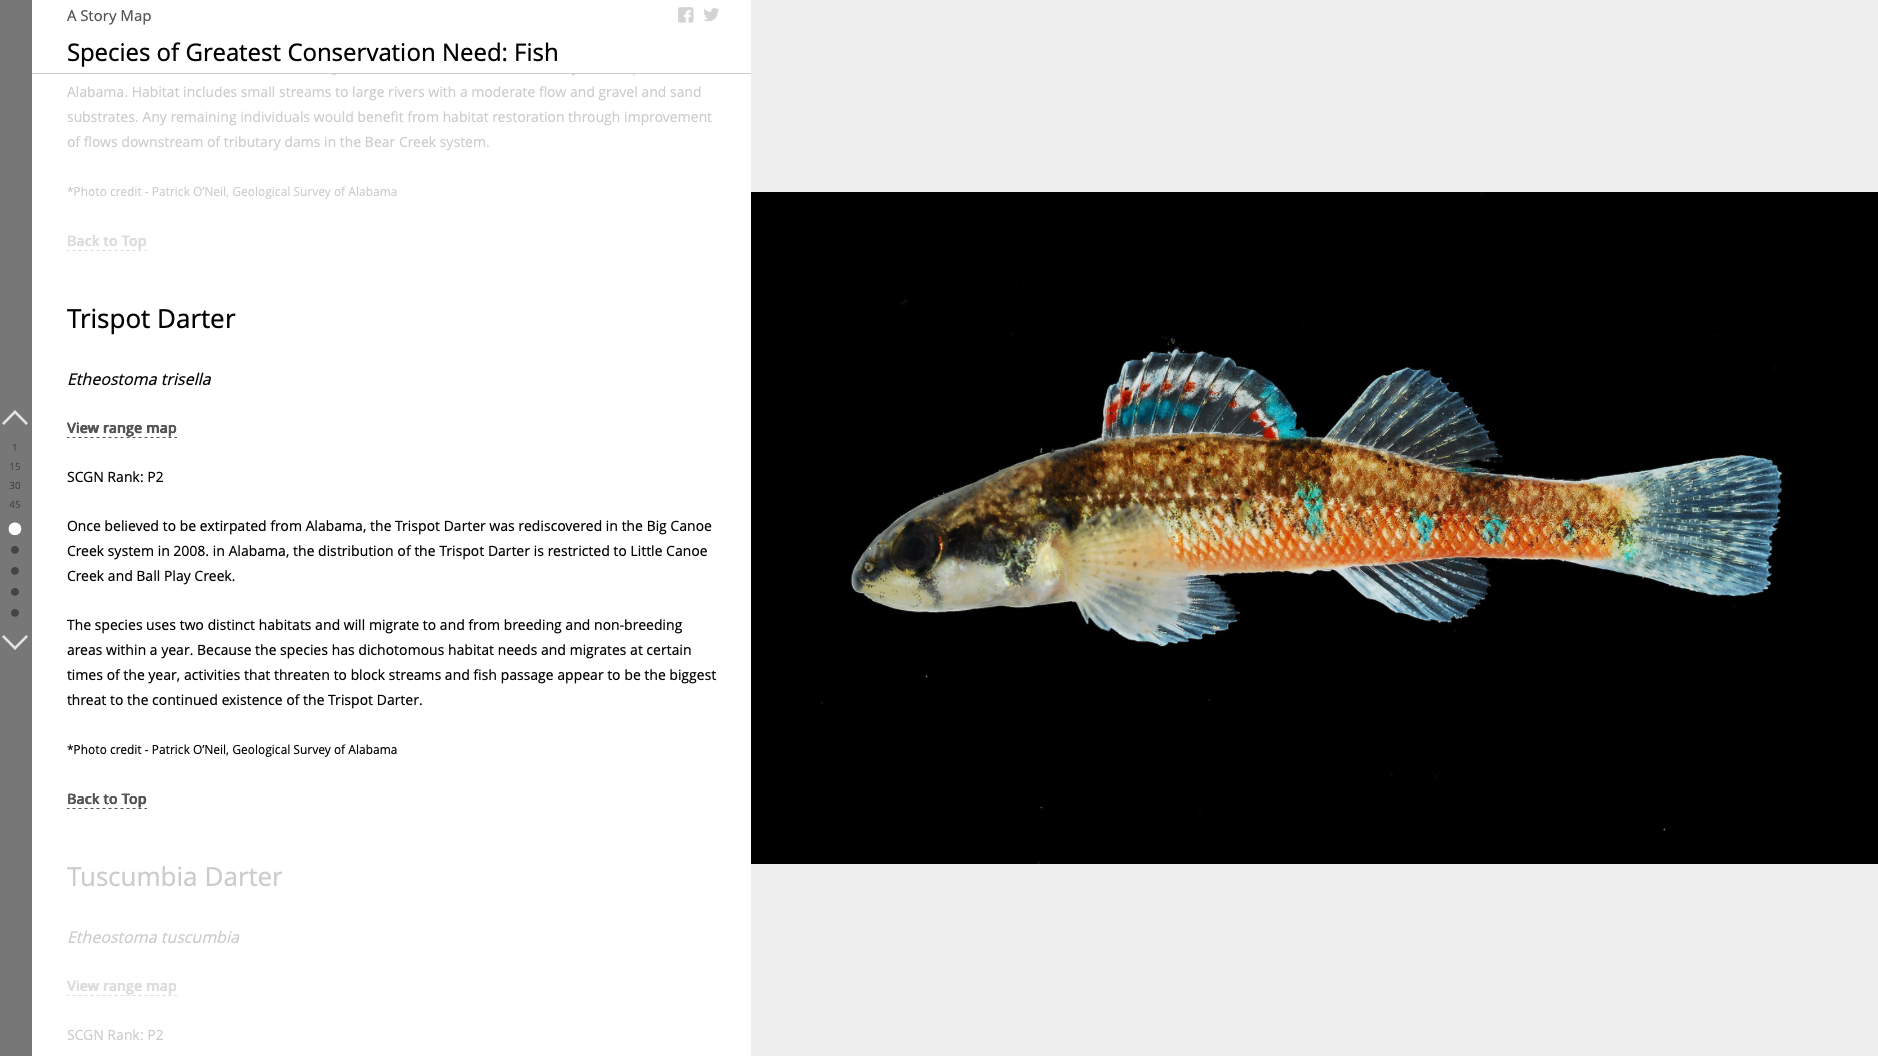
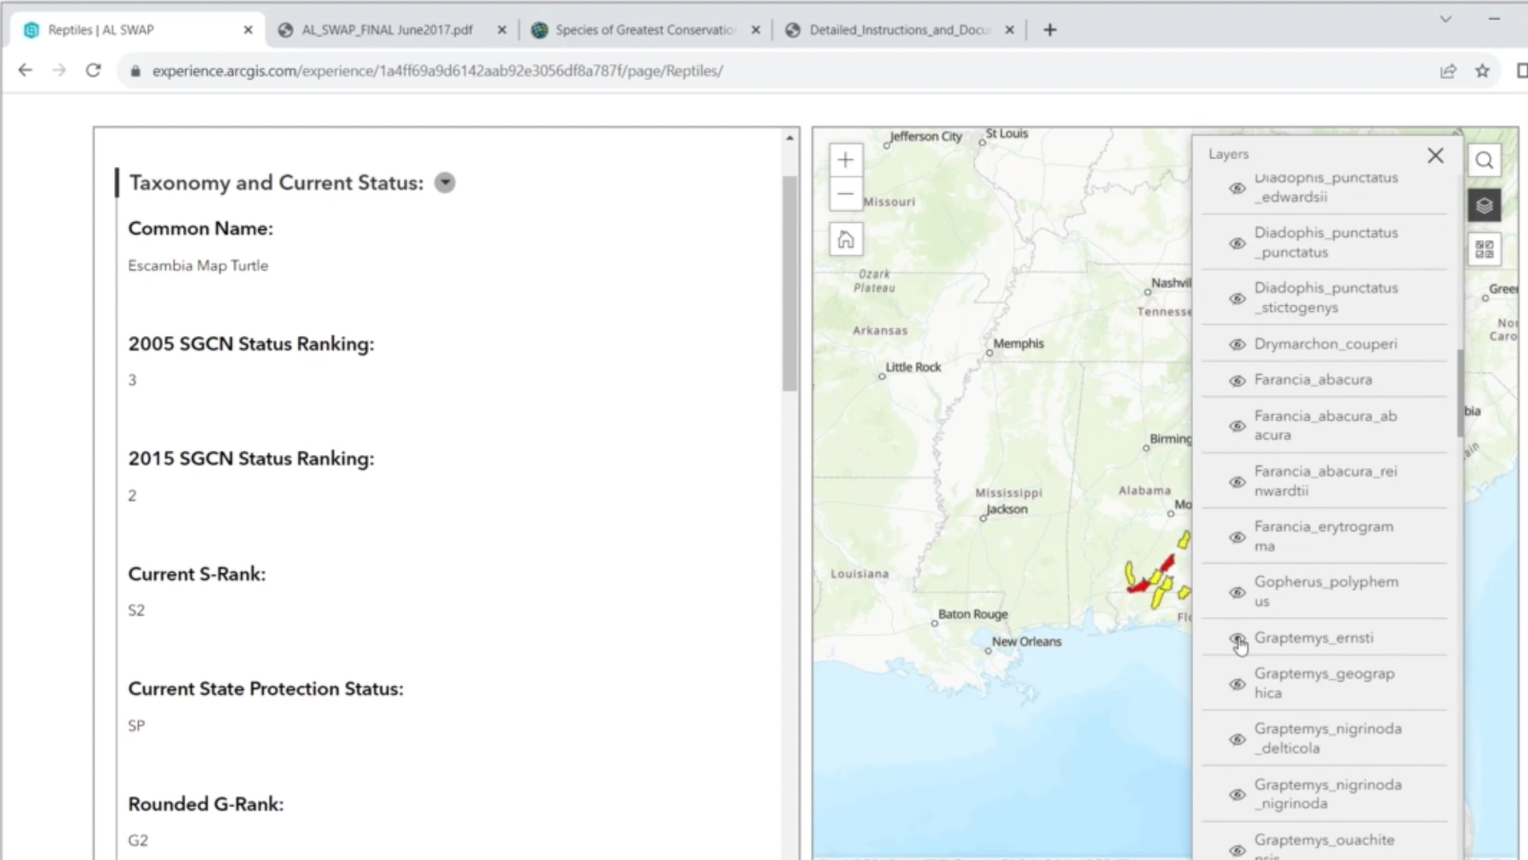
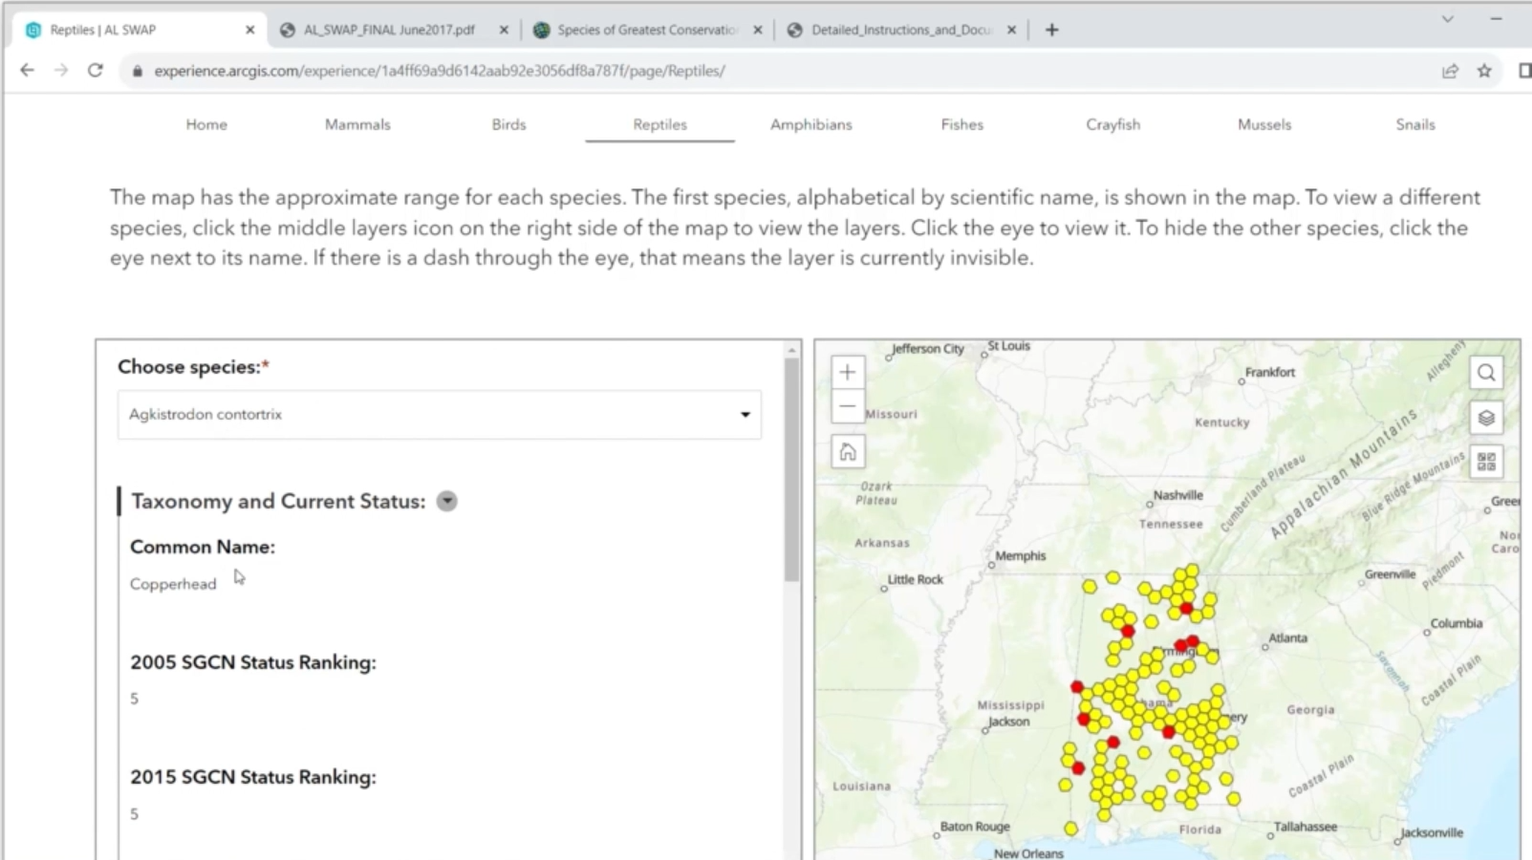
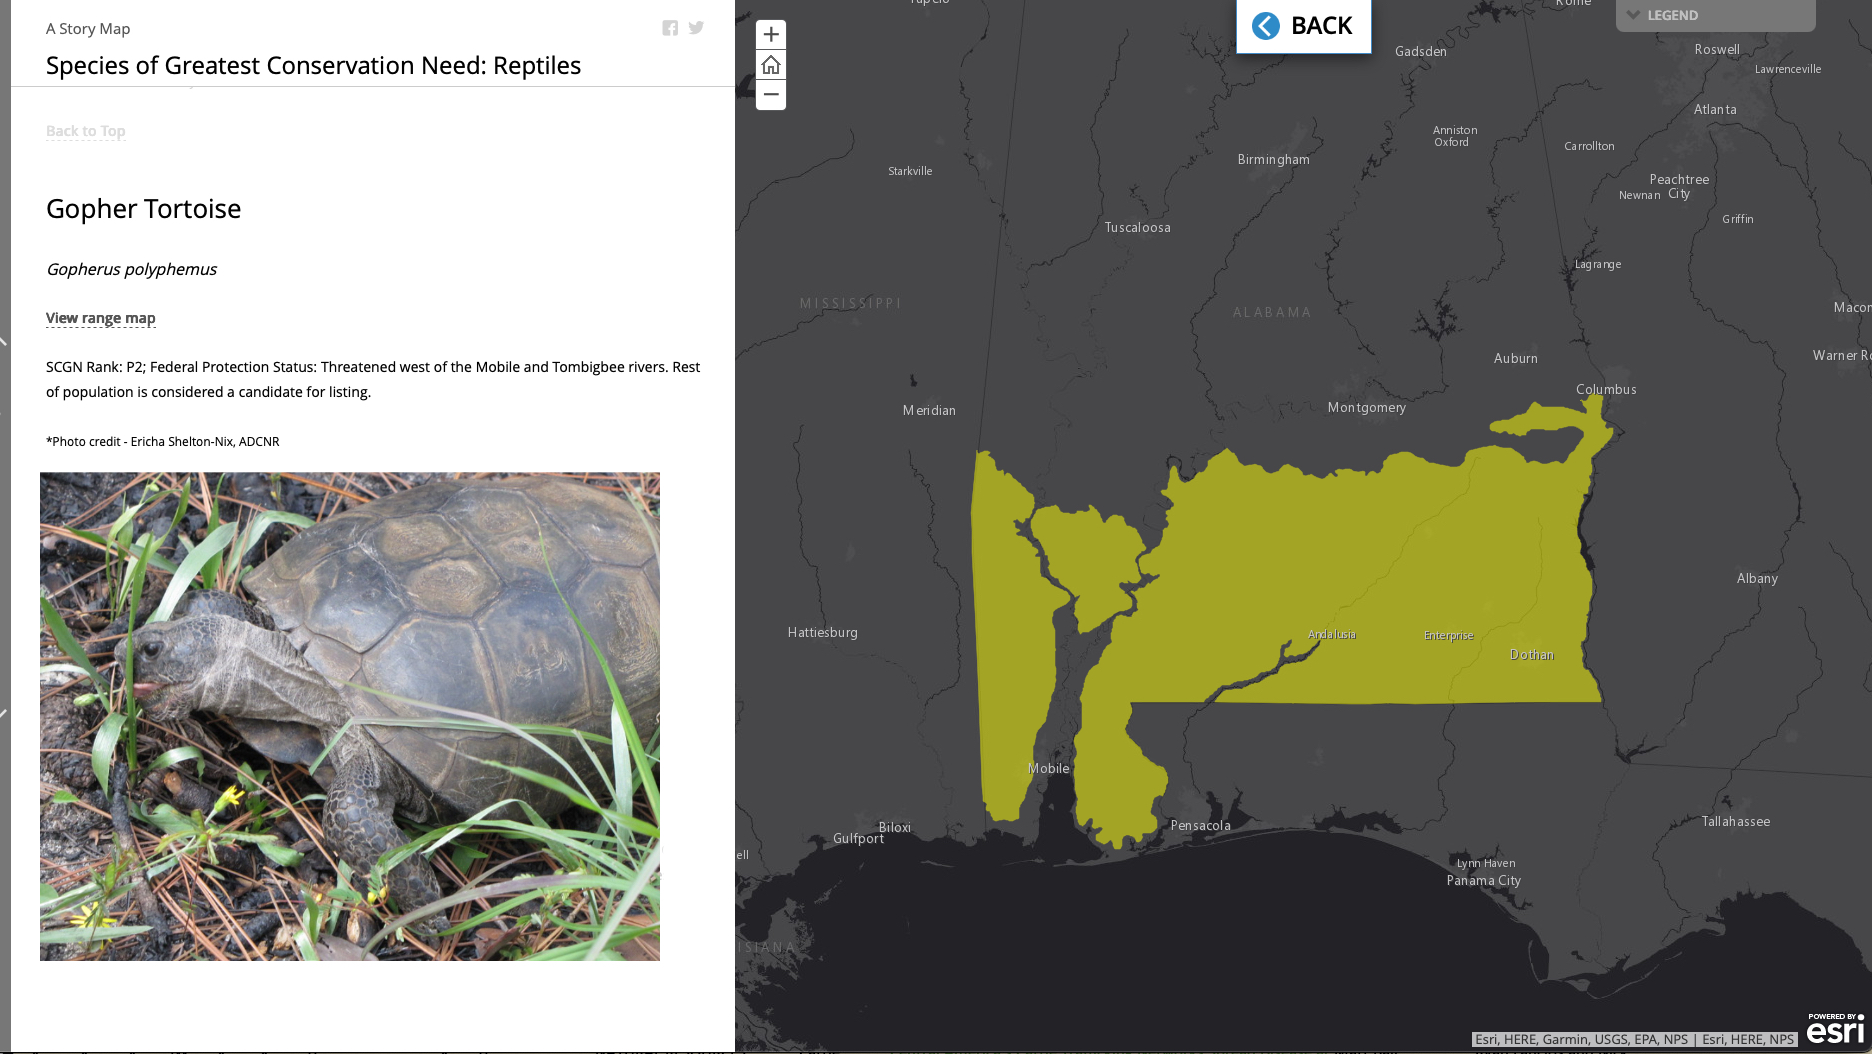
The tool they developed uses a GIS web app builder to combine expert input and make it specific to a location prior to the ranking process. A drop-down menu within each taxa section lists all the species under review within that group.
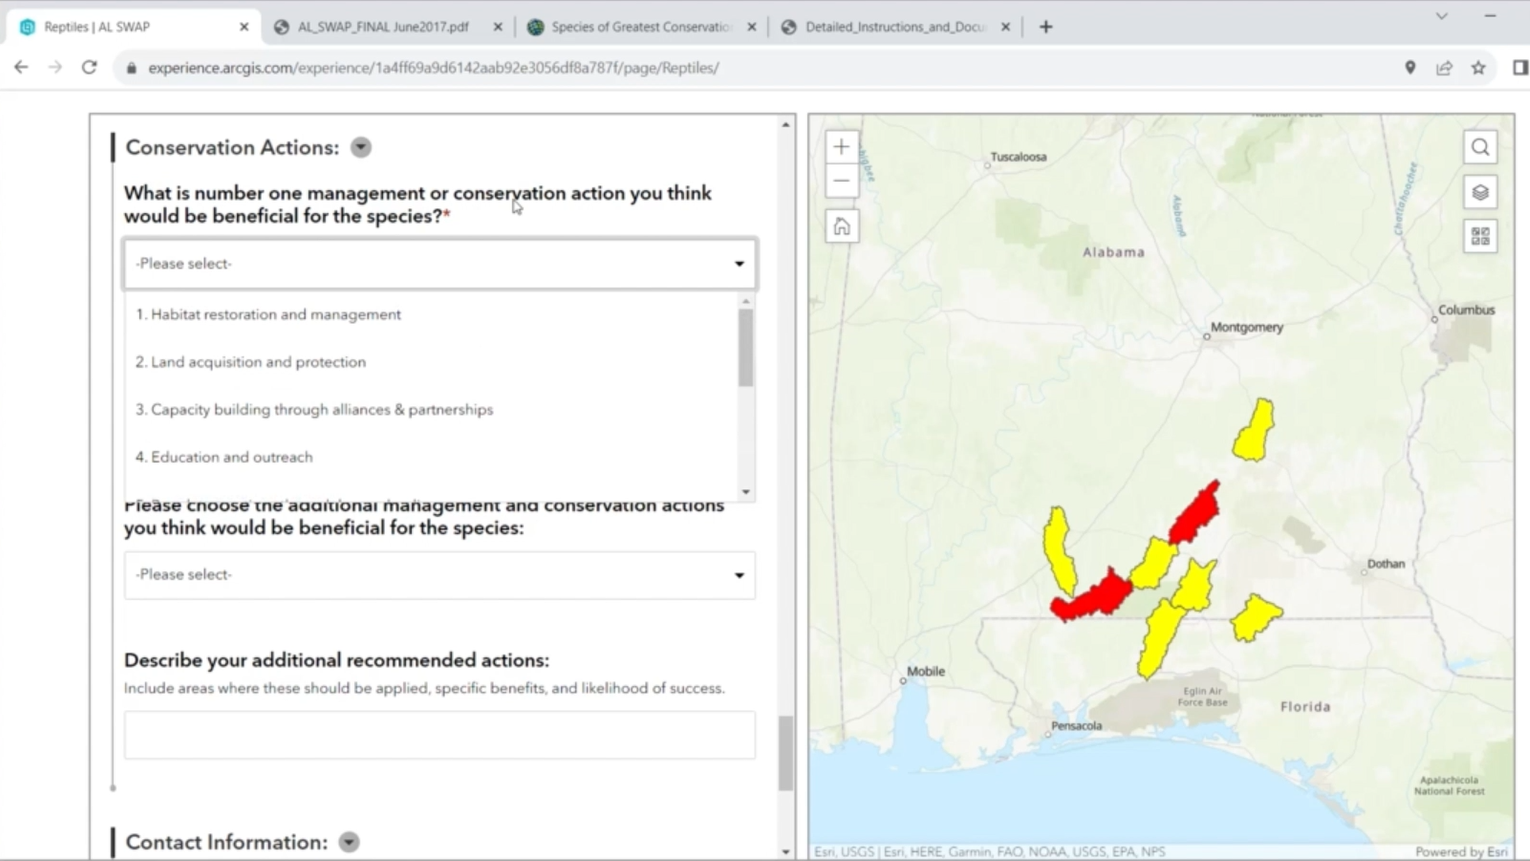
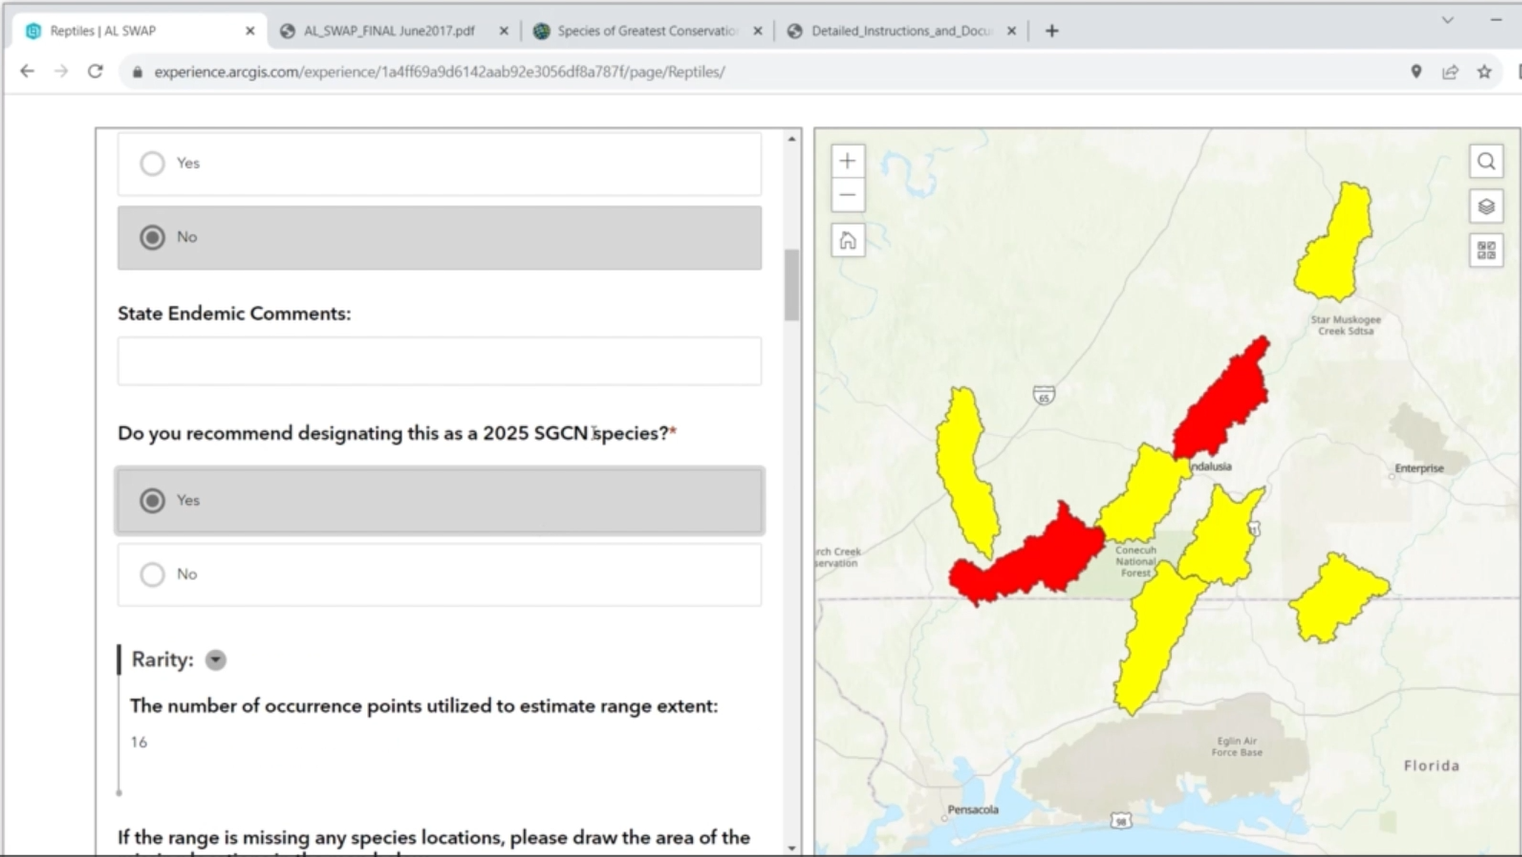
When an animal is selected from the menu, the site provides an interactive map showing where that animal has been and where it is now. It also offers an ArcGIS Survey123 GIS-powered survey form, prompting respondents to note whether they believe the animal deserves protected status. If the answer is yes, respondents answer additional questions.
“At a quick glance, the experts could see when a species was last in an area,” Peters said. “If the map was mostly yellow, then we had a lot of recent observations. If it was more red, then we had older observations. And so they could talk about whether these were accurate.”
Collected data is displayed on a dashboard. With charts and graphs, the dashboard serves as a way to crowdsource expert opinions regarding each species. Data was collected over a six-week period, then the taxa groups met for one day to discuss the results and make SWAP recommendations.
Efficiency improvements are obvious—three days of fraught discussions reduced to a one-day meeting to discuss collected data. Just as important, the process facilitates a holistic approach to prioritization.
The completed SWAP contains additional maps of the entire state. These maps answer such questions as how to connect conservation areas via habitat corridors.
A species’ conservation status has funding implications. “The funding source for species of greatest conservation need is the federal State Wildlife Grant Program,” Lawson said. “That means that the ranking directly influences which species can receive financial support for conservation projects.”
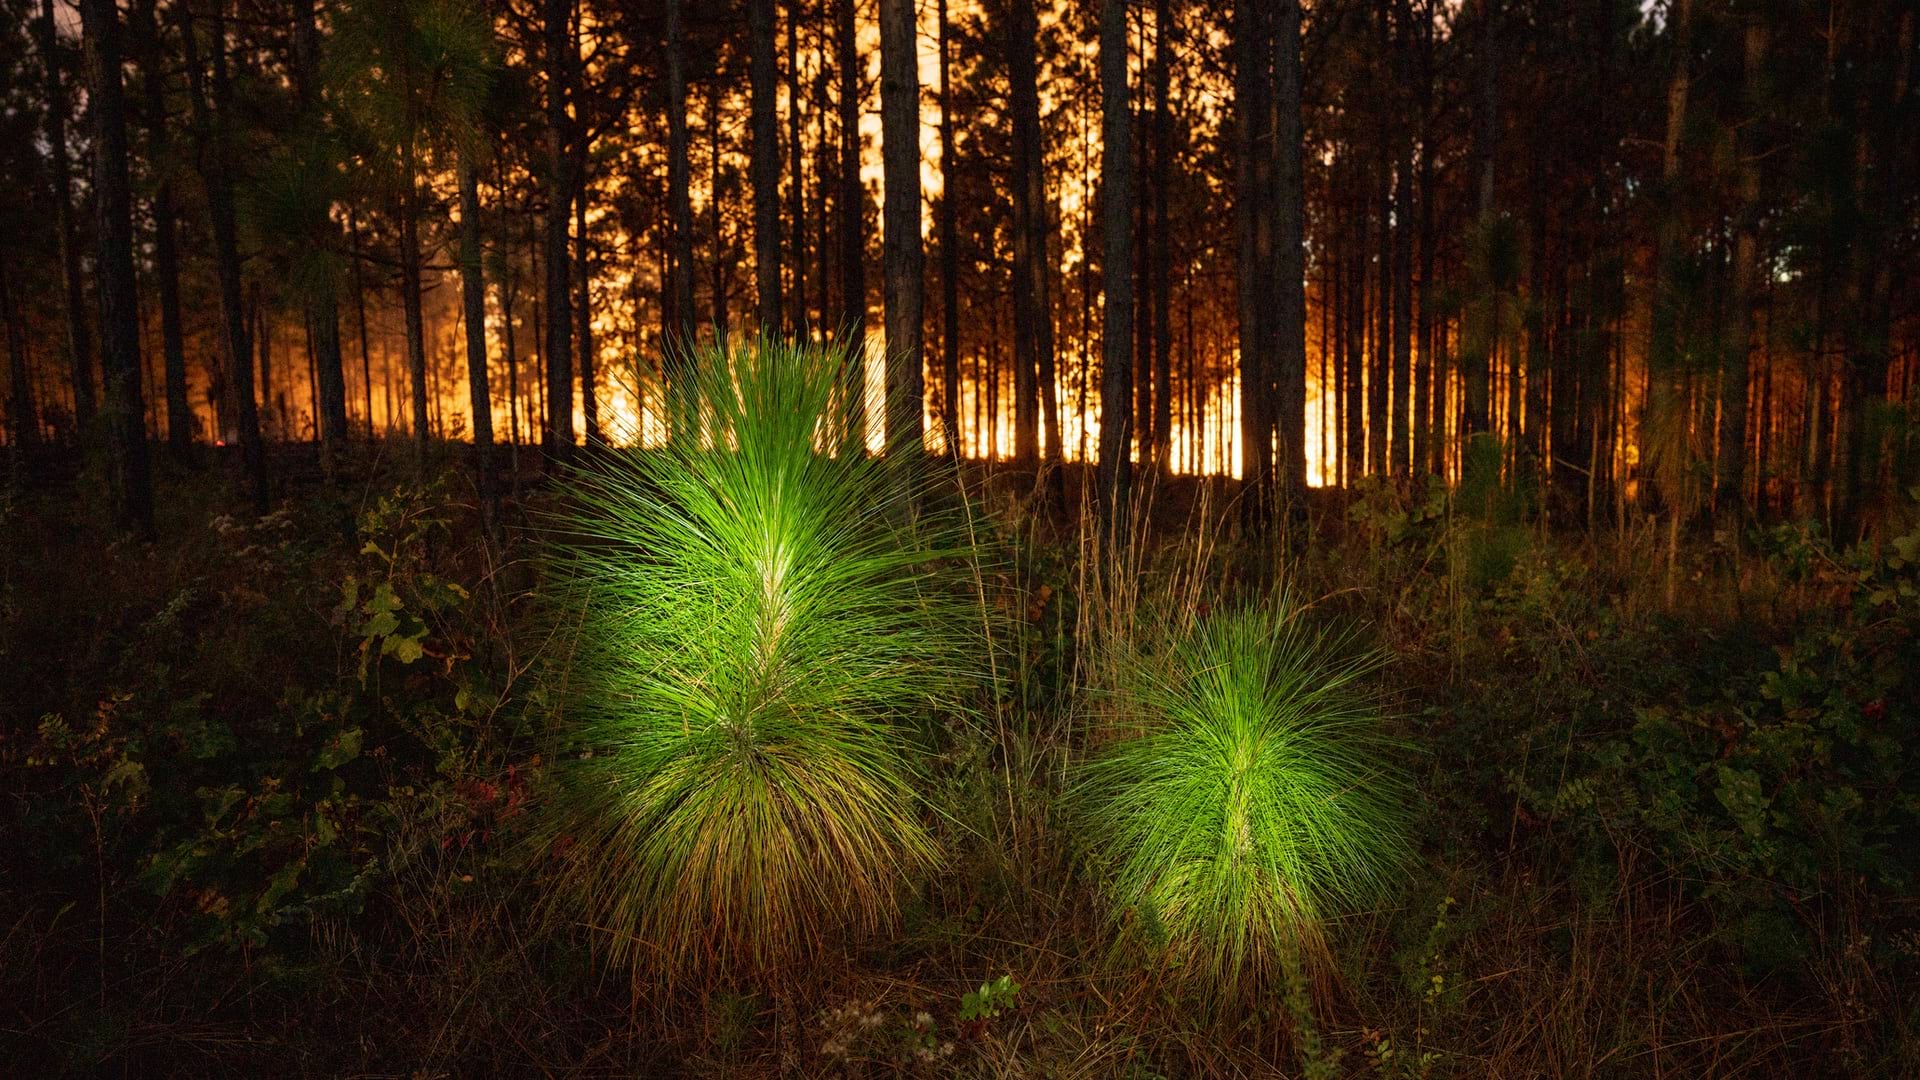
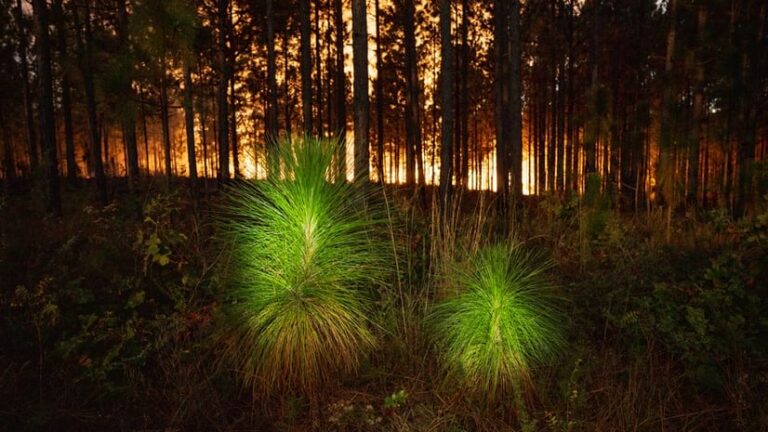
GIS maps and analysis also make it easier to understand the health of Alabama’s ecosystems. The state has one of the largest concentrations of longleaf pine land in the US. Over the last century, much of the nation’s longleaf pine lands, one of the most species-rich ecosystems outside of the tropics, have disappeared.
Among its major threats is the prevalence of fire suppression on developed land. Periodic fires are an important way the ecosystem recharges itself.
The SWAP analysis revealed some signs of improvement in that ecosystem. The pinewoods litter snake, for example, no longer needs extra conservation protection.
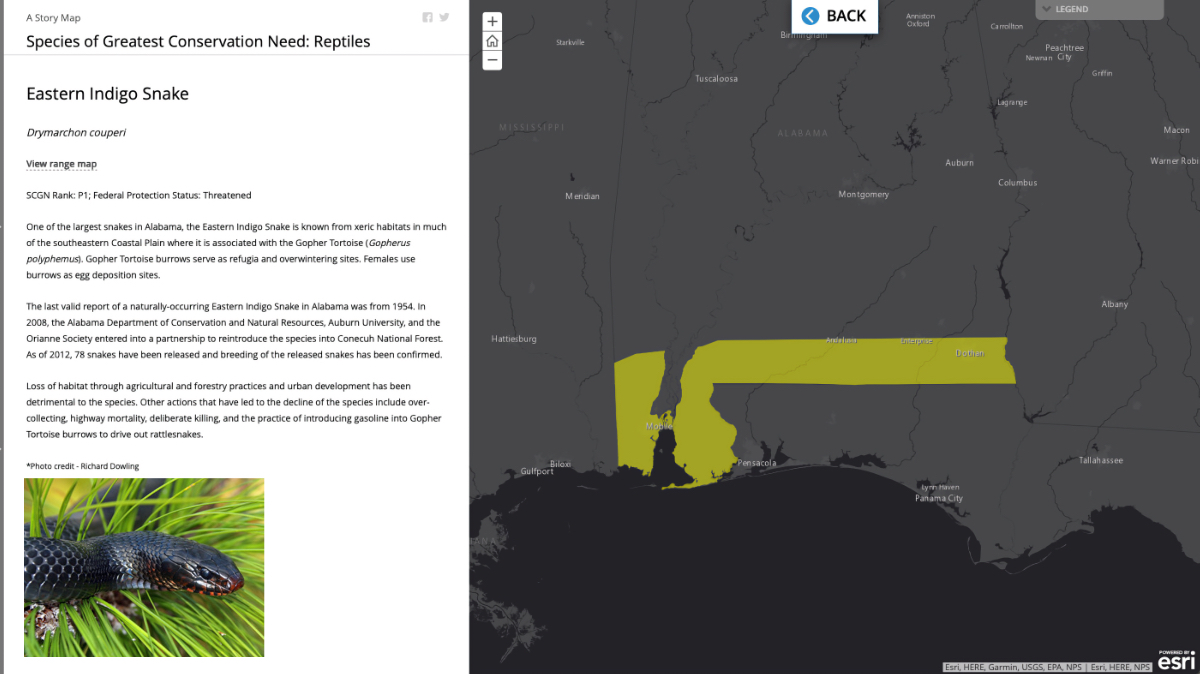
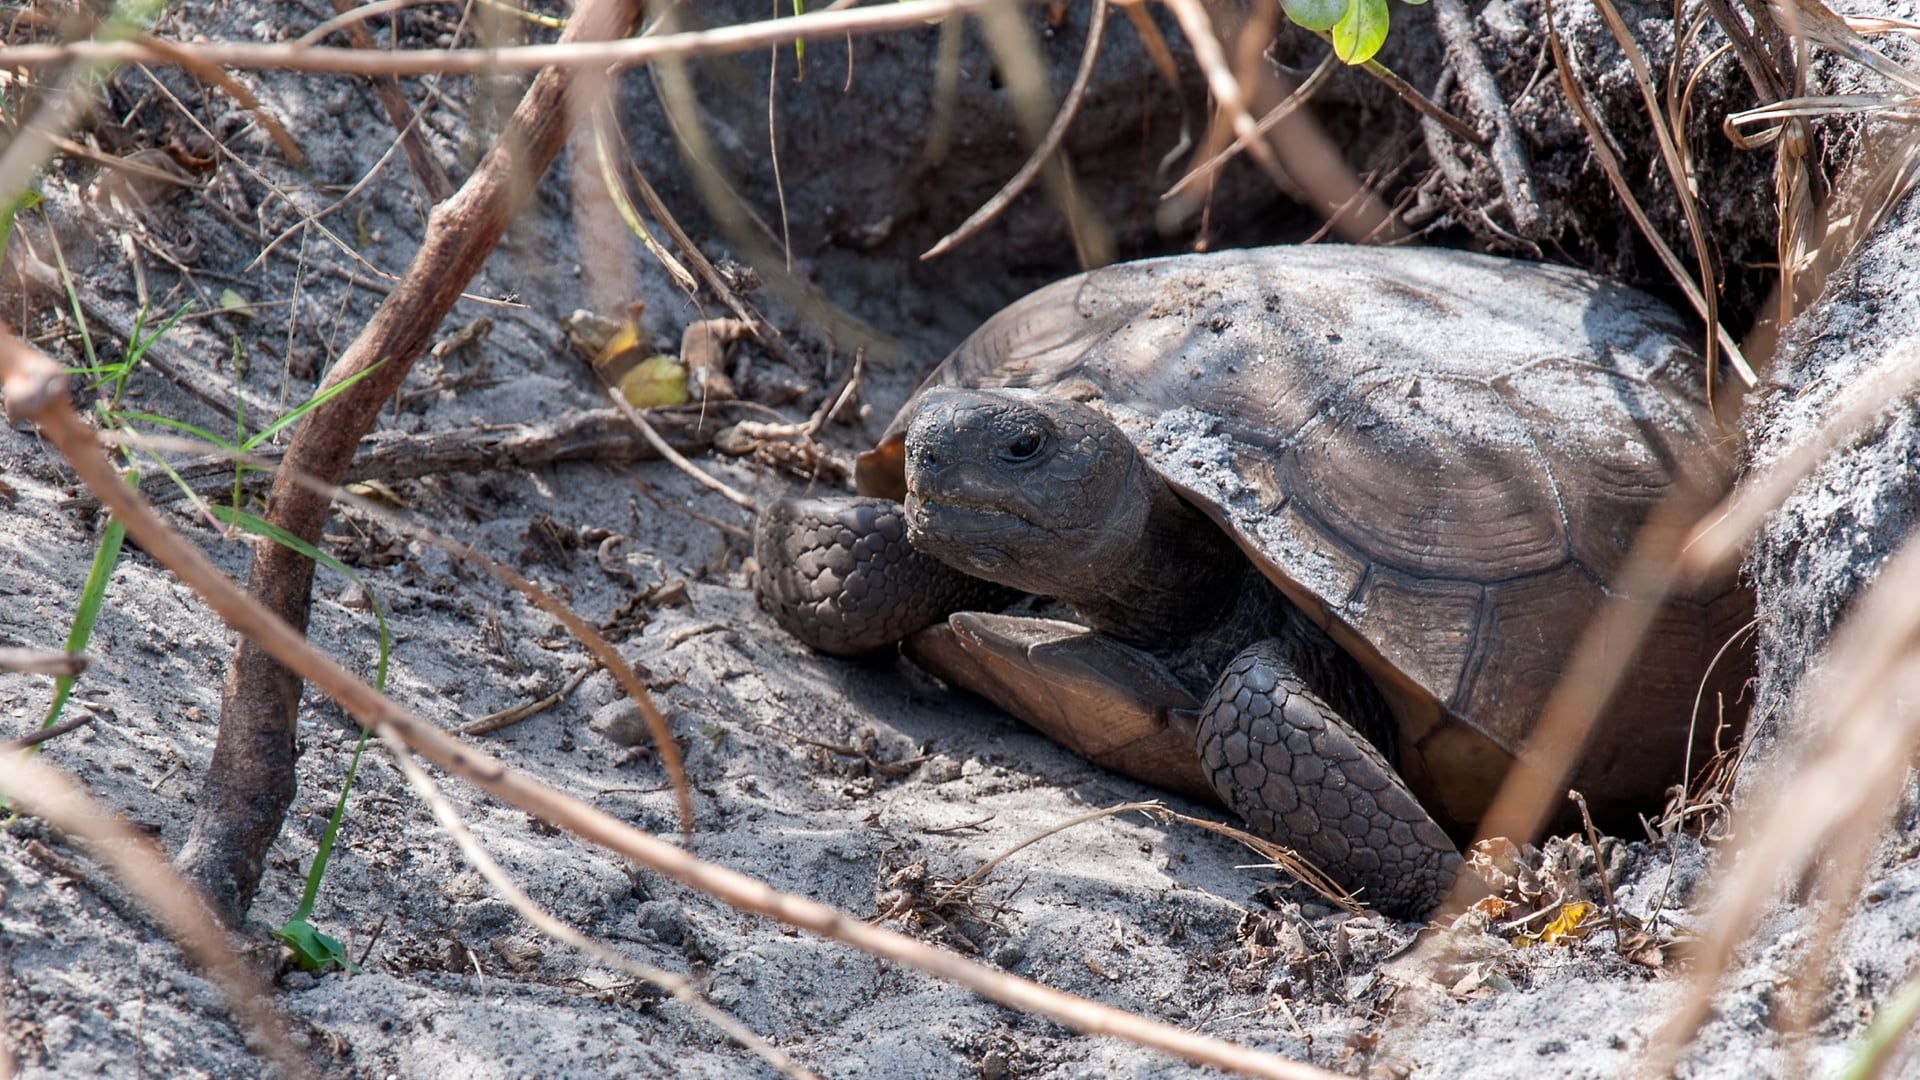
The eastern indigo snake is a keystone species, meaning it has an importance to the ecosystem’s health disproportionate to its abundance. It relies on burrows dug by the gopher tortoise, itself a keystone species. Both species are still designated as needing priority conservation efforts.
Data like this, visualized on GIS dashboards and maps, helps the state plan conservation efforts by revealing ways to expand the ecosystem. Habitat corridors, for example, can unite disconnected parts of the ecosystem. But building those corridors requires coordination with private landowners. The maps help determine where potential corridor lands are located and how they might be enlisted for ecosystem protection.
One important improvement of the new GIS-based process over the previous method is the way it facilitates better communication and consensus.
As expected, the Lord God Bird, whose presence in Alabama is disputed among bird experts, required some discussion. “In the bird room, we had one person who feels like it’s still here, and he didn’t want to give up on it,” Peters said.
The dashboard made it clear to the holdout that his opinion was an outlier.
“The room talked about it, and he wanted to give it Priority 1 status, but he finally said, ‘I know I’m the odd man out,’ so we decided to call it extirpated,” Peters said.
“That’s one of the biggest impacts the dashboard has,” Lawson added. “For a lot of those species where people disagreed, a pie chart displayed how many experts were recommending various priority levels.”
The data democratizes the process, while ensuring that nobody dominates the conversation.
“If four people recommend P1 and two people recommend P2, everybody’s voice was in that pie chart, regardless of whether they were reluctant to speak up,” Lawson said. “Because there are some shyer people, who have profound knowledge of these species, but are maybe more likely to go with the opinions of others.”
Beyond streamlining the ranking process, Alabama’s GIS-based approach addresses a persistent challenge in conservation planning. SWAPs are typically contained on PDF documents. The static medium limits the underlying data that various partners—land trusts, nonprofits, and executive branch implementation agencies—need to inform conservation projects.
Alabama’s online platform ensures that maps, data, and conservation priorities are accessible and updateable. A conservation partner can view exactly where a species has been documented, note current threats, and make informed decisions regarding where to focus restoration work or pursue land acquisition.
Learn more about how conservation professionals apply GIS to protect biodiversity.