
April 25, 2019 |
Ryan Lanclos | Public Safety
This is the first of a two-part story about damage assessment for the devastating tornadoes in Lee County, Alabama. The second installment focuses on the local response to the needs of those impacted.
Dozens of tornadoes ripped through southeastern US states this year on March 2. Two twisters touched down an hour apart along nearly the same path in Lee County, Alabama leaving authorities racing to assess damages and search for survivors.
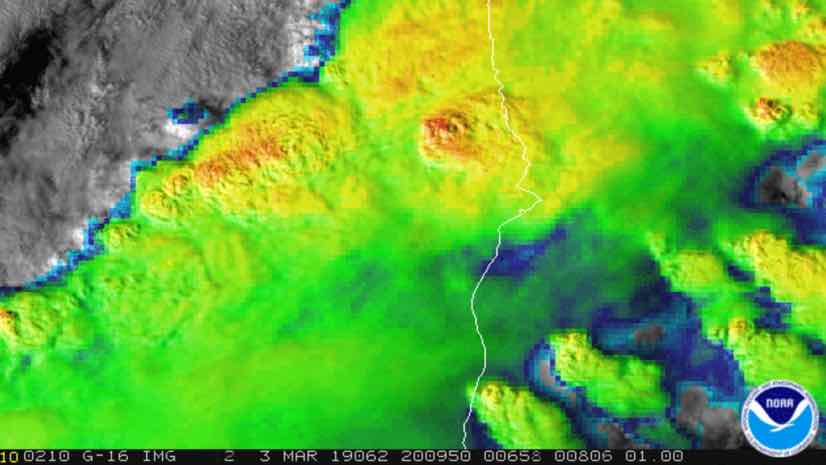
Four days before the deadly storm, forecasters predicted it due to a strong weather pattern known as a shortwave trough. The National Weather Service’s Storm Prediction Center issued a Particularly Dangerous Situation tornado watch for much of Alabama, northwest Georgia, southeast Mississippi, and southern middle Tennessee. The forecast marked a greater than 95% probability of at least two tornadoes and at least one of those being a strong tornado.
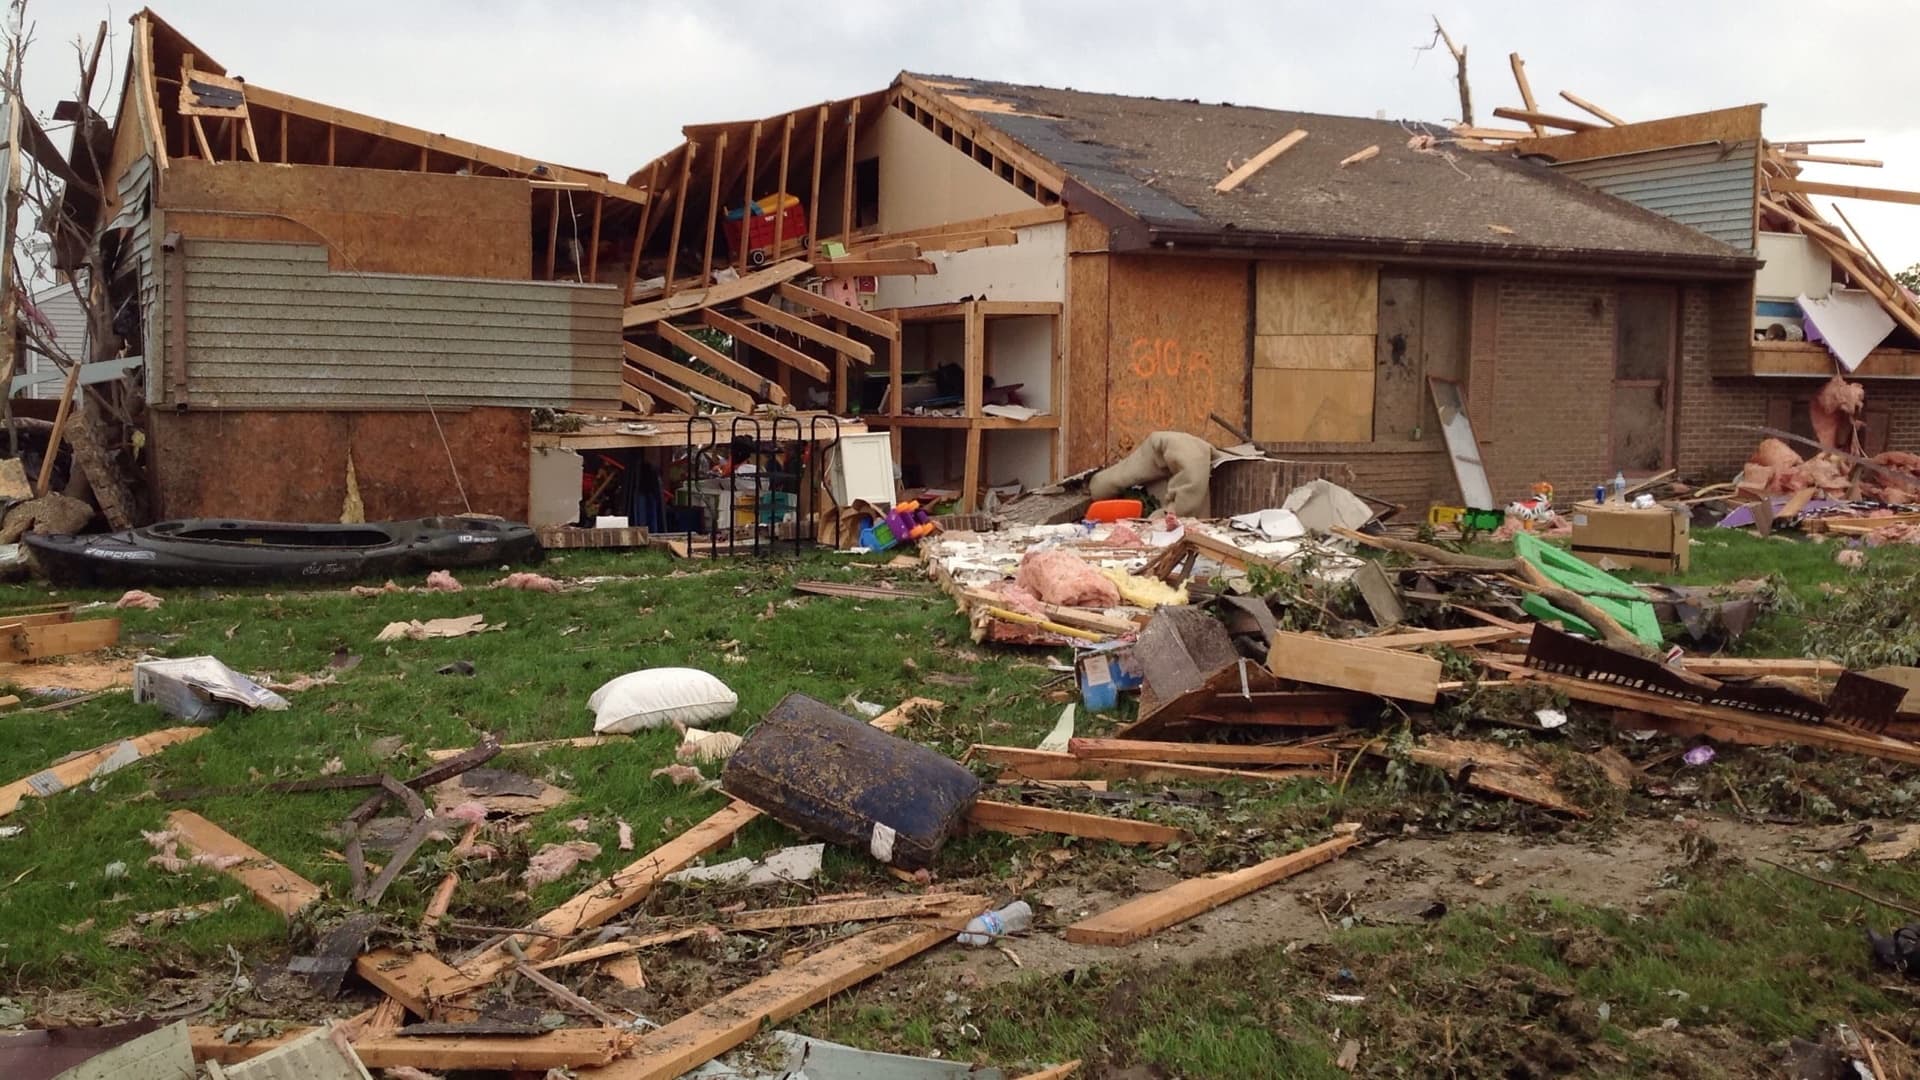
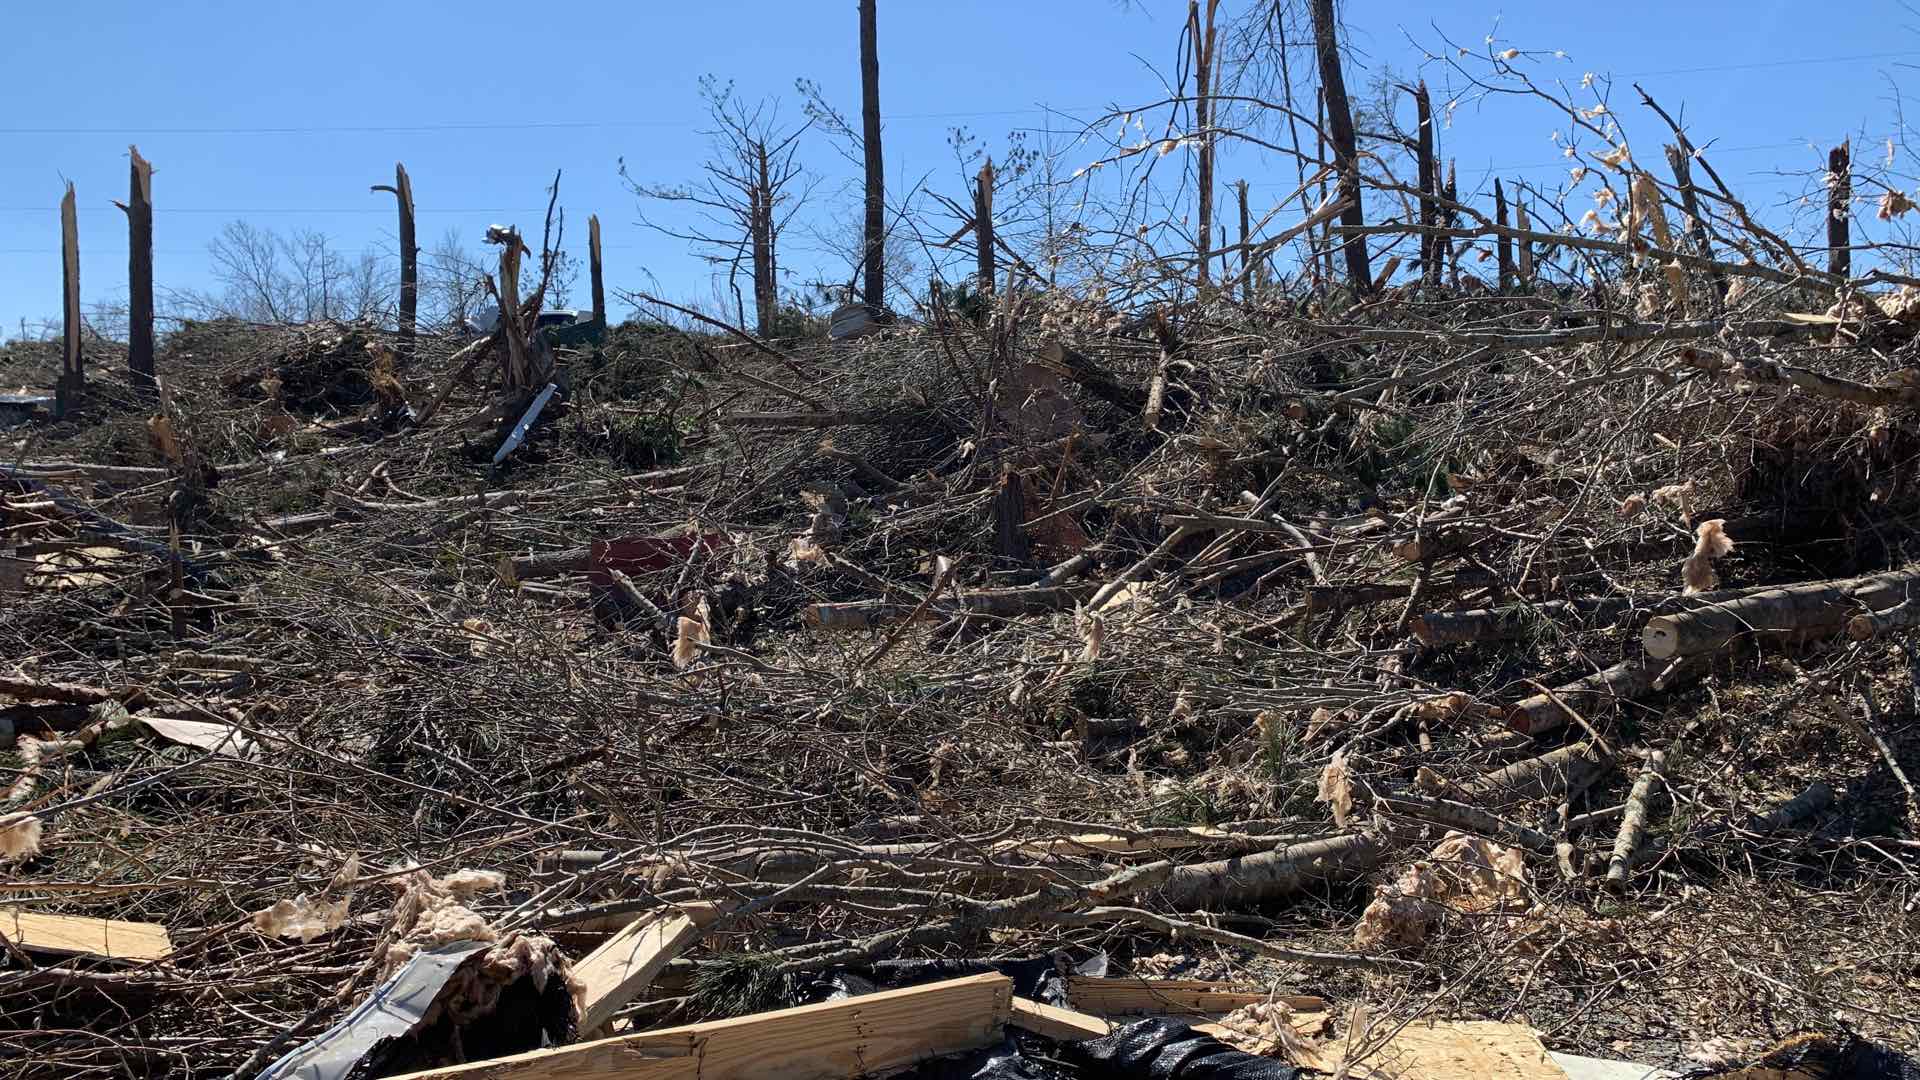
In Lee County, the first tornado struck with more than 170 mile-per-hour winds (rated an EF4 on the Enhanced Fujita Scale). Leaving a trail of destruction nearly a mile wide and 24 miles long, the tornado tore down trees, tossed cars, and leveled homes to piles of debris. Twenty-three people lost their lives.
When any disaster strikes, authorities must act quickly to assess damage. In the case of tornadoes, the National Oceanic and Atmospheric Administration’s National Weather Service is one of the first on the scene with a damage survey team. The team gathers data to map storm start and end points, path length and width, and wind magnitudes.
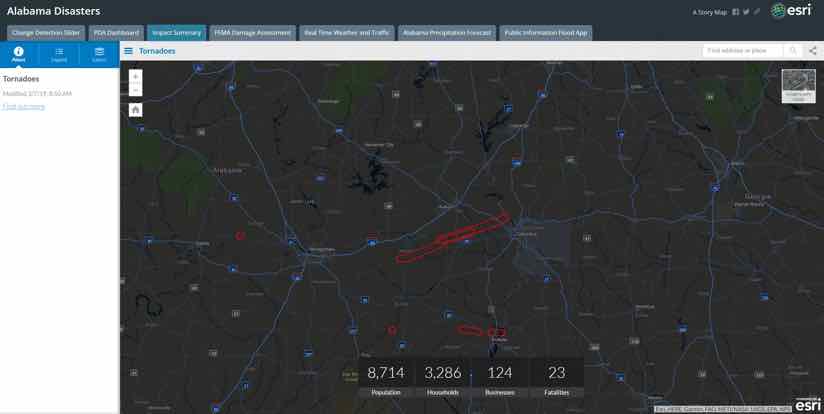
“I was initially called by the Alabama Emergency Management Agency to support efforts there,” said Jared Bostic, deputy Geographic Information Officer with the Alabama Law Enforcement Agency. “I took the tornado swaths and then mapped an impact summary, using a geographic information system (GIS) to calculate the population and number of households that could be affected within those swaths, including the number of businesses.”
This initial mapping gives first responders crucial information about potential scope and scale of the event and helps the search and rescue effort.

Modeling Damage
In the wake of a disaster, officials at the Federal Emergency Management Agency (FEMA) need specific details of damage before they can determine the level of federal recovery assistance. Typically, it is up to local authorities to provide information. To reduce that burden, FEMA started working on a partially automated imagery-derived model to conduct preliminary house-by-house damage estimates.
“The impetus for this solution goes back to the EF5 tornado that hit Joplin, Missouri, in May of 2011,” said Christopher Vaughan, Geospatial Information Officer at FEMA. “When 500 federal employees showed up and began asking for data it was a struggle for the city’s GIS person to come up with what got hit and how bad it got hit.”
It took a week to fly updated aerial imagery and conduct house-by-house damage assessments.
“We have significantly improved the time it takes to gain an awareness and understanding of tornado damage,” said Vaughan. “We have gone from five to six days down to less than 24 hours.”
Vaughan and his team attribute the faster assessment time to a national building footprint and parcel data set, which allow for quicker calculations of damage to homes and structures. FEMA has been working with the National Geospatial-Intelligence Agency and its contractor CoreLogic to develop the national parcel base, building on Microsoft’s release of national building outlines. This data combines with Enhanced Fujita wind speed ratings that help to assess the level of damage caused to different structures based on the wind speed.
“The preliminary model takes land use data within the tornado track to estimate the level of damage to individual structures,” said Madeline Jones, geophysical data scientist at New Light Technologies, a FEMA contractor. “As soon as we have wind speeds, we can run the model to calculate the estimated level of damage. From there, we can create a spreadsheet, stand up a web application, and create a feature service that others can consume, all within a few hours.”
Speedy assessment enhances situational awareness for teams conducting on-the-ground damage analysis as well as crews working to remove debris, reopen roadways, and restore electrical and communications networks. The preliminary damage review also helps support damage declaration decisions for the impacted communities.
“The model provides an estimated overall scoping of the incident size, shape, and extent to support a variety of crisis decisions,” Vaughan said. “The faster and more accurate we are, the better the evidence-based decisions. We’re always fighting time, and time is life.”

Combining Many Inputs
During every disaster, many people and agencies rally to assist local first responders. In the case of the Alabama tornadoes, the American Red Cross quickly deployed volunteers with a survey-based field application to conduct door-to-door damage assessments. The National Insurance Crime Bureau’s Geospatial Intelligence Center (GIC) collected aerial imagery, through a partnership with Vexcel Imaging and Esri, and made the imagery available to first responders as well as insurance company members.
With today’s modern geospatial infrastructure, data from multiple organizations can be securely shared as web services. This includes web services for aerial imagery, field-collected data, basemaps, and more. Together, these data can be combined in purpose-built applications that visually communicate different place-based aspects of the operation.
“With the imagery service coming from the GIC, I created a change detection slider for pre- and post-disaster imagery,” Bostic said. “You can just move that slider back and forth to see a home before and after the tornado.”
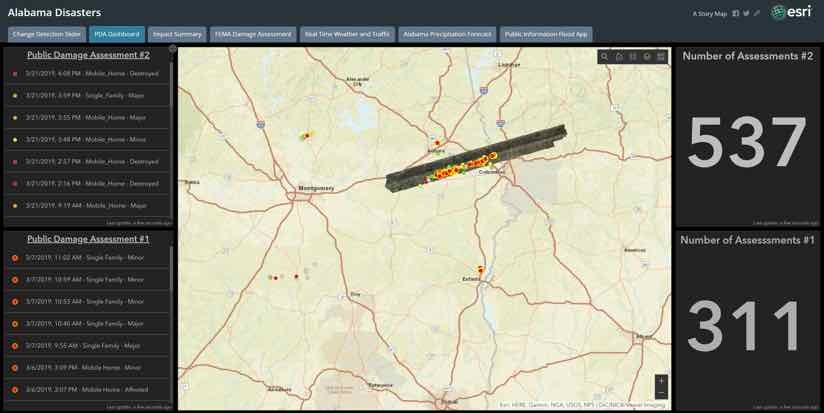
Bostic and his team use Story Maps and Operations Dashboards for ArcGIS to communicate information at a glance to decision makers and first responders in the field. These modern apps help fill in data gaps for first responders and operators working to save lives and property during a disaster.
Bostic created a damage assessment dashboard to tally the Red Cross damage appraisals. “Once an assessment is done and submitted in the field,” he explains, “it updates the dashboard with the date and time of the most recent submission, the type of home it is, and the extent of structural damage. A ticker tallies the number of assessments to date.”
Recurring Incidents
Alabamians know to take cover from tornadoes. It is one of the few places in the world to experience two tornado seasons, adding November and December along with severe spring weather.
“There were 300 tornado touchdown points in the spring of 2011, and it caused chaos,” Vaughan said. “Alabama, Georgia, and Mississippi were all impacted. Tuscaloosa and Birmingham got hit the hardest. If we were to get hit today with that kind of massive event, we have the technology to quickly deliver information and make sure that we’re all communicating and collaborating.”
The quick and impossible-to-predict path of tornadoes make it one of the more unsettling disasters.
“With hurricanes, you have a week to plan and get people out of harm’s way,” Bostic said. “We knew we were going to have some bad weather, but you just don’t know when and where it’s going to drop out of the sky.”
Esri’s Disaster Response Program provides software, data coordination, technical support, and other GIS assistance. Learn more about the Disaster Response Program or contact us in times of emergency.