April 27, 2020 |
August 25, 2020
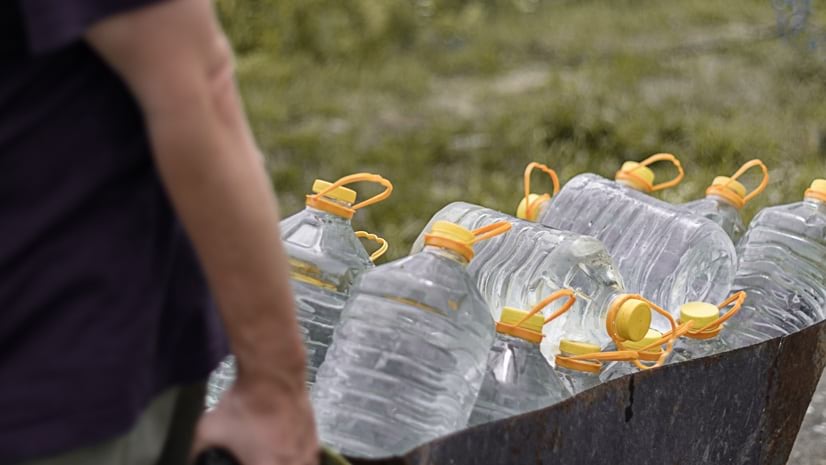
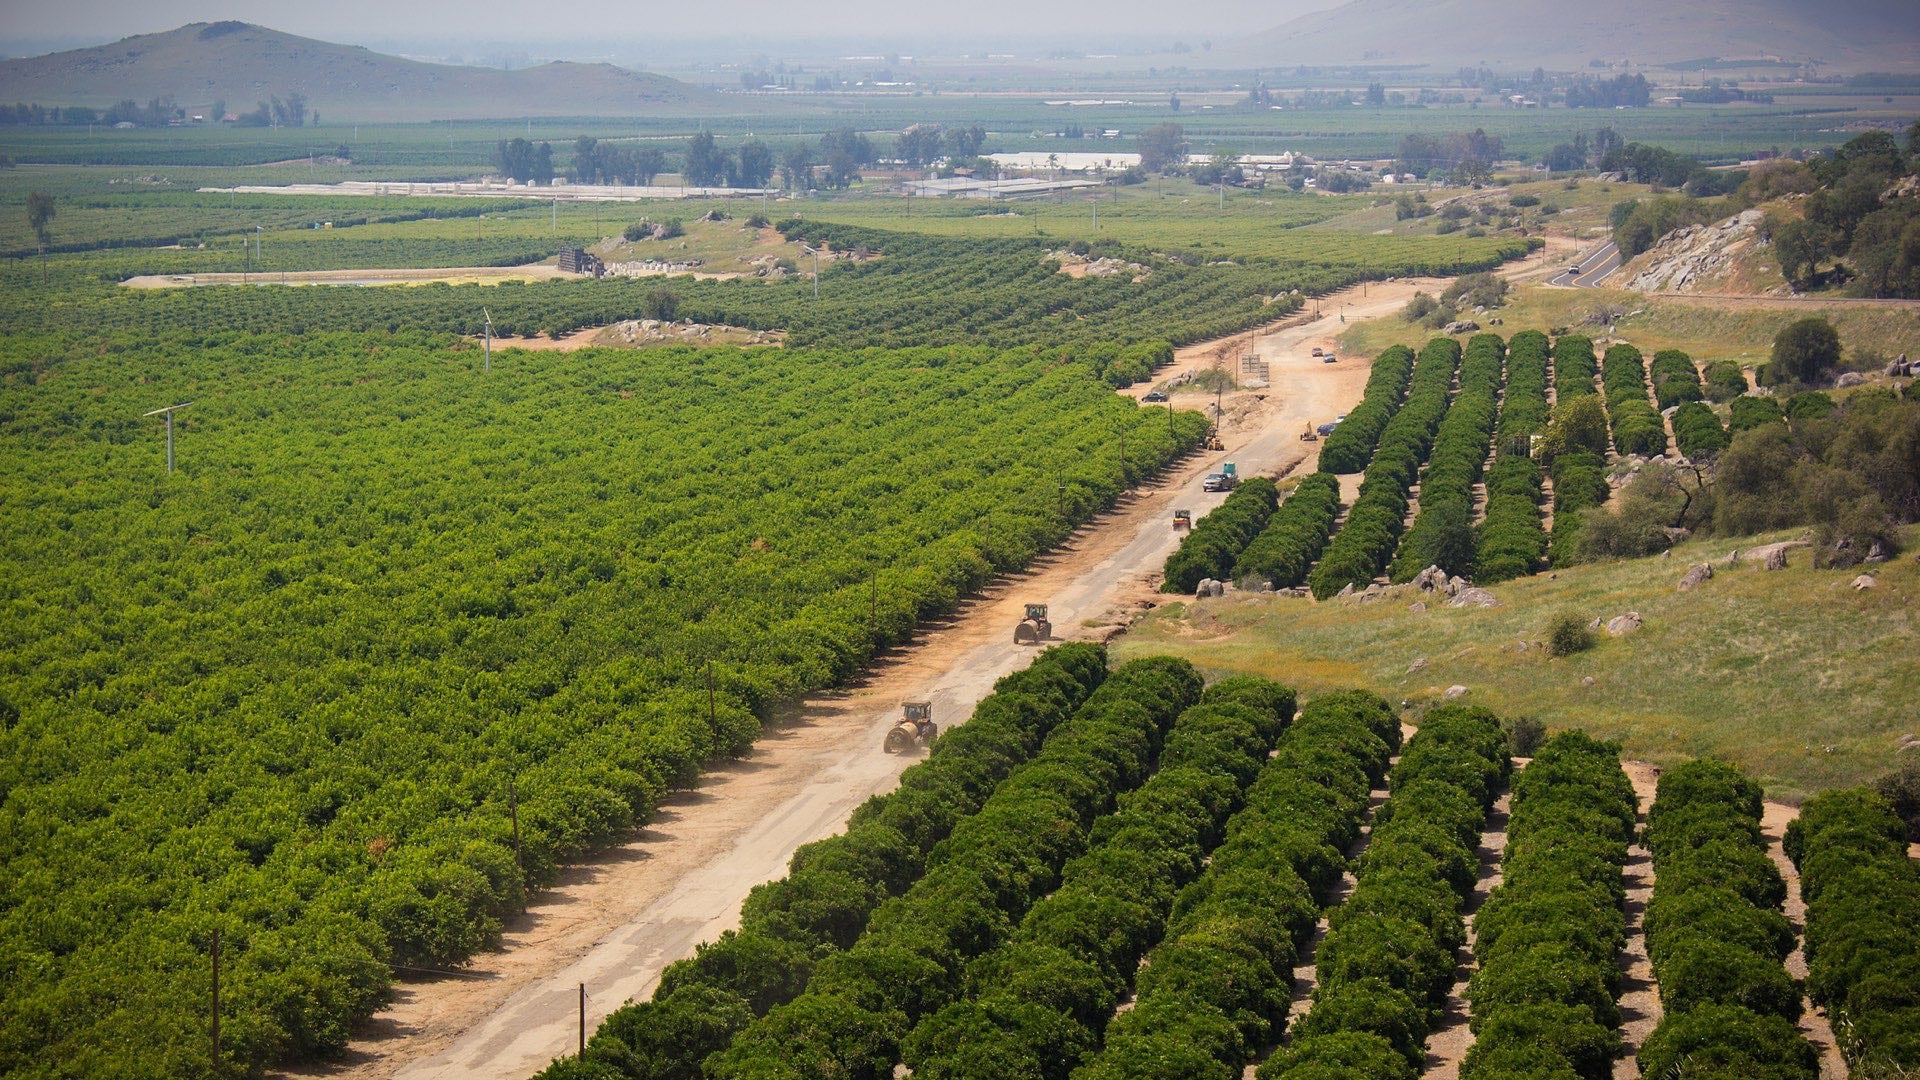
In California’s Central Valley, where one-fourth of the nation’s food is grown, many residents cannot drink or cook with the water that flows from their faucets. Several of the region’s small agricultural communities deal with dried-up wells, defective underground pipes, and water contaminated with bacteria or nitrates from fertilizer runoff. Families, some already facing poverty levels, must often pay for bottled water on top of their monthly water bills and, in some cases, struggle to find ample supply in their local grocery store.
Though a 2012 state law mandates safe, available water for all residents, more than one million Californians lack access to clean water—many centered in low-income and Hispanic/Latinx communities, according to the California Office of Environmental Health Hazard Assessment.
“A lot of times, when we’re meeting the community, we’re going to somebody’s home and seeing how they’re living,” said Denise England, director of Water Resources for the County of Tulare. “Through the drought, we got a quick education and experiences of conditions that, in 2016 California, you couldn’t believe.”
England is part of a team in California’s Tulare Lake Basin working to assess current water needs, especially those affecting disadvantaged communities that rely on wells and small water systems.
Water trouble is nothing new to California’s Central Valley communities, where an estimated 254,000 people are at risk for nitrate contamination in their drinking water.

In Seville, a majority Hispanic or Latinx community, home to about 500 people from mostly farmworker families who support the nearby citrus groves and dairies, the struggle for safe water waged for 10 years. Residents reportedly spent $120 per month on bottled water which, for most, was nearly 10 percent of their income. The town was cited by the United Nations in 2011 for “decrepit plumbing and public neglect.” Upgrades to the old small water system are taking a phased approach—a new well, new pipes, and connection to a system in the nearby town of Yettem. The project took heavy lobbying from residents and media attention to win a $4.1 million state grant.
“People are just now able to drink the water coming out of their taps in Seville,” England said. “We have to be able to have a connection to the people and stay the course for the communities.”
Six miles north of Seville, a similar hardship is hitting the farmworker community of East Orosi, where 500 residents can’t drink the water for fear of contamination from chemical fertilizer and dairy manure. A recent news story connected failing water infrastructure to the legacy of rural redlining, noting that 80 percent of disadvantaged communities without potable water are less than one mile from those with safe drinking water.
Fifty miles south, in the town of Earlimart, 8,000 people have gone without safe water since May of this year. Reports point to one failed well and another contaminated with twice the legal limit of the now-banned pesticide 1,2,3-trichloropropane (TCP). A state order warned residents to boil their water to kill bacteria that could cause intestinal illness—many say their water supply is intermittent and has a noxious smell. With 40 percent of locals living below the poverty line in a predominantly Latinx community, according to census data, the cost of bottled water is untenable. And, even if they could afford it, supply at local stores is limited.
While lawmakers, activists, and local water authorities grapple over what to do and who should do it, England and her colleagues are working to get a comprehensive picture of the situation in Tulare County.
They hired Provost & Pritchard Consulting Group to collect and map relevant data about water supply systems, wells, water quality, and the people affected through a grant from the California Department of Water Resources Integrated Regional Water Management Program. For managing and mapping the data, the team is using a geographic information system (GIS). The intent is to one day deliver safe water throughout the region in a way that’s consistent and equitable.

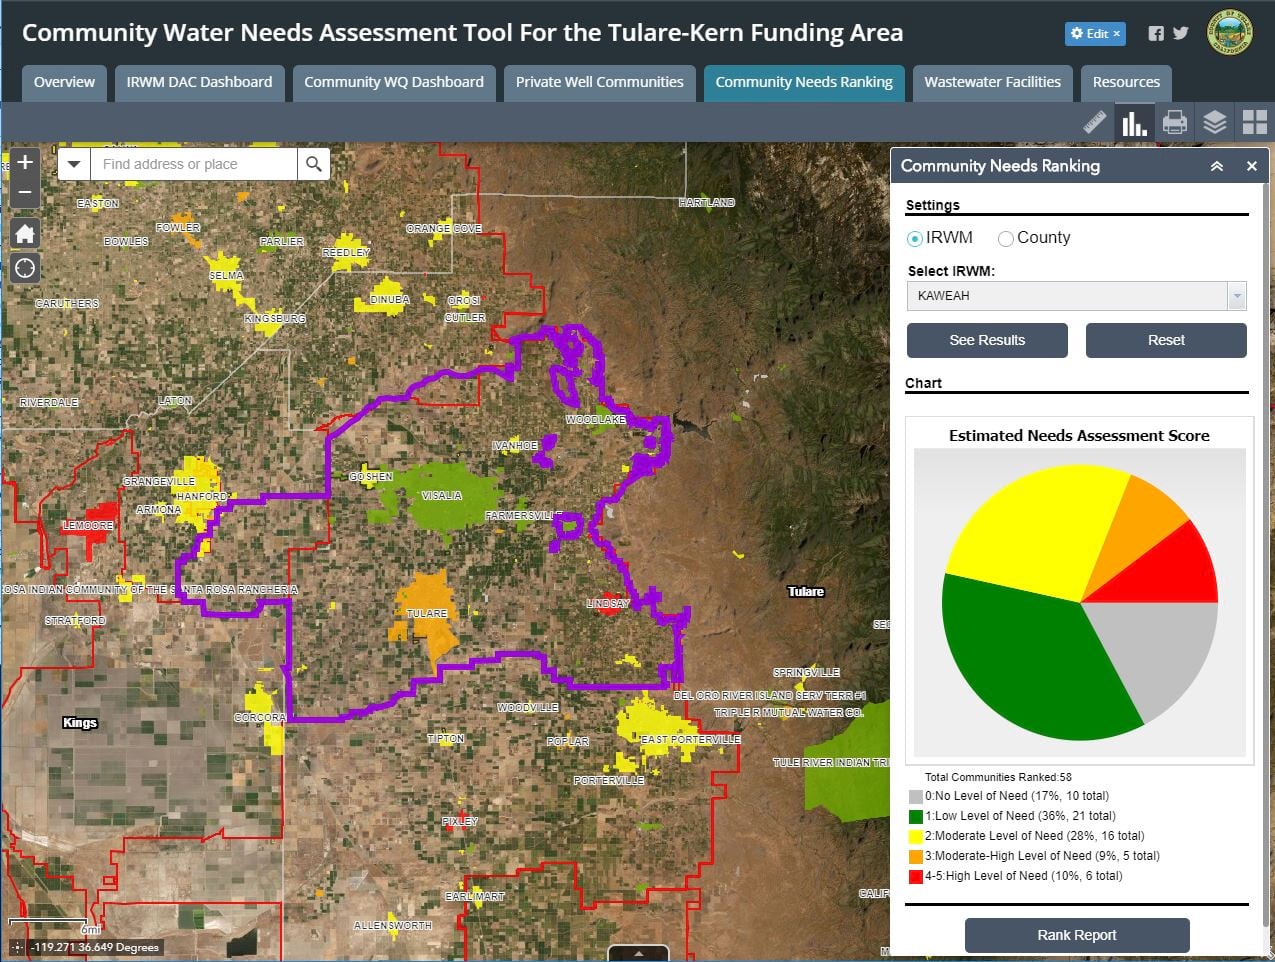
“Layers of complexity sometimes lend themselves to mapping, such as chemical contaminants,” England said. “Other issues, such as some communities in need of a water board … that’s a harder characteristic to map, but we are able to review technical and some managerial needs through a scoring system and represent that on a map.” Maps will be shared with government representatives, community members, groundwater sustainability agencies, and private businesses.
England is working with Gavin O’Leary, senior GIS specialist for Provost & Pritchard Consulting Group, a firm that specializes in civil, environmental, and agricultural engineering. O’Leary started by assessing available data from previous efforts in the region, stored in static reports.
“The goal was to create something that can live on in time,” O’Leary said. “We wanted to make the information more alive and more useful. Once you show somebody data, and they understand what they are looking at, it turns into other questions and may point out a problem somebody didn’t know they had.”
Before O’Leary and his team could create comprehensive maps for visualizing the Tulare Lake Basin water supply data, they needed more information—about wells, small water systems, off-the-map communities, and all things water related in the southern central valley.
All relevant data can be added to the GIS for mapping, sharing, and analysis. O’Leary accessed an Esri basemap showing high-resolution aerial imagery and combined public data from local municipalities and state agencies. Then, he worked on creating a data layer for all communities in the project area, which included most of Tulare, Kern, Kings, and Fresno Counties. For communities not designated by the US Census, he needed data that was not publicly available—information that could come only from local knowledge.
The project team created community surveys asking residents about their water and septic or sewage systems. Some responses came in electronically, others had to be collected by going door-to-door with the help of Self-Help Enterprises, a community development organization and project partner.
Since the project centered on disadvantaged communities, O’Leary and his team needed to classify communities using household income statistics from the US Census or income surveys. They also integrated state regulatory information such as source of supply, water quality, violations, and compliance issues documented by the California State Water Resources Control Board, Division of Drinking Water.
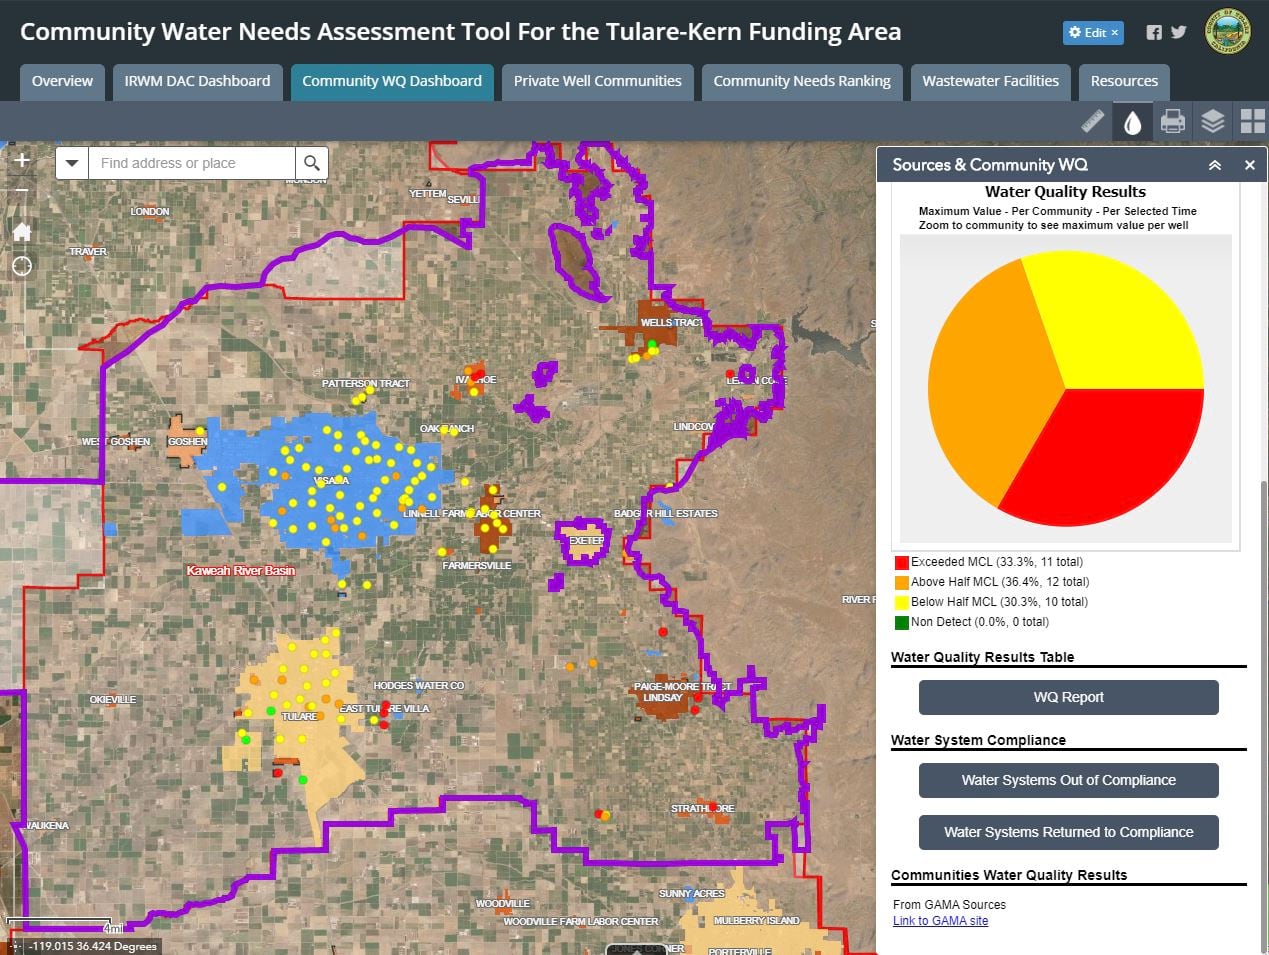
Once O’Leary and his team collected all the data they needed, they created ArcGIS StoryMaps—narrative web pages that combine interactive and authoritative maps with text, images, and multimedia content. The maps were designed to showcase communities most in need of water system improvements within the project funding area.
“We would demo story maps to the stakeholders, and they would start developing questions specific to their needs,” said O’Leary, speaking on how his team iterated the maps based on user feedback.
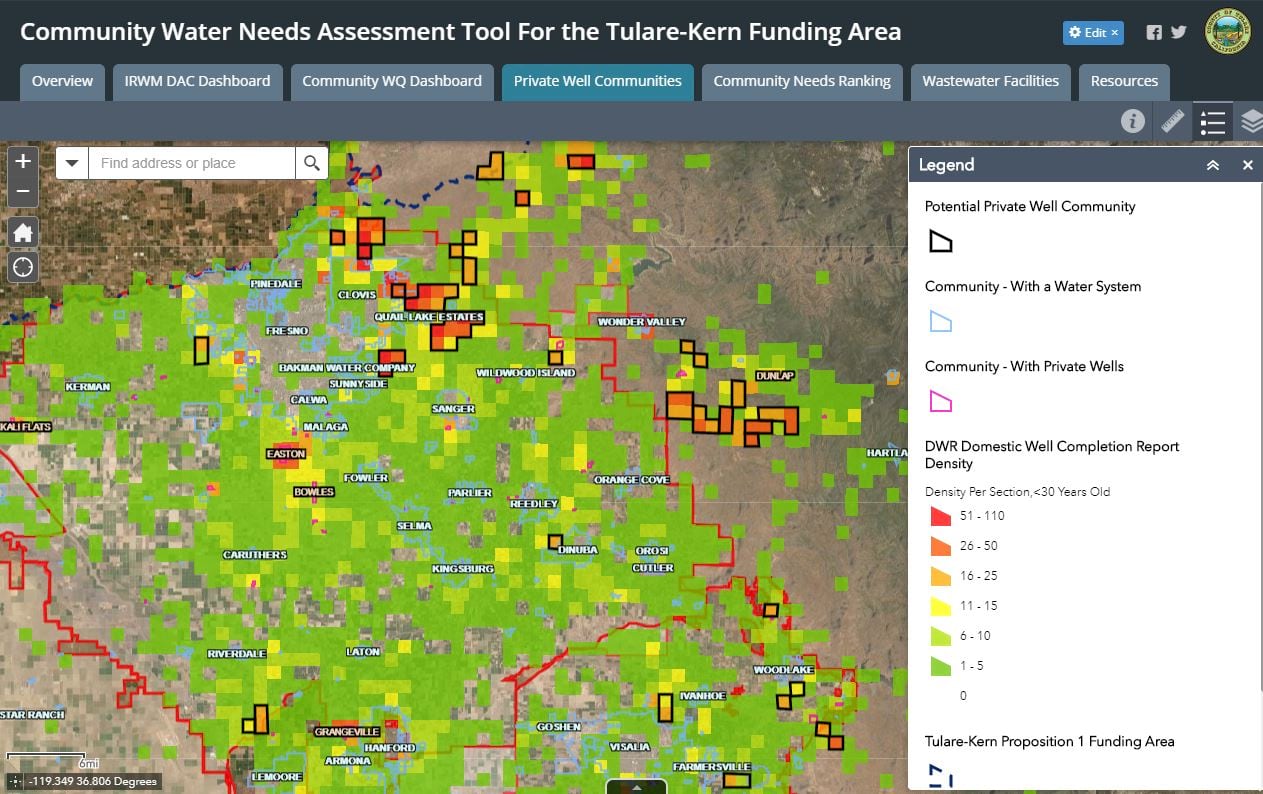
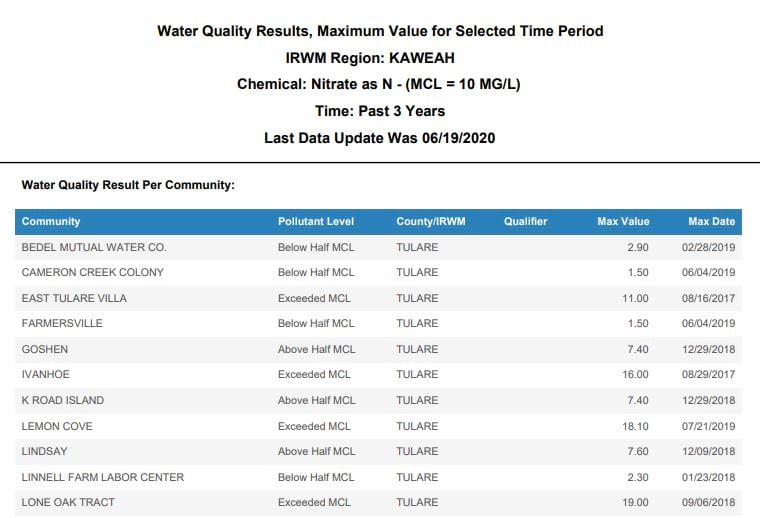
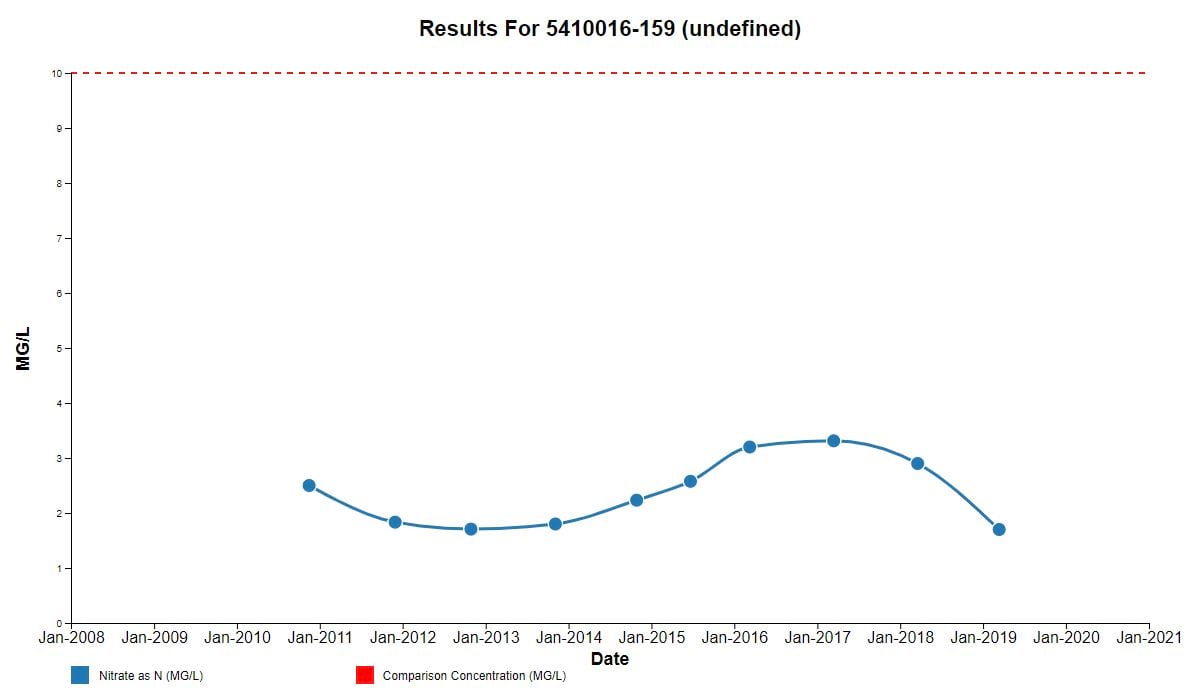
The maps summarize key data in a compelling way, and in a format that allows information to be queried. Map tabs offer thematic data summaries for community needs, wastewater facilities, private well communities, water quality, and disadvantaged communities. Users can get down to details, even to the individual well to look at water quality history. They can also generate reports to show a community’s pollutant levels and compliance.
Once the maps were refined, the team was ready to share them. They also provided an instructional video for users.
“When the story maps rolled out, it was like the heavens opened,” England said. “It’s going to revamp the way we look at our communities.”
Though the data and maps are ready, the water infrastructure upgrades are still far from completion in many areas as the communities need capital investments from the state government or private businesses.
“Even when you understand the problem, the solution is not always fast,” England said, adding that the county was turned away for state funding of a proposed surface water treatment project that aimed to serve seven communities, though they have received state support and funding for other projects. When California conducts its own statewide water resources needs assessment, England is hoping they will use the dataset Tulare County created as a framework.
When representatives from local Integrated Regional Water Management Groups are working to secure funding, they can use the maps to see which disadvantaged communities have the greatest need and know they are using current information.
The data and narrative maps could also motivate private businesses to seek grants for developing treatment technologies. England said, “What the tool has shown so far is, if there is a private company willing to give a solution, we can connect them with communities.”
Discover how GIS enables an intelligent water system. To learn how governments, nonprofits, and businesses can address racial inequity, visit Esri’s website on Racial Equity. Explore deeper GIS resources for racial equity on the Racial Equity GIS Hub, including a dataset on redlining and exposure to urban heat islands.

April 27, 2020 |
September 24, 2019 |
December 10, 2019 |