November 15, 2017 |
Brett Dixon | Conservation
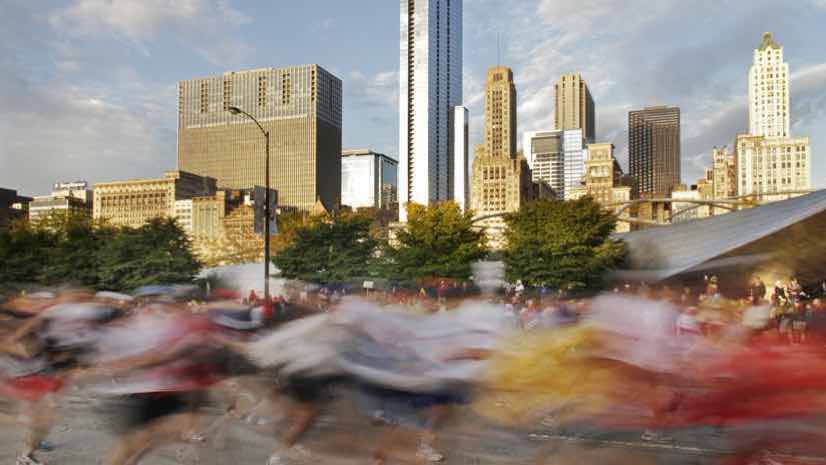
Feeds from Runners Convey Up-to-date Details About the Course
Runners love the Chicago Marathon for its mix of raucous urban canyons filled with cheering fans, and quiet and colorful leafy side streets. Chicagoans are always into an event, with a lot of fun-loving people turning out to encourage the runners and keep them smiling through the pain. The course also runs flat and fast, which brings many new runners who are reaching for their personal record. It’s one of six World Marathon Majors, and world records have been broken there four times.
The 40th Bank of America Chicago Marathon took place this year on Sunday, Oct. 8. The race is capped at 45,000 runners, and this year, according to the race website, 44,508 finished the race, with 1.7 million spectators. The elite runners add to the spectacle, with $500,000 in prize money on the line.
This year’s event took place just seven days after the mass shooting in Las Vegas. In addition, the bombing at the 2013 Boston Marathon is always in the back of every marathoner’s mind. As the first World Marathon Major after Boston, Chicago had already substantially augmented its security plan for the 2013 Bank of America Chicago Marathon, and continues to make adjustments to it from year-to-year. Given this backdrop, community safety and security efforts were increased this year, with the City of Chicago adding real-time sensor feeds to their event awareness.
Chicago’s Office of Emergency Management and Communications (OEMC) added runner locations to their shared map by linking to live data from the timing mats on the course that collect data from the RFID chips each runner wears. This was made possible via a partnership with Bank of America that provided key course details and helped the city coordinate with a chip time vendor and Esri Professional Services to make this happen.
Runner awareness provides great insight into what’s happening where, as the race progresses. In the past, there have been several situations where runner awareness would have proven helpful on race day. Last year, a hostage/barricade incident unfolded a block off the course. An incident on a bridge several years ago caused the race to be re-routed. Both scenarios were handled quickly and effectively, but knowing where the runners were on the course would have helped spread awareness and assurances to all, and a more coordinated response.
Projecting the location of runners, along with details about the location of personnel and assets, on a map that was available on computers and devices as well as projected on a large screen in the OEMC gave all the first responders a common and current understanding of the race status.
“My leadership [Executive Director Alicia Tate-Nadeau] has an expectation,” Thomas Sivak, deputy director of the OEMC, said. “She wants to come into the room informed and not have to ask a single question to know what’s going on.”

Coordinated Force
In light of the recent mass shooting, the Chicago Police Department increased its presence, alongside a heightened presence from the Federal Bureau of Investigation (FBI), the Federal Emergency Management Agency (FEMA), the Department of Homeland Security (DHS), the Illinois State Police (ISP), and other agencies and nonprofits. That’s a lot of activity for OEMC to coordinate.
“Chicago is a special event-driven city, and this is one of our biggest events of the year,” Sivak said. “We have worked hard to establish a common operating picture to support our decision-making processes. Adding a real-time awareness of runners helps us know the size and complexity of any incident, and helps us manage the consequences.”
Given the 26.2-mile length of a marathon, most marathons take place across many jurisdictions. In Chicago, the entire course is contained within the city. This makes it easier to get every city department on the same page regarding all the details of the event. A geographic information system (GIS) is central to this effort, with Web-based forms for each department to input details about personnel, their posts, and the assets each agency deploys.
“Data accuracy and availability continue to increase, because people see the benefit when it’s all displayed at the mapping endpoint,” said Joe Kezon, GIS manager at the OEMC. “Rather than going to a paper document to understand where officers are deployed, they can query and see it all on a map to gain a visual perspective.”
The OEMC is where the city’s police, fire, and emergency medical service are all integrated in one dispatch system, and where all aspects of Chicago’s emergency services are coordinated. The OEMC also contains the Traffic Management Authority, which deploys traffic control aides to work with CPD to ensure participant, spectator and motorist safety along the route. In addition, the OEMC’s Public Safety Information Technology Section, along with the City’s Operations Center, monitors thousands of CCTV cameras throughout the city. The GIS acts as a central integration point to provide overall situational awareness.
“We have to remember that GIS is not mapping,” Sivak said. “That’s just a piece of it. It’s the data inputs and the outputs, and the coordination that takes place on the backend that paints the picture and helps us with our decision process.”
The shared view that GIS provides, combined with rehearsed scenarios, means that everyone knows what to do, with the added assurance that everyone knows where you are and what you’re dealing with.
“It’s always beneficial to think about how I would use it,” Kezon said. “I think it would be a great thing for bike paramedic teams to see where they’re being dispatched, and the information associated.”

Real-time Understanding
The City of Chicago has prior experience displaying real-time data in their GIS for a high-level security event. In May 2012, the city hosted the NATO Summit. For that event, the federal agencies saw Chicago’s system and decided to rely on it, and integrate with it, rather than send all their GIS data and people to the event.
“We were able to display the GPS location for each of our Chicago Police Department officers, and we integrated the FBI’s Blue Force Tracker system to see where everyone was deployed,” Kezon noted.
This real-time component was a first for the city. Since then, the city has increasingly relied on GIS for major special events. They have added a link to all the city’s cameras to see live video feeds. They’ve also been eager to add to their real-time awareness.
In preparation for every event, the city gathers data from the event organizer as well as plans and personnel from each department. GIS data is displayed, along with geofences that trigger when things enter or exit the event area. The geofences are also used to display and send to the OEMC only the 911 calls within the event area.

Always Evolving
At the OEMC officials are thinking about a quick response as much as they’re thinking about the recovery and aftermath of each incident.
“I knew fully that if I looked at Joe and asked him to turn on a layer of data, that he would find it and bring it over so that we wouldn’t lose any ground,” Sivak said.
If an incident involved the need for shelters, a data layer could quickly be added to show the location and capacity of each of the city’s emergency shelters. If an incident required a strong local response, a data layer of staging areas could be added and shared with nearby personnel who would then concentrate the needed equipment closer to the incident.
Having a record of what happened where and when proves useful after the event to examine any incidents for future improvement. It’s also a crucial piece if an incident reaches the level where briefings to executive leadership and chief elected officials become necessary. The OEMC used a story map to capture this detail on a regular basis. The Story Map records information in a way that can be scrolled and clicked to uncover details, and to understand the response as an incident evolved.
“Our top-end site is for the marathon, but we have events that happen every single weekend,” Sivak said. “We want to do more. We have to adapt on the fly, track things appropriately, and capture information to mold our response to every situation.”
Learn more about Esri’s solutions for creating Safe Communities, and the ArcGIS GeoEvent Server that allows you to monitor your most valuable assets on a map in real time for better decision making at any moment.