
When coronavirus disease 2019 (COVID-19) stay-at-home orders first began to pop up throughout Tennessee communities, the state’s parks saw a sudden increase in visitors.
Alarmed by the huge number of local and out-of-state guests visiting during that first week, park managers grew concerned about potential health risks for visitors and staff. Tennessee governor Bill Lee quickly responded by closing the state’s 56 parks. At the time, officials were uncertain of when and how to safely open them again.
Staff at Tennessee State Parks needed a way to help the governor’s office monitor the COVID-19 crisis, make policy, and create guidelines. Moreover, they needed a system that would help state park managers plan reopening strategies. They also wanted to keep the public informed about which parks are open and what restrictions are in place.
Since location plays a crucial role in COVID-19 safety and prevention, state leaders decided to use a geographic information system (GIS) to monitor and manage the crisis. For years, Tennessee State Parks had been using the technology, and a team of professionals had kept up with location intelligence advancements. They had already built numerous GIS applications for managing park and business operations, so it was not a stretch for the department to create a GIS strategy specifically designed to handle the pandemic.
Managing Information Essentials
Rachel Schultz, parks and conservation GIS lead, and a team at the Tennessee Department of Environment and Conservation created a location strategy that would help leaders launch safe initiatives. First on the to-do list was to determine each park’s risk factors and levels. Next was to create a dashboard that would give the governor’s office actionable information. This information would be updated throughout the day as needed.
“Previous park closures were due to budgetary and economic concerns,” Schultz said. “These current and partial closures are caused entirely by public health concerns. It’s a new arena for us, as I believe it is for many organizations.”
Simultaneously, the GIS team expanded park staff’s technology capacity, developing apps and analysis to provide decision-makers with the location intelligence they needed. The team used a variety of data to support these tools, including existing information on parks, COVID-19 tracking data from the state health department, and modeling output data from the Institute for Health Metrics Evaluation (IHME). But the most valuable data came from the parks themselves, especially real-time information captured by park managers and rangers using ArcGIS mobile apps for data collection.
Analyzing Risk to Reopen Parks
Risk analysis plays a large role in understanding and managing response for state parks. To determine COVID-19 risk levels for each park, the GIS team created a web survey app to collect information from park managers. It asked them to rate their concern levels about continuing regular operations during the outbreak as low, moderate, or high. The survey also asked what specific situations were driving those concerns.
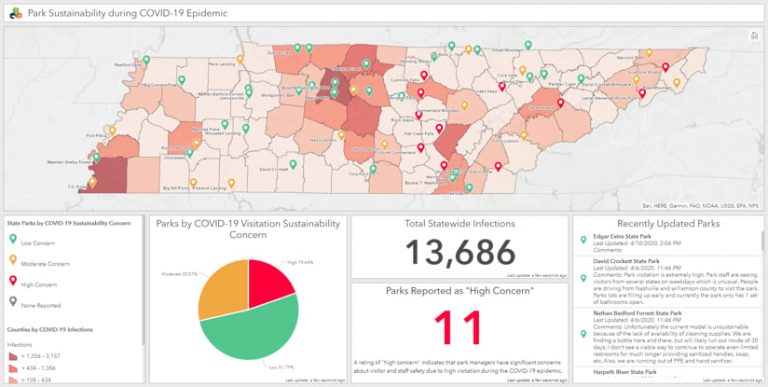
The team created an operations dashboard that showed the spatial distribution of parks with high concerns. It also used geographically weighted regression tools to find patterns that explained why some parks were more or less concerned with risk than others. Findings showed the highest concerns came from parks with rugged or steep terrains in which park rangers would be exposed to COVID-19 during rescues. Also, parks that had sufficient stocks of personal protective equipment (PPE) and cleaning supplies were more likely to give a low or moderate concern rating.
Deciding When to Reopen Parks
Staff used a GIS park sustainability dashboard to brief Governor Lee on the status of Tennessee State Parks. This allowed him to work on epidemic response including the difficult decision to temporarily close state parks.
During the closure, the team completed two more GIS projects. The first one tracked PPE and cleaning supply inventory at parks across the state. It helped management determine how best to distribute equipment and supplies among state parks. A dashboard measured status of the goal of getting each park fully stocked with everything they needed to feel secure upon reopening.
Within the parks, staff posted signage about closed trails, social distancing rules, and face mask requirements.
Informing the Public
Tennessee State Parks wanted to supply people with information that would be easier to read than a simple list. The GIS team lead worked closely with the park’s marketing team to embed an ArcGIS web app at TNStateParks.com. They built a publicly accessible, interactive map that interfaced with the GIS database.
Whenever a park’s status changes, the map automatically updates and shows the most current information. If a park experiences an unsustainably high amount of visitation over a weekend, the park can close or restrict admission and immediately show it on the public map.
A tenet of social distancing is to stay close to home. Although Tennessee encourages people to come out and enjoy state parks, it asks visitors to limit travel as much as possible. Fortunately, all Tennesseans can find a state park within a one-hour drive. The status map will quickly and clearly show the nearest park and its current status and restrictions.
“We have never experienced anything like this,” Schultz said. “GIS helps us to respond to these new and ever-evolving situations quickly and efficiently.”
Learn more about the applications of GIS for environmental and natural resources agencies.