July 5, 2018 |
Steve Snow | Mapping
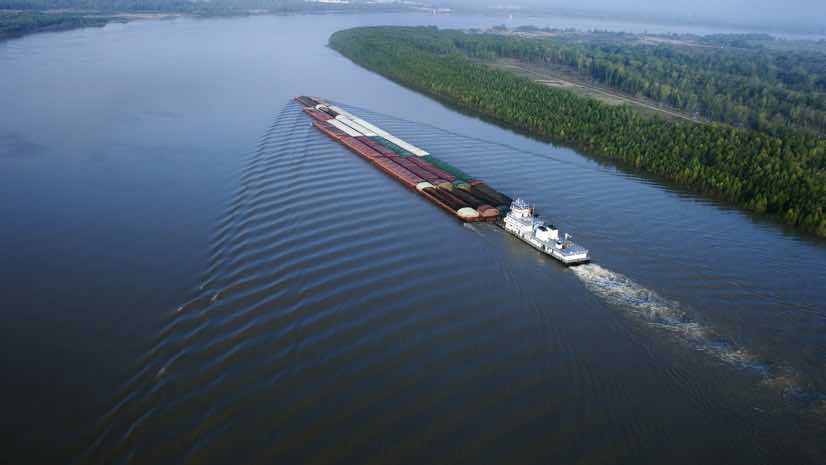
The Mississippi River marks a meandering divide between the eastern and western United States. But, this mighty waterway acts as more of a connector than a divider for the nation, carrying goods in both directions along its 2,320-mile path from the top of Minnesota to the Gulf of Mexico.
Each fall, barges loaded with soybeans and corn make their way from Midwestern Corn Belt farms down the Mississippi River to the Port of New Orleans for export. As the world leader in grain production, the US relies on this river to carry 60 percent of its harvest, amounting to more than $600 billion in annual economic activity.
Any supply chain disruptions to barge traffic on inland waterways can have ripple effects on the country’s economy. So, Mississippi River traffic must keep moving regardless of the pressing problems of aging infrastructure, drought, and flooding. Charged with managing the river is the US Army Corps of Engineers (the Corps) who provide flood control and maintain commercial navigation.

The Corps’ Rock Island District operates 314 miles of channel and 12 lock and dam sites on the Mississippi as well as 268 miles of channel and eight lock and dam sites on the Illinois Waterway.
Much of the Upper Mississippi infrastructure constructed in the 1930s has gone well beyond its engineered lifespan of 50 years. With more than $1 billion in deferred maintenance on Mississippi River locks and dams, the Corps must constantly monitor performance and make repairs to keep this infrastructure operational. Their work plays a vital role in the US agriculture economy.
A recent study suggests that failure of any of the 25 aging locks on the Upper Mississippi River could result in nearly 500,000 truckloads to move 12 million tons of grain on highways between the Twin Cities and St. Louis. Trucking that load would cost hundreds of millions of dollars more than barge transport and would damage already stressed roadways.
In maintaining the Mississippi River, Corps engineers must also be vigilant of unpredictable weather.
Drought conditions in 2017, coupled with the biggest harvests in 29 years, triggered shipping backlogs and swelled grain storage facilities on river banks to capacity. This backlog led to record high freight costs for a mode that is reliably the cheapest way to move bulk commodities (see sidebar).
Then in March 2018, high water volumes from heavy rains disrupted navigation at multiple locations. This flooding did not compare to the record floods of 2008 or 1993, but it did impact barge traffic. The Corps reduces the length of barge tows during floods, often restricts traffic to daylight hours as opposed to usual 24/7 operations, and can, if needed, close the river to traffic.

The Rock Island District is at the crossroads of river transport in the country. It maintains crucial connections for goods going down the Mississippi to the Gulf of Mexico and up the Illinois Waterway to the Great Lakes and on to the Northeast by way of the St. Lawrence Seaway and the Erie Canal.
To constantly monitor and manage hundreds of miles of rivers, the Corps uses a geographic information system (GIS). Their GIS allows them to record, analyze, and visualize data about the river and the forces that affect its flow. They can then use GIS to share this information internally and with the public via interactive maps.
Inland waterway maintenance differs greatly from the Corps’ work on fixed channels at coastal ports. River levels can vary by a depth of more than 30 feet over the course of a year. Yet the Corps is mandated to ensure these ever-shifting navigation channels, intended to be 9 feet deep and 300 feet wide.
“You kind of have two rivers: the water and the sand on the river bottom, and they’re both moving,” said Dan McBride, geographer, US Army Corps of Engineers, Rock Island District. “I would liken shoaling [the accumulation of sand] in a deep draft port channel to a pothole that slows traffic and reduces cargo loads but shoaling in a shallow draft river channel is more like a sink-hole that shuts down a road.”

The Corps and its contractors conduct regular hydrographic surveys using a variety of measurement tools and sensors aboard special survey boats. Sensors include sonar sensors that use sound waves to reveal a three-dimensional view of the river bottom.
The surveys identify changes to the channel, such as shoaling that constricts channel width or build-up that reduces channel depth. This information factors into immediate dredging action or more permanent engineering actions such as the construction of check dams in river tributaries to reduce their force. In addition to regular surveys, the Corps gathers details from US Geological Survey gauging stations that supply data about water flow and the force of any flooding.
“On the navigation side, flooding drops sediment at the confluence of rivers. It’s important to get out there and survey as soon as possible to inform the dredging operations and restore the channel,” said Tony Niles, assistant director for Civil Works Research and Development, headquarters, US Army Corps of Engineers. “On the flood risk management side, the data need is different. The purpose isn’t about maintaining depth, it’s to see where flood waters are, how high they are, and the potential to overwhelm river banks and levees.”
Recently, the Rock Island District started using an enterprise-wide system called eHydro that includes tools and workflows to catalog, organize, and share hydrographic surveys. By turning to a GIS-based system, and automating the process with Python scripting, the Corps is now able to rapidly turn data into a visual product for dredge coordinators to review.

With all their surveying work, and a growing need to share details with vessel captains, the Corps was given authority by Congress in 2001 to maintain navigation charts for the country’s inland waterways. Data the Corps regularly collects for waterway maintenance and flood control activities provides input to make the Inland Electronic Navigational Charts (IENCs).
Coast Guard regulations require all vessels to carry charts, and electronic charts have an advantage over paper.
“Electronic charts offer increased detail and the ability to offer rich data instead of just a symbol on paper,” McBride said. “They also allow far more frequent updates, ensuring the charts on a vessel are up to date.”
The production process for electronic maps has another advantage—it can be automated.
“We can make charts across all 15 inland districts for 8,000 miles of inland waterways that are all consistent, timely, and done as a single Corps-wide product as opposed to district by district,” Niles said.
As the IENC program has progressed, data products have improved, and more captains have shifted to the digital system.
“Our charts were pretty rough at first, but they have had several major refreshes,” McBride said. “Boat pilots now tell me that our charts are excellent and are viewed as gospel. It’s humbling to have the responsibility to produce something that is trusted so much.”

The Corps continues to look to sensors and systems to address the complexity of its challenges. They have recently tapped into signals from the automatic identification system (AIS) the Coast Guard maintains, receiving the signals that every vessel transmits in order to avoid collisions.
“The Corps has been tracking waterway usage for some time and has excellent statistics about how much cargo is transported on the nation’s waterways,” McBride said. “AIS data allows us to see vessel traffic at a granular scale. We’ve started comparing our recommended sailing line against the most traveled paths to reveal discrepancies. It’s one more tool in our toolbox to inform maintenance decisions.”
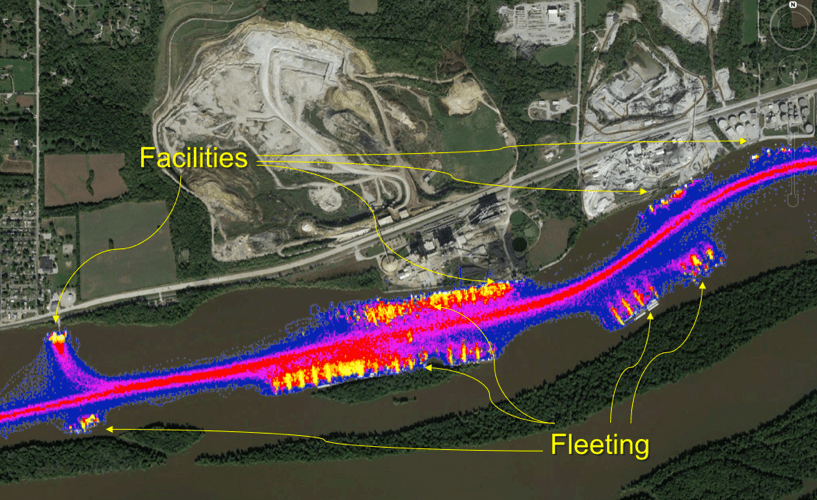
Corps researchers are looking at AIS data for other purposes. One team is looking to obtain real-time AIS signals to understand incoming traffic and improve the time it takes to get through lock sites. Another hopes to use AIS to both receive and send information to vessels. And, one more team is looking at the data to understand typical cargo trips and the time it takes for trip completion. The AIS is enabling the development of the River Information System (RIS) that will make real-time information available to vessels, waterway operators, and service providers for safer and more efficient navigation.
“With AIS data, we’re seeing activity,” McBride said. “It confirms things about the behavior of barge traffic and reveals more insight into local traffic versus those that are traversing through. My feelings are that we have just started to scratch the surface of what’s possible.”
Visit the Corps’ Operations Dashboard to see the number of surveys and survey extents across the country. Visit ArcGIS for Maritime to learn more about navigational charting.