


May 31, 2022 |
Sydney Rich | Urban Planning
August 16, 2022
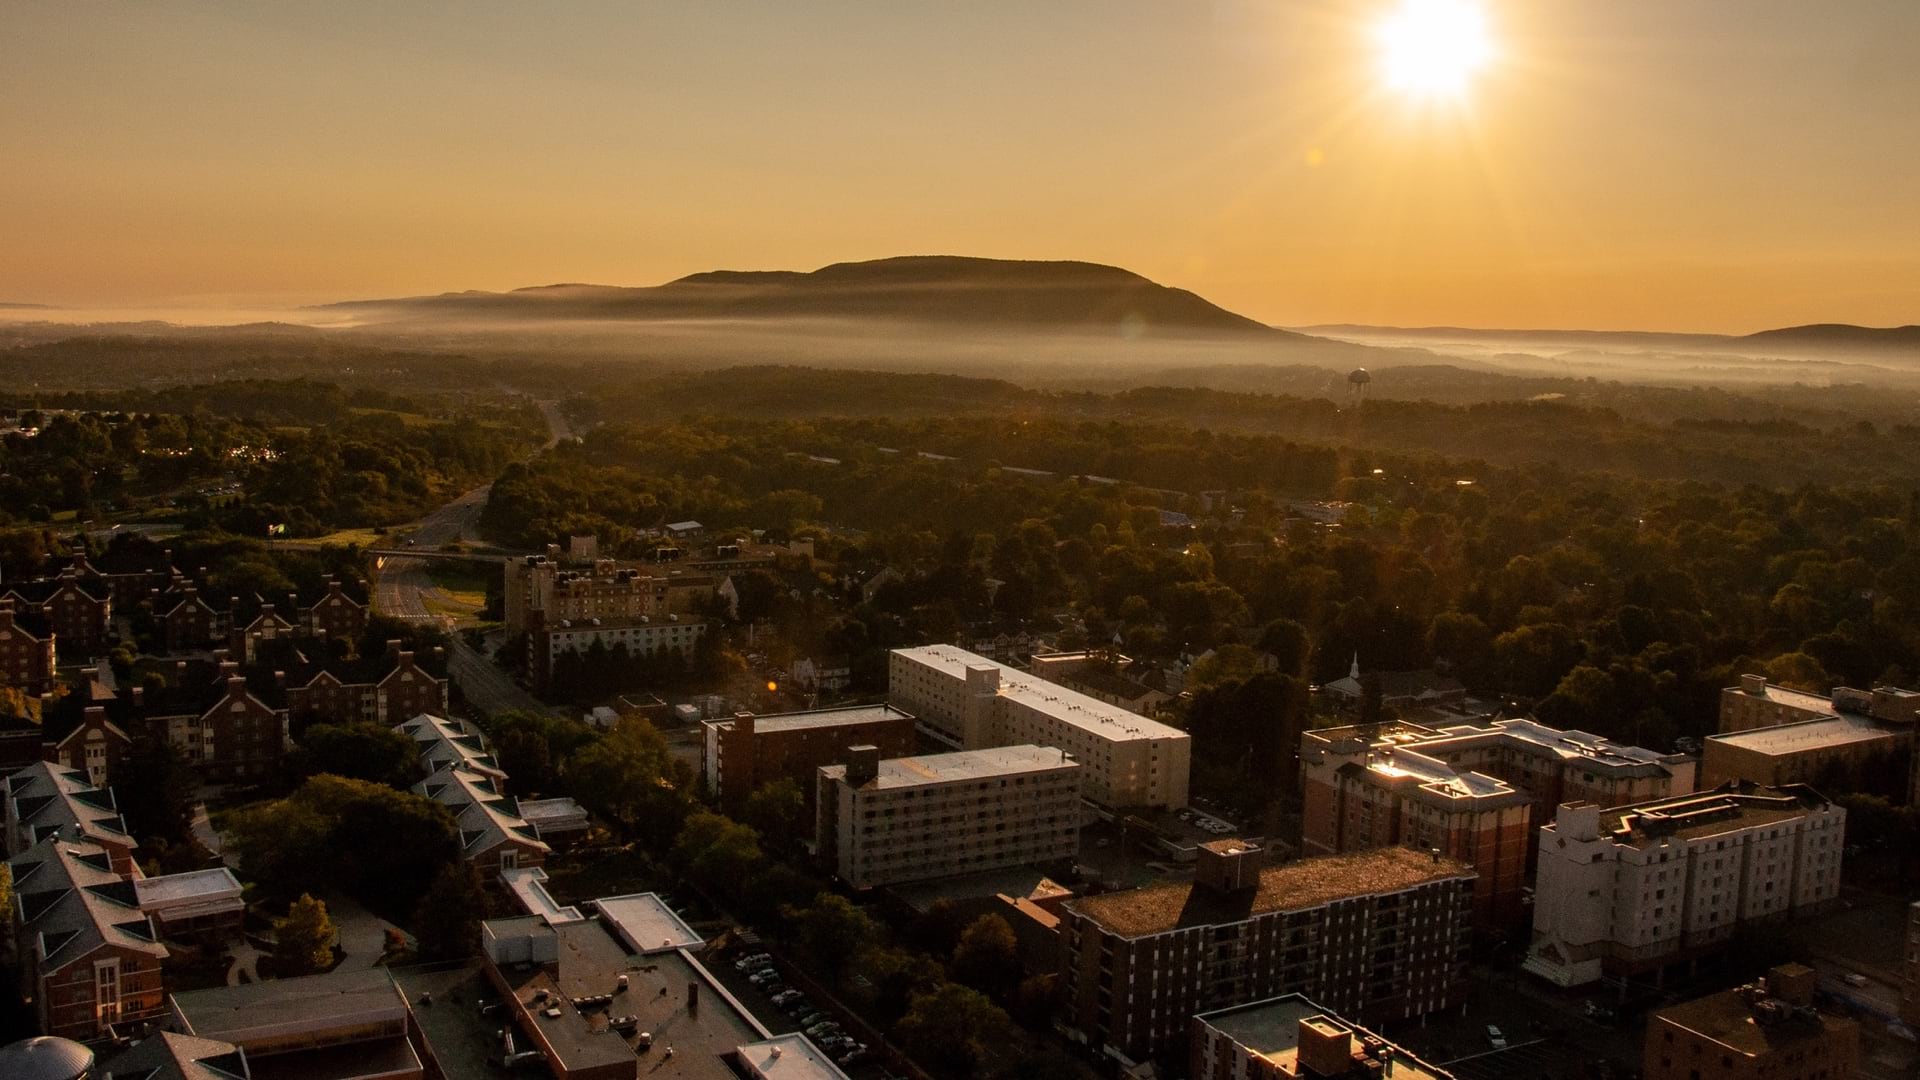
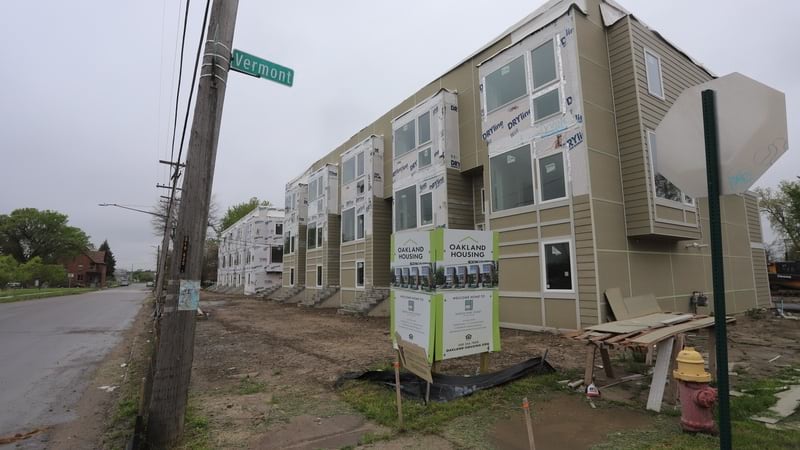
The Detroit region is growing and thriving. The people there benefit from connected small towns, dynamic urban centers, active waterfronts, diverse neighborhoods, leading educational institutions, and abundant agricultural, recreational, and natural areas. SEMCOG, a seven-county regional planning organization, serving the 5 million people in the metro Detroit region, has its eye on all of these elements. It helps local governments and residents see how each of these assets are vital parts of what makes the region so livable.
Detroit has some of the most visible signs of transformation. A large open lot in central downtown—the result of the 1998 teardown of the flagship Hudson’s department store—is being filled by what will be the city’s second-largest building, set to contain a dynamic mix of event space, stores, restaurants, hotel rooms, offices, and residences.
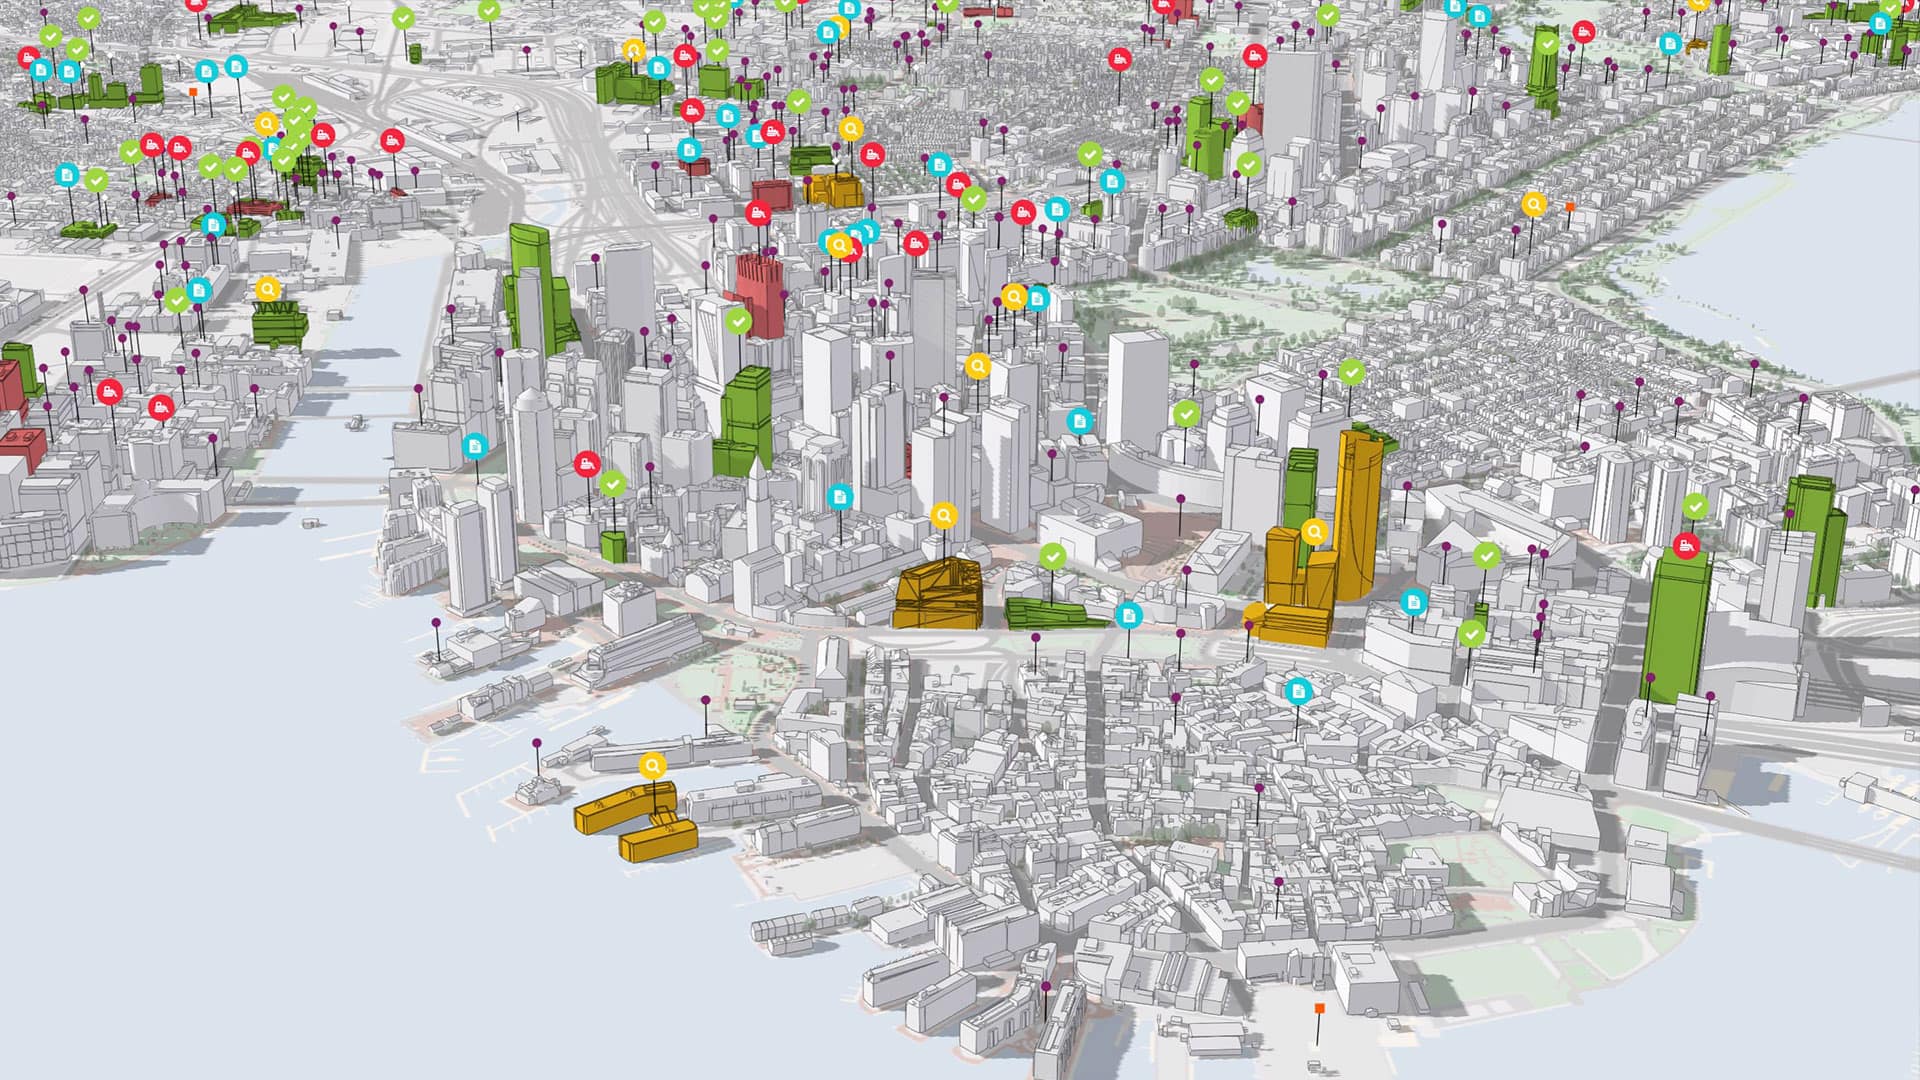
Evidence of the rich mix of the area’s assets and revitalization are now available for anyone to see in 3D maps showing not only the city’s present but also the entire region’s future. Development plans for the next 30 years in Detroit and a couple hundred surrounding communities are now clearly visible thanks to what’s being recorded in the geographic information system (GIS) used by planners and municipal leaders in southeast Michigan.
“We wanted to show the potential of a site even if all we had was a city mayor saying, ‘We’re going to get this developed and it’s going to have a hotel, restaurants, and condos.’ We needed something we could see and share, beyond just our imagination,” said Jeff Nutting, forecast coordinator for SEMCOG.

Using GIS to compile details and conduct analysis every five years, Nutting oversees SEMCOG’s 30-year forecast of population, housing, employment, and land-use changes.
The forecast supports spending decisions on infrastructure management—such as water, sewer, and transportation projects—including what roads and bridges to widen or repave.
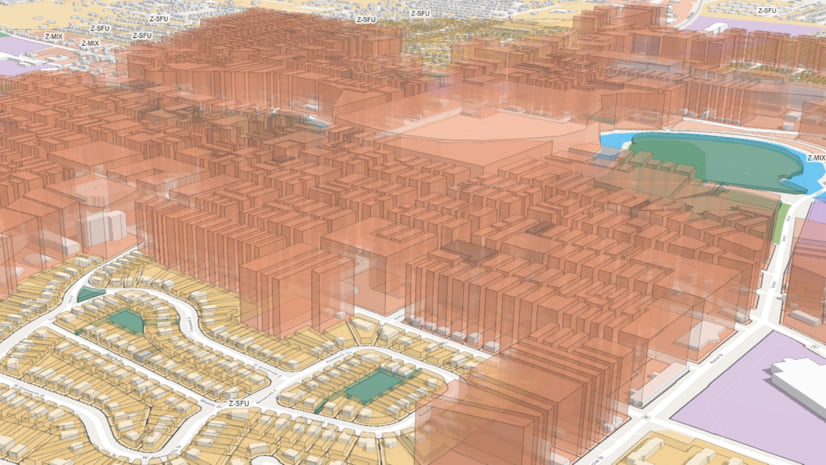
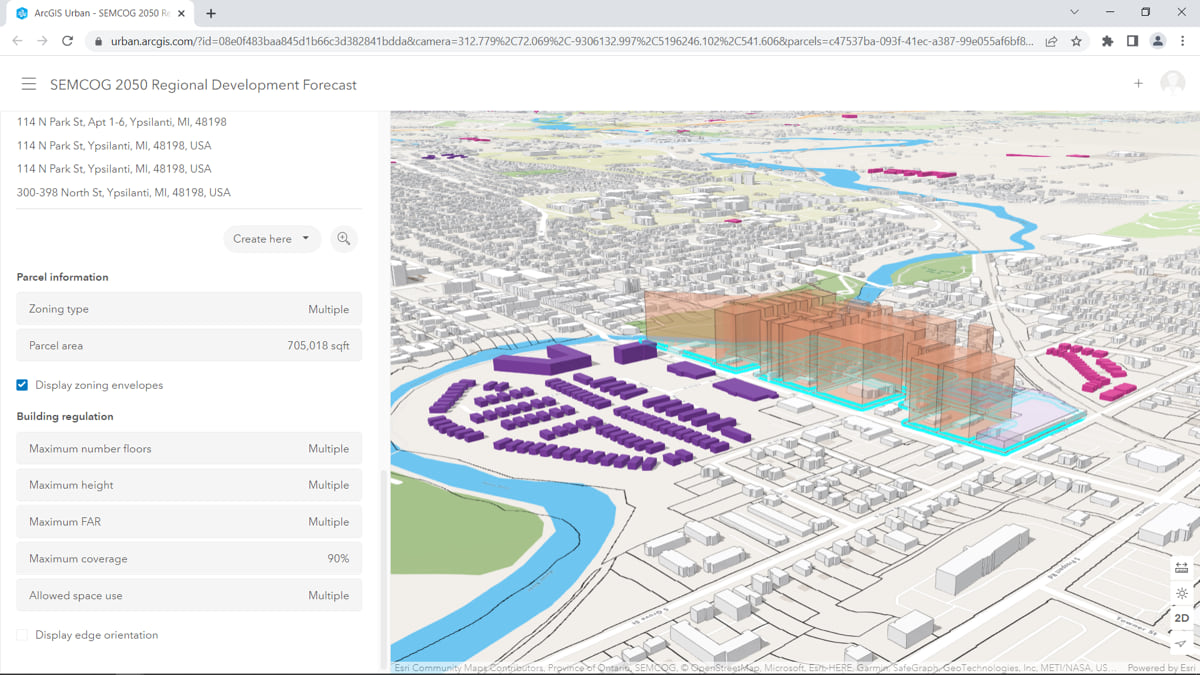
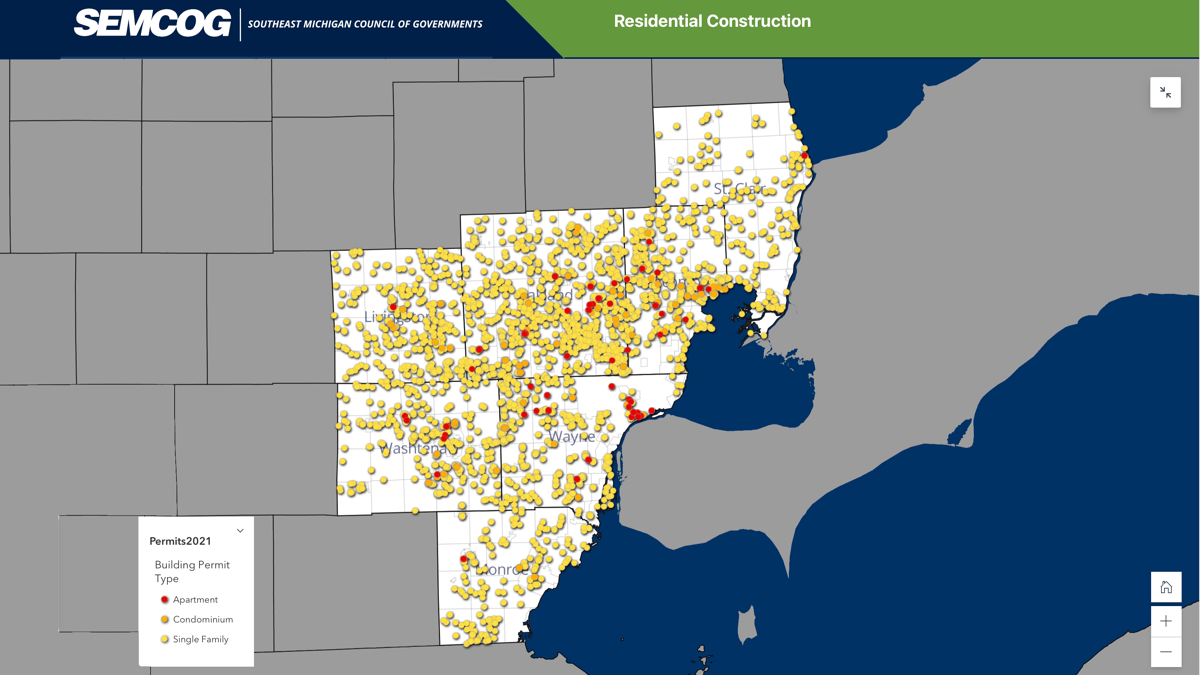
For the agency’s most recent forecast, SEMCOG asked 232 communities in the region for their development plans in fine detail. Instead of simply asking how many units were planned for a specific parcel, SEMCOG captured site and concept plans that show how roads and buildings are laid out, how tall the buildings will be, and how much square footage they will have. The site plans also convey the amount of pavement planned, which informs impervious-surface calculations for stormwater planning.
“We thought, if we used planning documents it would be something they already have and we would be speaking their language,” Nutting said.
More than 200 communities contributed plans and data this time, compared to fewer than 100 in 2016.
Most planners in the region are so busy managing developments, they don’t have time to calculate growth. SEMCOG envisioned a new kind of outcome. By inputting plans, the forecasting team would provide a detailed and realistic model to visualize what was coming.
If the planner didn’t have a site plan for a planned development, Nutting and his team used ArcGIS Urban to design a concept plan for the site. The planner was presented with some option of development type, and then a rules-based model showed what that would look like.
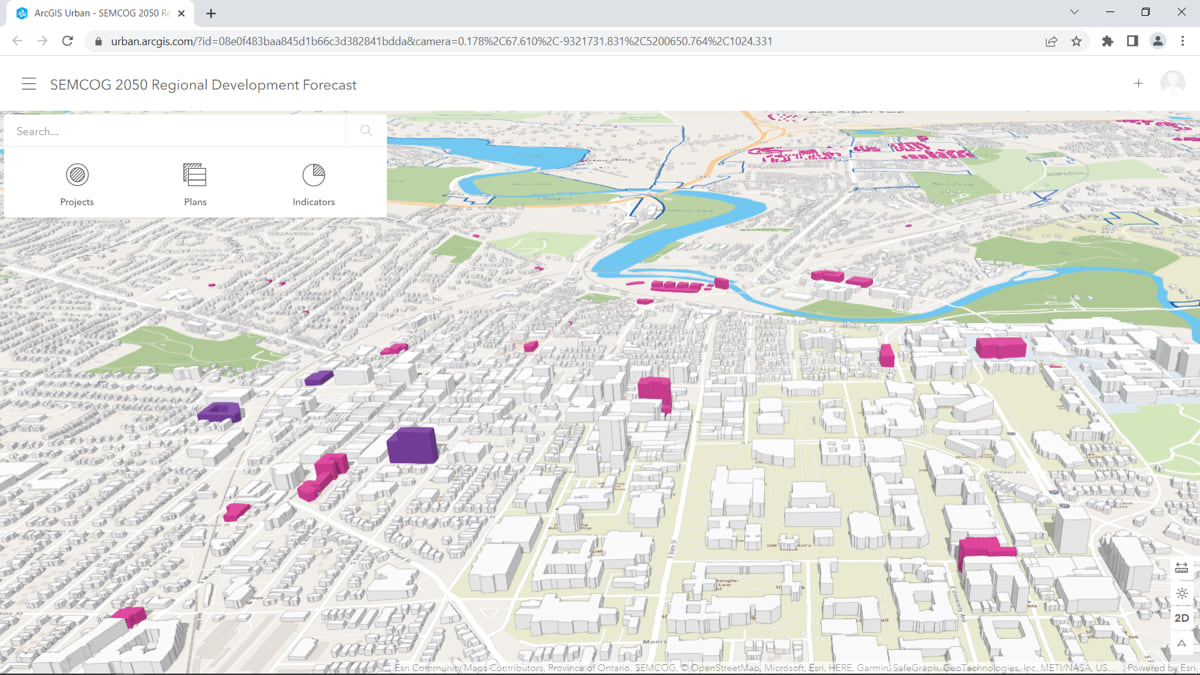
SEMCOG processed 800 development site plans as part of the forecast process creating a digital twin of the region. Rather than points on a map, the new map shows what kind of growth is planned, including the building footprints of all multifamily housing projects or single-family homes, and gives planners an awareness of regional development patterns.
“It’s much easier for communities to double-check what we’ve put together,” Nutting said. “We’re giving them a map of current and future buildings.”
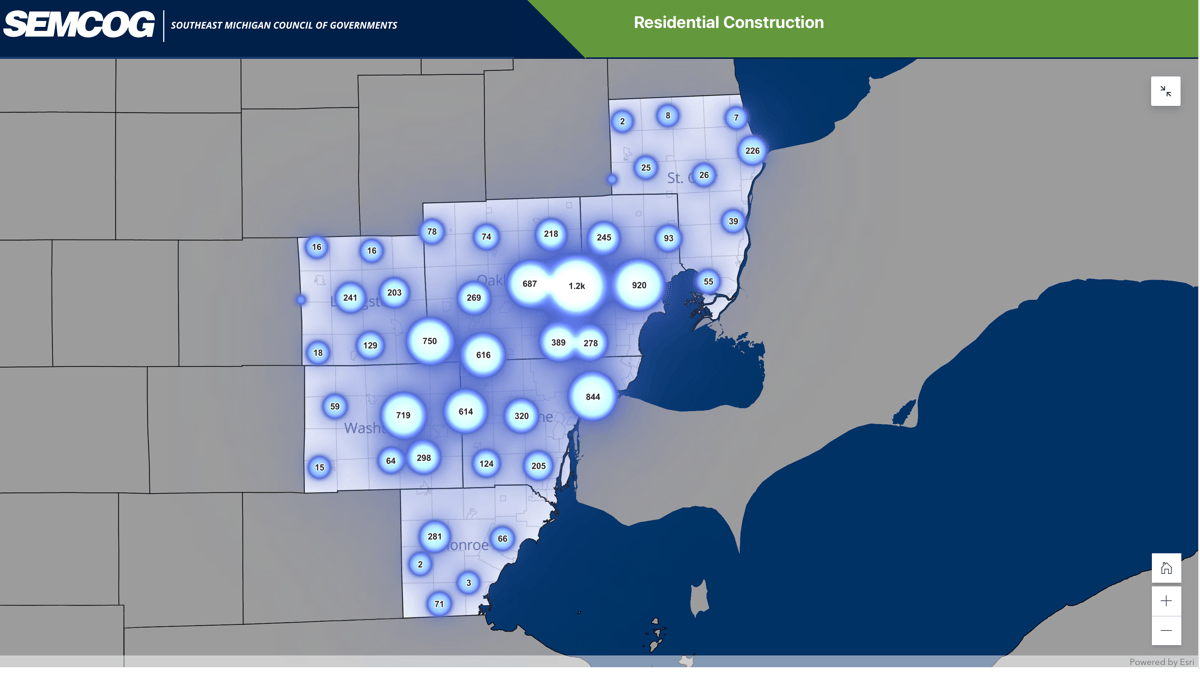
Putting all the data on a map helps SEMCOG see what things look like regionally and triggers questions about where development will go next.
One of the things that the forecasters have seen are fewer planned storefronts and office buildings.
“We’ve had a number of former office towers that have been gutted and turned into housing or offices, or typically both,” Nutting said. “Schools that are 50 to 100 years old are being converted, and there is more multifamily development than in the past.”
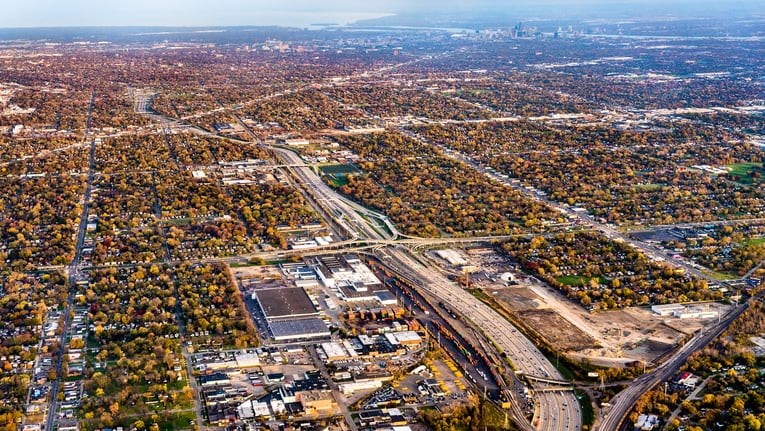
The map also helps anticipate future trends, such as whether development is trending more toward infill lots and smaller projects or whether developers are jumping to the exurbs where they can create whole subdivisions.
The aim of all this information gathering is to project the patterns of growth far into the future for an accurate SEMCOG forecast, and also foster collaboration between planners in neighboring communities.
“Our hope for the forecast is that communities will use it in their own planning work and that they will consider the zoning and master plans of their neighboring communities to make planning more seamless and integrated,” Nutting said.
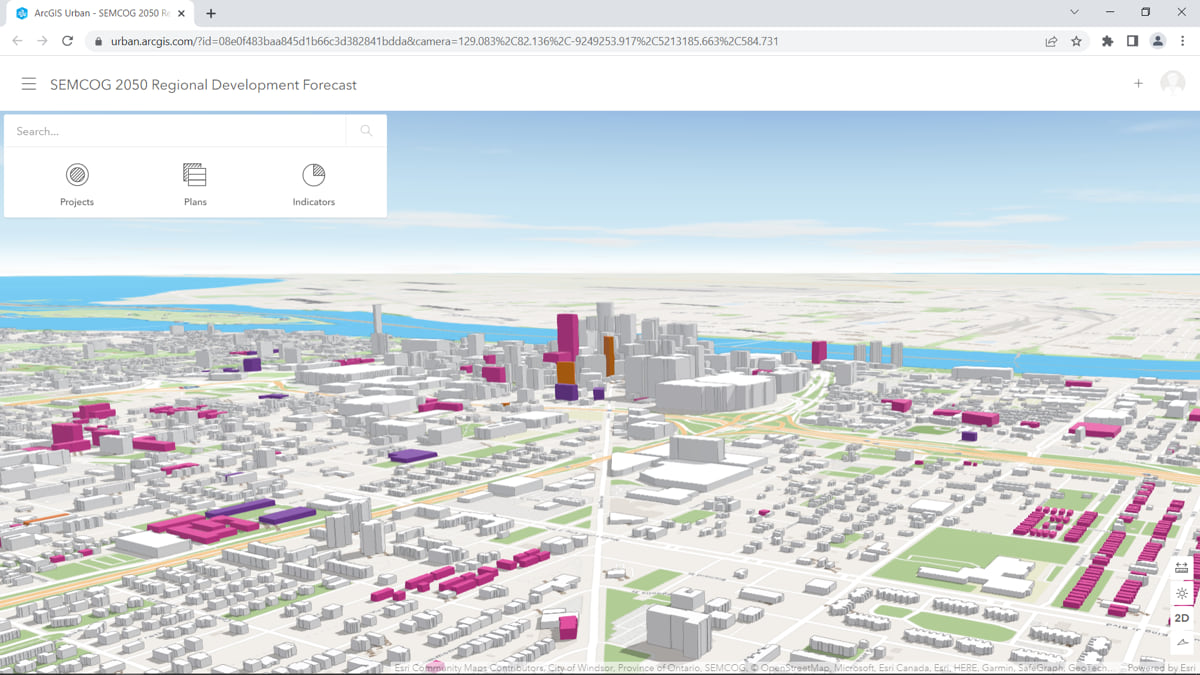
The map of building footprints has color coding for 26 different building types, including four residential and 22 nonresidential types that align to major employment categories in the region.
Many planners who have seen the visual result were quick to ask if they could share it with their planning commissions, township boards, and communities.
Nutting hopes that municipalities will start to require building information models as part of their planning process, as that would make pulling the details together much easier.
“With all the growth that’s happening, our plan is to divide the region into places that we talk to every year, instead of every three to five years,” Nutting said. “That way when we get to this point in five years, the model will largely be in place already.”
The regional plan also serves to show residents that their region is well into its rebound.
“There have been a lot of changes, particularly in the city of Detroit where city leaders have a plan, they’re following it, and it’s working,” Nutting said.
Learn how 3D web-based tools enable the digital transformation of city and regional planning.