

January 7, 2020 |
Greg Milner | Mapping
November 26, 2025
Noise is a silent killer.
We don’t think about it as much more than an irritant, but prolonged exposure to noise hits the body on several fronts. It weakens our hearts. It stresses our brains, affecting memory and emotional regulation. It triggers the release of hormones that impair insulin regulation, contributing to body fat accumulation. New research even links noise exposure to depression and dementia.
Transport noise—cars, buses, trains, planes—is the most common source.
The European Union nations have taken the biggest steps to identify the noise problem. The World Health Organization (WHO) estimates that one in five EU residents—100 million people—are exposed to unhealthy noise levels. In Western Europe alone, WHO estimates that annual traffic noise exposure robs the population of one million healthy years.
Noise also has an economic cost. The European Environment Agency (EEA) puts the annual economic cost from transport noise at $111 billion, around 0.6 percent of Europe’s GDP.

For over 20 years, the European Commission, the EU’s executive arm, has administered the Environmental Noise Directive (END). Among its current goals is a 30 percent decrease by 2030 in the number of people chronically bothered by transport noise.
END emphasizes the need for countries to share noise information with the public. It requires them to create noise maps to illustrate that nation’s noise situation. These maps, created using geographic information system (GIS) technology, serve a dual purpose. They turn an otherwise ephemeral pollution source—something that otherwise seems like a normal part of urban living—into something “real” and quantifiable. The maps also provide a way to track progress.
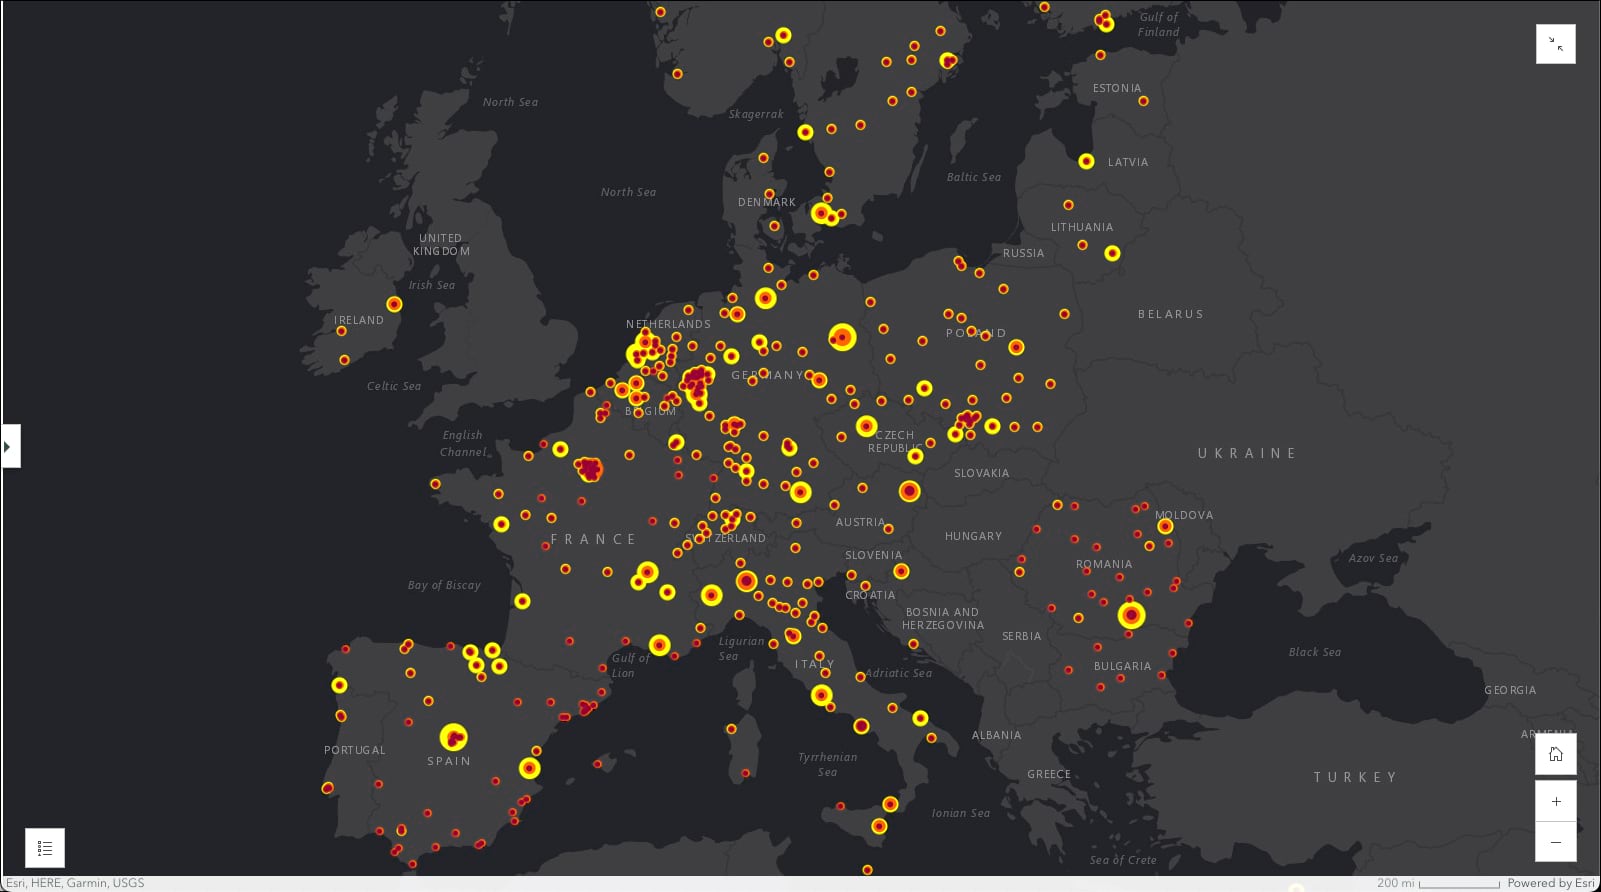
People can learn about noise in the EU through an ArcGIS StoryMaps story, made by the Noise Observation and Information Service for Europe (NOISE), a project of the European Environment Agency. It provides a continent-wide overview of the noise problem, divided into four main components: roads, railways, airports, and industry. Users can also swipe between daytime and evening maps.
As with most documents related to END, the NOISE map assigns a 55 decibel (dB) threshold for daytime and evening noise, and a 50 dB threshold for nighttime noise. The 20 percent of Europeans experiencing chronic transport noise are likely experiencing sound levels of at least 65 dB, the threshold where annoyance kicks in. (The dB scale is logarithmic, so the difference between 55 dB and 65 dB is significant, often perceived as a “doubling” of loudness.)
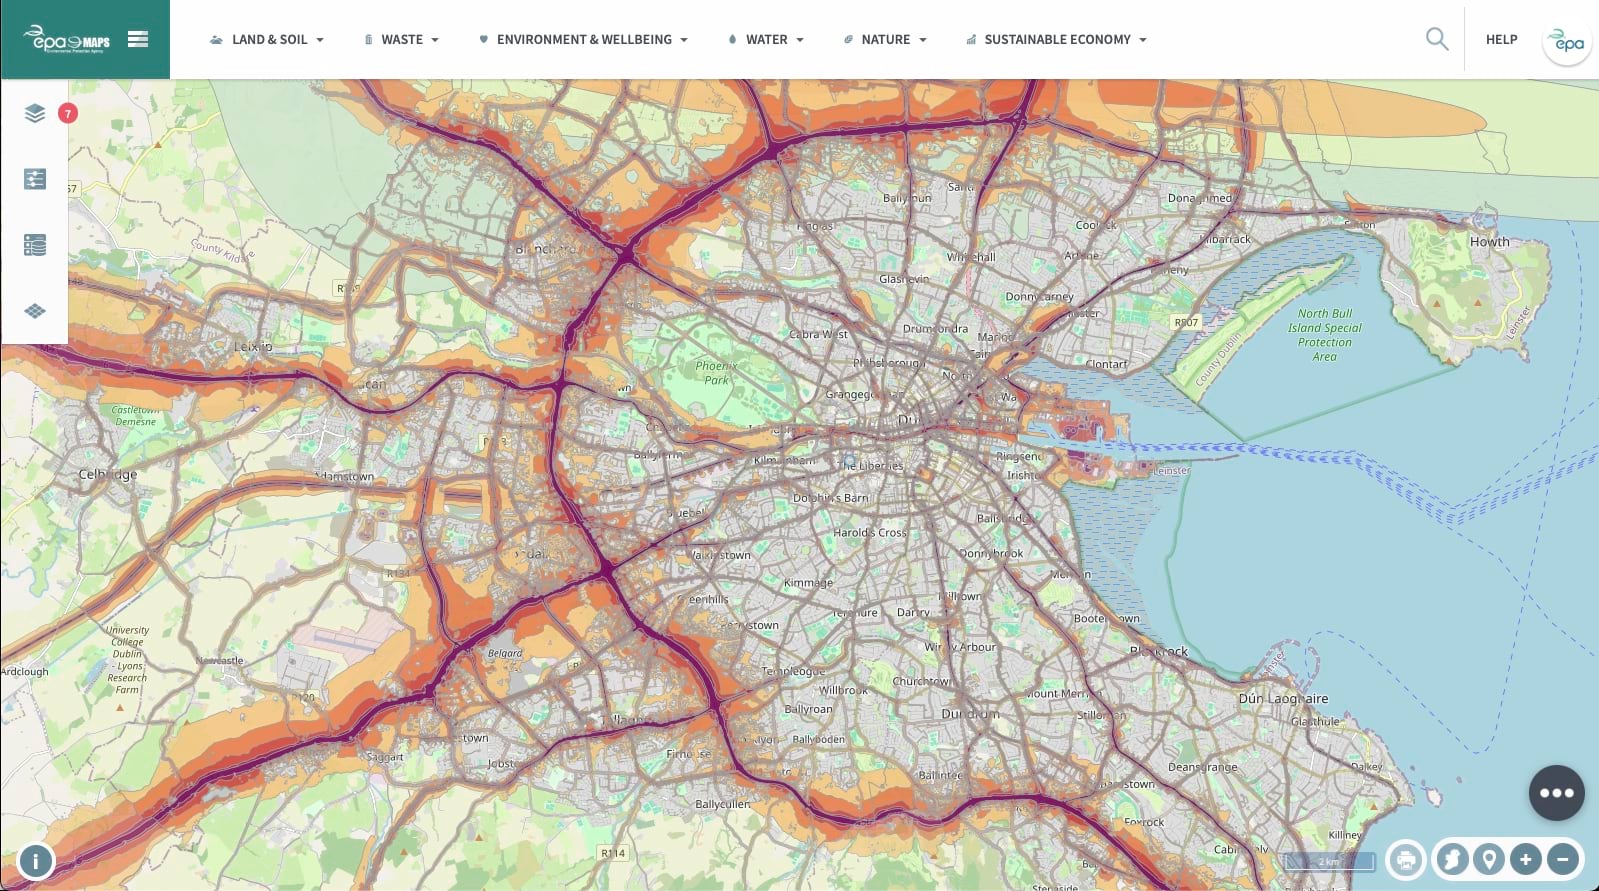
Because END does not offer stringent guidelines for noise maps, nations have taken varied approaches. For accessibility and ease of use, Ireland’s noise maps are especially effective. Of particular interest is a national noise map available at the Irish Environmental Protection Agency’s Geo Portal. (Under the Environment & Wellbeing tab, select Noise.)
Zooming in on Dublin, for instance, it is immediately apparent that although pockets of extreme noise occur at the city center, noise is worse towards the western suburbs. The largest source of noise is the M50 freeway, which encircles the city, and the suburban highways that flow into it.
Switching on the rail layer reveals how much the combination of traffic at the Red Cow Interchange, which includes a major bus and train junction, afflicts working-class neighborhoods in the Clondalkin region. For extended areas, the noise level rises above 75 dB.
Switch on the industry layer, and you’ll discover most of the noise emanates from Dublin Port, with pockets around the city. Zoom in to St. James’s Gate, for example, and you’ll discover one noisy source is the famous Guinness Brewery. For years, locals complained about mysterious “shrill sounds” and a pervasive “hum” that was eventually traced to the brewery.
The map suggests the loudest sounds, marked as over 75 dB, do not quite bleed into the surrounding historic neighborhood, although 65–70 dB noise appears common.
Check the road layer, however, and you’ll discover that nearby multi-lane streets push the noise up over 75 dB. Add the rail network, and you’ll see the same level emanating from the Red Line tram tracks that run past the apartments on Davitt Road.
The inevitable conclusion is that noise in one of Dublin’s most historic areas is nearly impossible to escape.
In France, an innovative project brings real-time updates to noise maps.
EEA data identified Paris as one of the EU’s noisiest cities. Over 400,000 Parisians say they use tranquilizers to deal with environmental noise.
Bruitparif, a French nonprofit, oversees one of the most ambitious attempts to monitor and map that noise in real time. The organization oversees an exhaustive noise map of the Île-de-France region, which covers Paris and its environs, home to over 12 million people. Hundreds of sensors track noise levels, while also highlighting individual noise sources, such as excessively loud cars.
One important conceptual innovation of the Bruitparif map is that it displays information on noise pollution and air pollution, a subtle reminder that the former is as much a public health nuisance as the latter. One of its most dramatic findings is that 80 percent of the residents of Île-de-France experience simultaneous exposure to both types of pollution.
Teams within the organization hope the maps will influence public policy. They are using GIS to cross-reference noise and air pollution with other socioeconomic data, creating a clear picture of which communities live with noise and which are spared its excesses.
Noise maps can do more than illustrate noise as it happens. 3D models and digital twins, built with GIS, provide a way to understand the propagation of noise. They show in detail how proposed changes to the environment, such as new buildings, roads, or other infrastructure, will generate noise.
In the Netherlands, the Delft University of Technology maintains a 3D digital twin of every building in the nation. Researchers developed it for use in assessing the effect of planning and development projects. One primary application is noise simulation, using a dataset built in collaboration with the Netherlands’ Cadastre, Land Registry and Mapping Agency and the National Institute for Public Health and the Environment.
Elsewhere in the Netherlands, researchers at the Eindhoven University of Technology are working on models that fine-tune the ability to measure and predict noise in an urban environment. Their work involves modeling and mapping noise behavior in “city canyons” created by apartment buildings, which scatter sound erratically, as well as enclosed yards and side streets.
Noise reduction efforts sometimes face resistance, often from airports. Frankfurt Airport in Germany, one of Europe’s biggest hubs, is located next to densely populated residential areas.
The airport authority’s reluctance to limit night flights or adjust flight paths led to several legal challenges. After much negotiation, the airport agreed to make significant changes, including adding noise insulation near runways.
The city of Berlin maintains noise maps as part of its Environmental Atlas. When Germany built its first END noise maps in 2007, Berlin was revealed to be especially noisy. For a half-million people, nighttime traffic created noise levels of at least 50 dB.
The city used that info to make large-scale changes. City streets with two lanes in each direction and less than 20,000 vehicles per day became single-lane roads with cycling lanes and pedestrian islands. Other roads concentrated traffic in the middle of the roadway, particularly in residential areas.
Berlin’s approach reveals how noise solutions have positive effects that extend beyond just making things quieter. Fewer motorized vehicles mean less air pollution and reduced amounts of greenhouse gas emissions.
The upshot is that just as sound cannot travel in a vacuum, sound pollution is always intertwined with other types or pollution. The way to begin to understand these relationships is to create a map—a living document that monitors noise, reveals the dangers it poses to people and the environment, and sets a foundation for a quieter future.
Learn more about how GIS is used in Europe to deliver quality-of-life improvements and create a stronger more digitally connected Europe.