
If there’s any cause in my life, it’s trying to make the wonderful data that the GIS community produces more accessible to more people.
Allen Carroll
Program Manager for Storytelling at Esri
August 12, 2025
In an era where data overwhelms and attention spans shrink, Allen Carroll believes maps have the power to captivate us. And he’s spent his career proving it.
Carroll’s new book, Telling Stories with Maps: Lessons from a Lifetime of Creating Place-Based Narratives, chronicles a remarkable journey from National Geographic’s analog map production team to Esri’s digital frontiers, where he founded the StoryMaps team.
Carroll didn’t set out to revolutionize storytelling. As a child, he simply loved maps. Growing up in Indianapolis, he’d often navigate his family on their road trips. He eventually grew into a career that has democratized geographic storytelling in ways he never imagined—enabling millions to tell place-based stories. Today, high school students use StoryMaps to document environmental justice in their neighborhoods. Conservation teams use them to showcase indigenous knowledge. Thousands of organizations and individuals make them every day to share information in compelling ways.
The secret to successful storytelling, Carroll says, comes from bridging the two sides of the brain. Maps can be dense with information yet combined with images, video, and other multimedia content that delivers emotional impact.
Now, as Carroll prepares for retirement, his book serves as both memoir and manual, detailing how digital tools are expanding the ancient impulse to make sense of our world through maps.
This interview has been edited and condensed.
Q: At National Geographic, you were creating maps to support stories. At Esri, you’re empowering others to tell stories with maps. How did that shift from “informing” to “empowering” change your perspective?
A: At National Geographic, I was incredibly lucky to reach large audiences through that amazing brand—informing people about the world through supplement maps, magazine spreads, and atlases. At Esri, my work has primarily had to do with enabling people, which has been even more rewarding in terms of magnifying impact.
When you provide tools that hundreds of thousands of people can use to tell their own stories, you’re not just reaching an audience—you’re empowering storytellers. That’s what Jack and Laura Dangermond realized fifty years ago when they started Esri: instead of just doing service work, developing software that enables others to do their own work is incredibly powerful. ArcGIS StoryMaps has done exactly that but in a storytelling context. Almost every day I encounter a story produced by an organization or individual that’s really beautiful, important, and valuable.
If there’s any cause in my life, it’s trying to make the wonderful data that the GIS community produces more accessible to more people.
Q: You’ve said maps “tickle both sides of the brain.” How does this dual nature make them uniquely powerful for storytelling?
A: Maps are frequently aesthetically pleasing. The patterns and colors are appealing and provocative. But they’re also incredibly dense with information in terms of data visualization. That’s what makes maps unique as a storytelling medium.
Maps themselves tell stories, but they tell even more interesting and immersive stories when combined with other multimedia content. Maps can provide that depth of information, while photos and videos can provide the emotional impact. I love maps and they are beautiful, but they’re generally a quiet medium. They don’t usually make us cry—unless it’s a really bad map.
The magic happens when you can use choreography to integrate maps into a narrative where the maps change and move to expose different layers as part of a sequence. The map becomes not just a static representation but a central character, sharing the stage with other content.
Q: StoryMaps has seen explosive growth in education. What does this tell us about how we learn about place and community?
A: I’ll sheepishly admit we didn’t really think much about education when we developed StoryMaps, but they have really taken off in that community and it’s utterly thrilling. Yes, they’re used for instruction, but the true value is when teachers and professors challenge students to create their own stories.
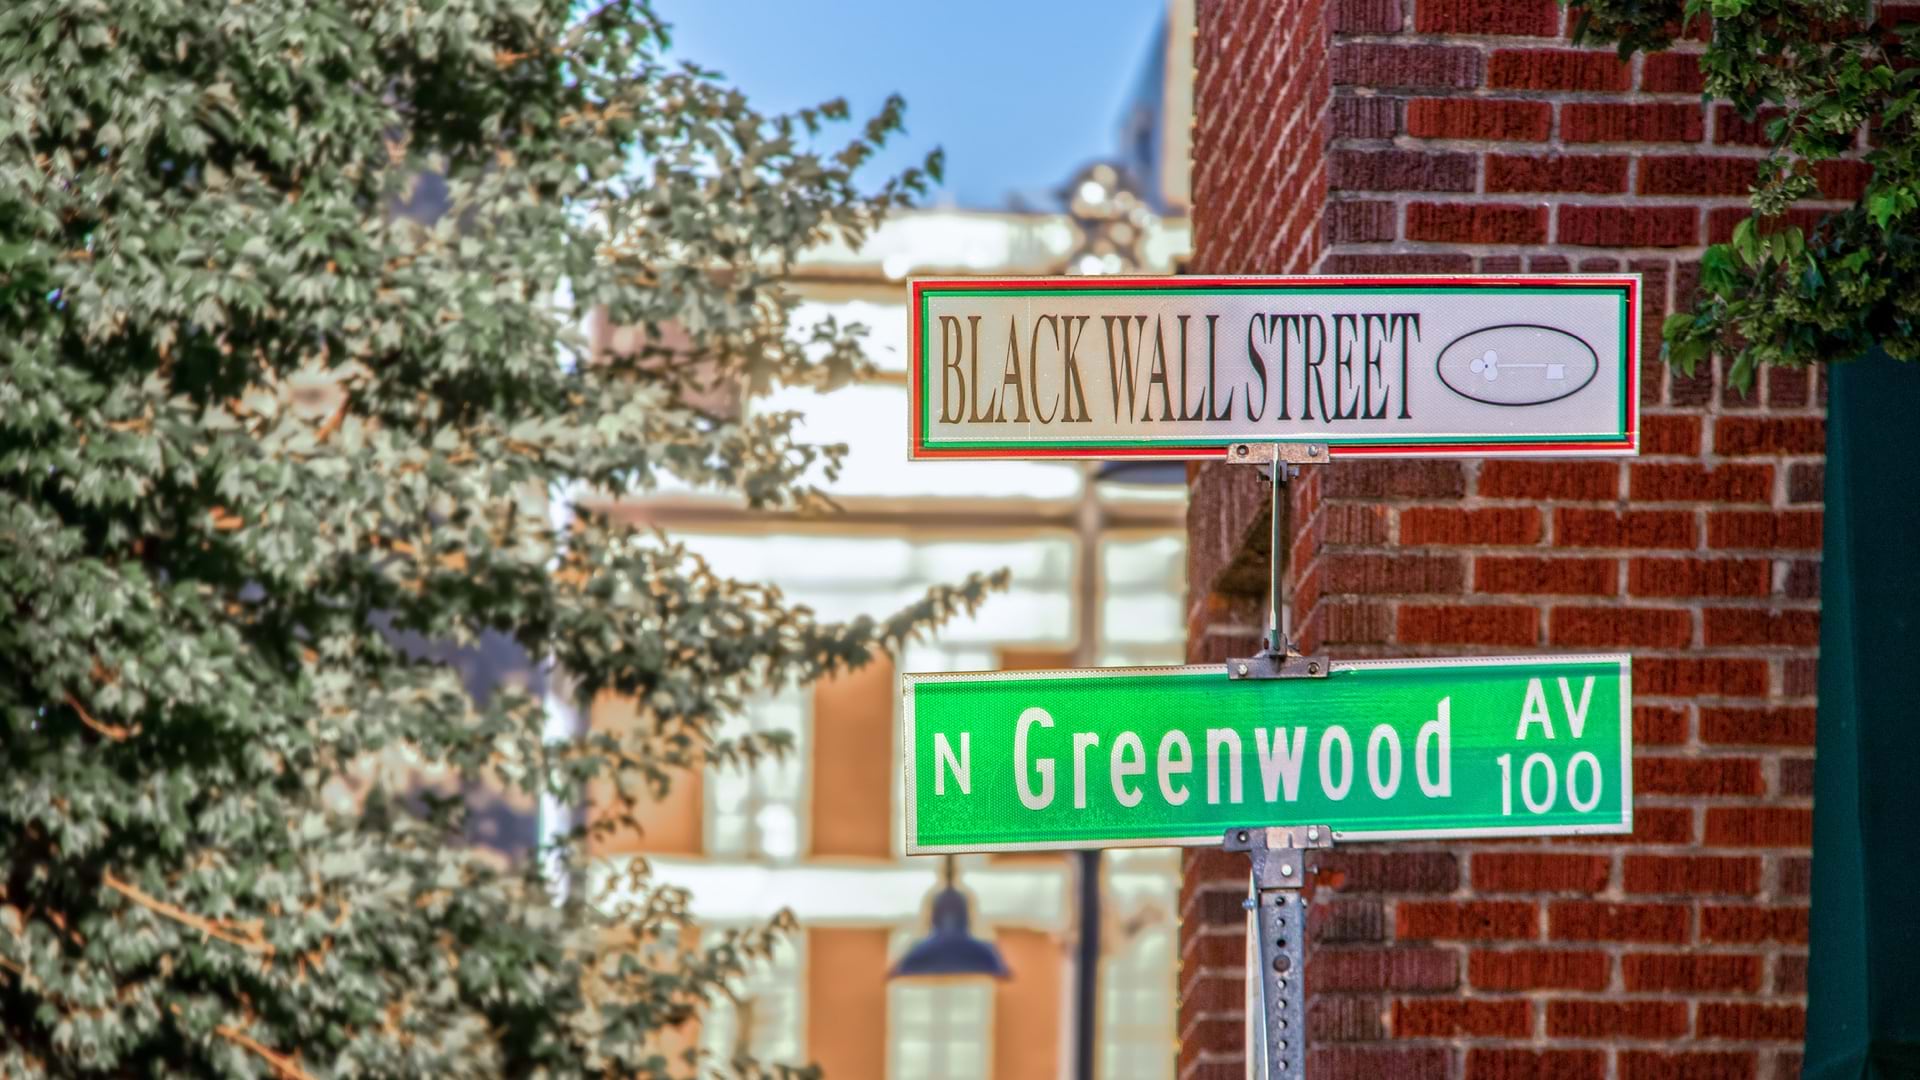
What I love seeing is students like those at Roosevelt High School creating environmental justice stories about their own communities—examining what they see in their lived experience that shows up on the map. It opens kids’ eyes to what’s going on in their communities and to feel that they might be able to do something about it using tools to help them have an impact.
I suspect there’s a substantial number of people who’ve discovered geographic information system (GIS) technology as a result of producing a story and said, “This is really cool stuff. I want to do more with it.” Students are discovering geography and GIS through StoryMaps and going on to deeper engagement with these fields.
Q: Your “Human Footprint” StoryMaps series showcases humanity’s impact on the planet through the Anthropocene lens. How do projects like this demonstrate the broader potential of map-based storytelling?
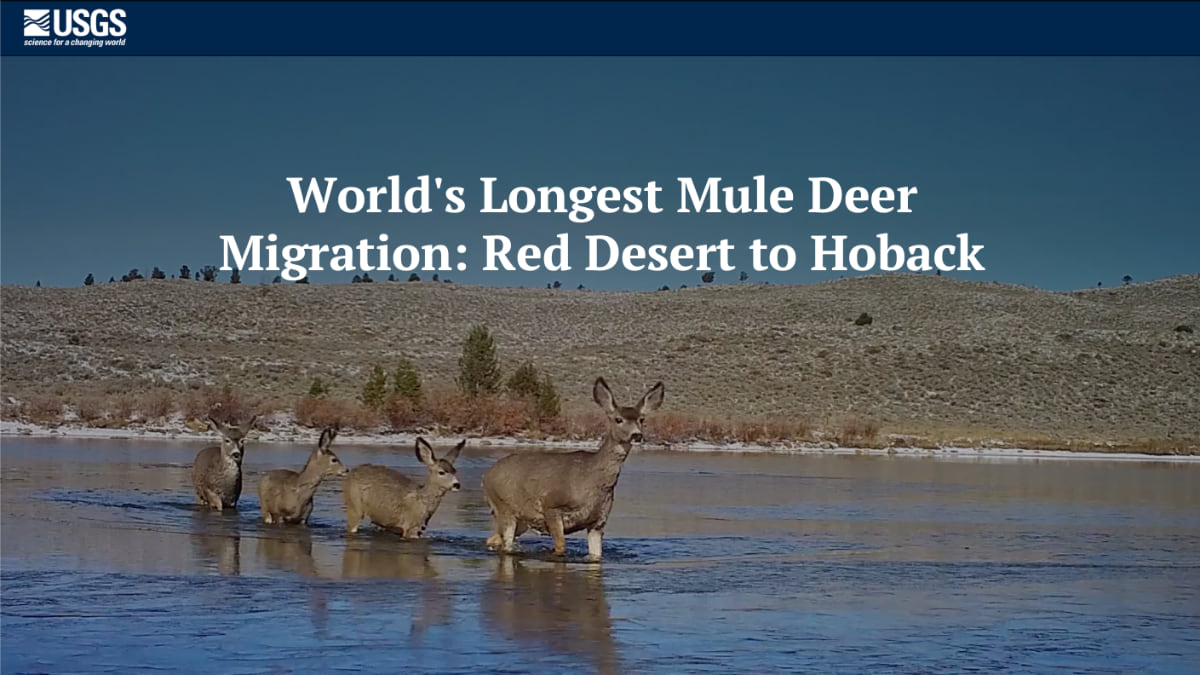
A: The Human Footprint stories are an expression of my long-term desire to help liberate data that’s been captive within organizations—making it serve a broader purpose and benefit more people. We’ve created stories on oceans, land use, forests, and human impacts, and they’ve become perennial occupiers of our top tier in terms of views, finding audiences especially in education.
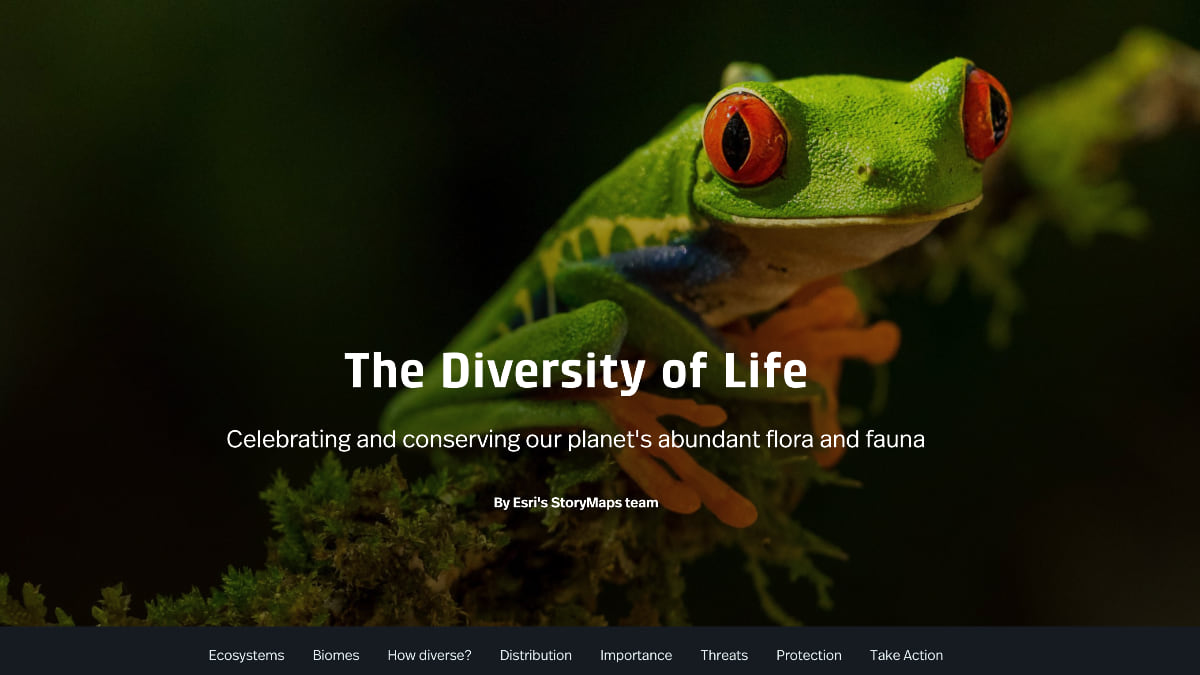
These stories don’t just throw a map out there and say, “hey world, this is great.” They interpret the data, tell the story of the data. For instance, showing how the world is divided into 900-odd ecoregions that represent incredibly rich, diverse habitats—and explaining why that’s important to know for conservation and protection efforts.
If there’s any cause in my life, it’s trying to make the wonderful data that the GIS community produces more accessible to more people. The ongoing tragedy is that biodiversity loss and environmental degradation aren’t more present in the public mind. Map-based stories can help bridge the gap between complex scientific data and public understanding, turning information into narratives that move people to action.
Q: Looking at the broader impact of StoryMaps, how has it changed the role of GIS in organizations and society?
A: Traditional GIS was this little priesthood of people largely working quietly in the back office, serving others within their organizations but in a very limited sense. Now GIS has burst out of that back office and is useful across every part of an organization. We saw early signs of this when organizations would bring both their GIS people and their communications people to meetings about StoryMaps. I knew we were probably bound for success when both groups were at the table.
ArcGIS StoryMaps was only part of this transformation, but it’s helped GIS become broadly useful across organizations along with Dashboards, ArcGIS Survey123, and other tools.
StoryMaps represents the democratization of geographic storytelling. We’re all storytellers now, and we all have place-based stories to tell. People now understand that their local knowledge, their community observations, their professional data—all of it can become compelling narratives that inform and inspire others. That’s the real revolution: not just making better maps but making everyone a mapmaker and storyteller.
Q: You mention that your career “involved very few actual decisions.” How did following opportunities rather than a rigid plan shape your success?
A: Most of my major opportunities just kind of happened. I got the chance to edit my alumni magazine, worked to get my foot in the door at the Washington Post, but really the only big decision was moving from rural Connecticut to Washington, D.C. I was a lonely single guy who needed to get to a place where I could meet people. Personal motivations often align with professional ones in unexpected ways.
I did have to choose between writing and illustration at one point. I realized writing and editing was agonizingly hard work, while design and illustration had a higher fun component, and I had a hunch those skills were more marketable. That decision led me toward National Geographic and eventually to Esri. Sometimes following your inclinations rather than overthinking career strategy opens doors you never knew existed.
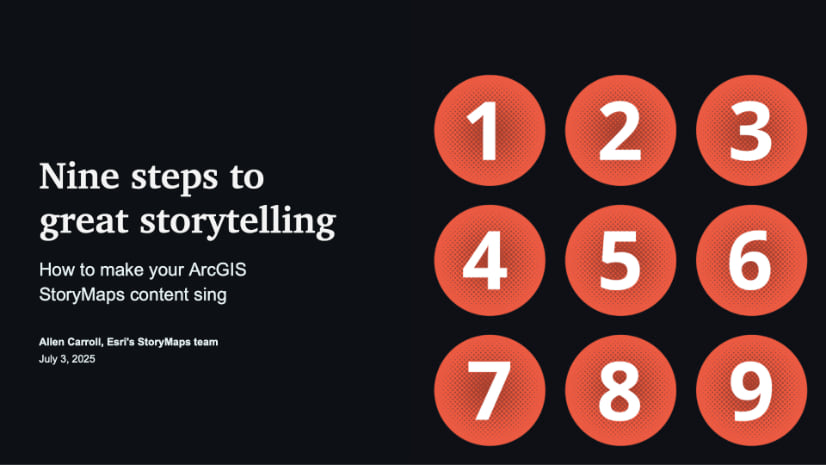
Learn more about how ArcGIS StoryMaps transform digital storytelling with maps. See Allen’s new book, Telling Stories with Maps and visit the companion site that features every multimedia story described in the book.