April 22, 2025 |
Christian Carlson | Infrastructure
Chattanooga is using AI to fight urban heat. By mapping 5.3 million trees and creating a heat risk index, the city is deploying $6 million to plant 5,000 trees where they matter most.
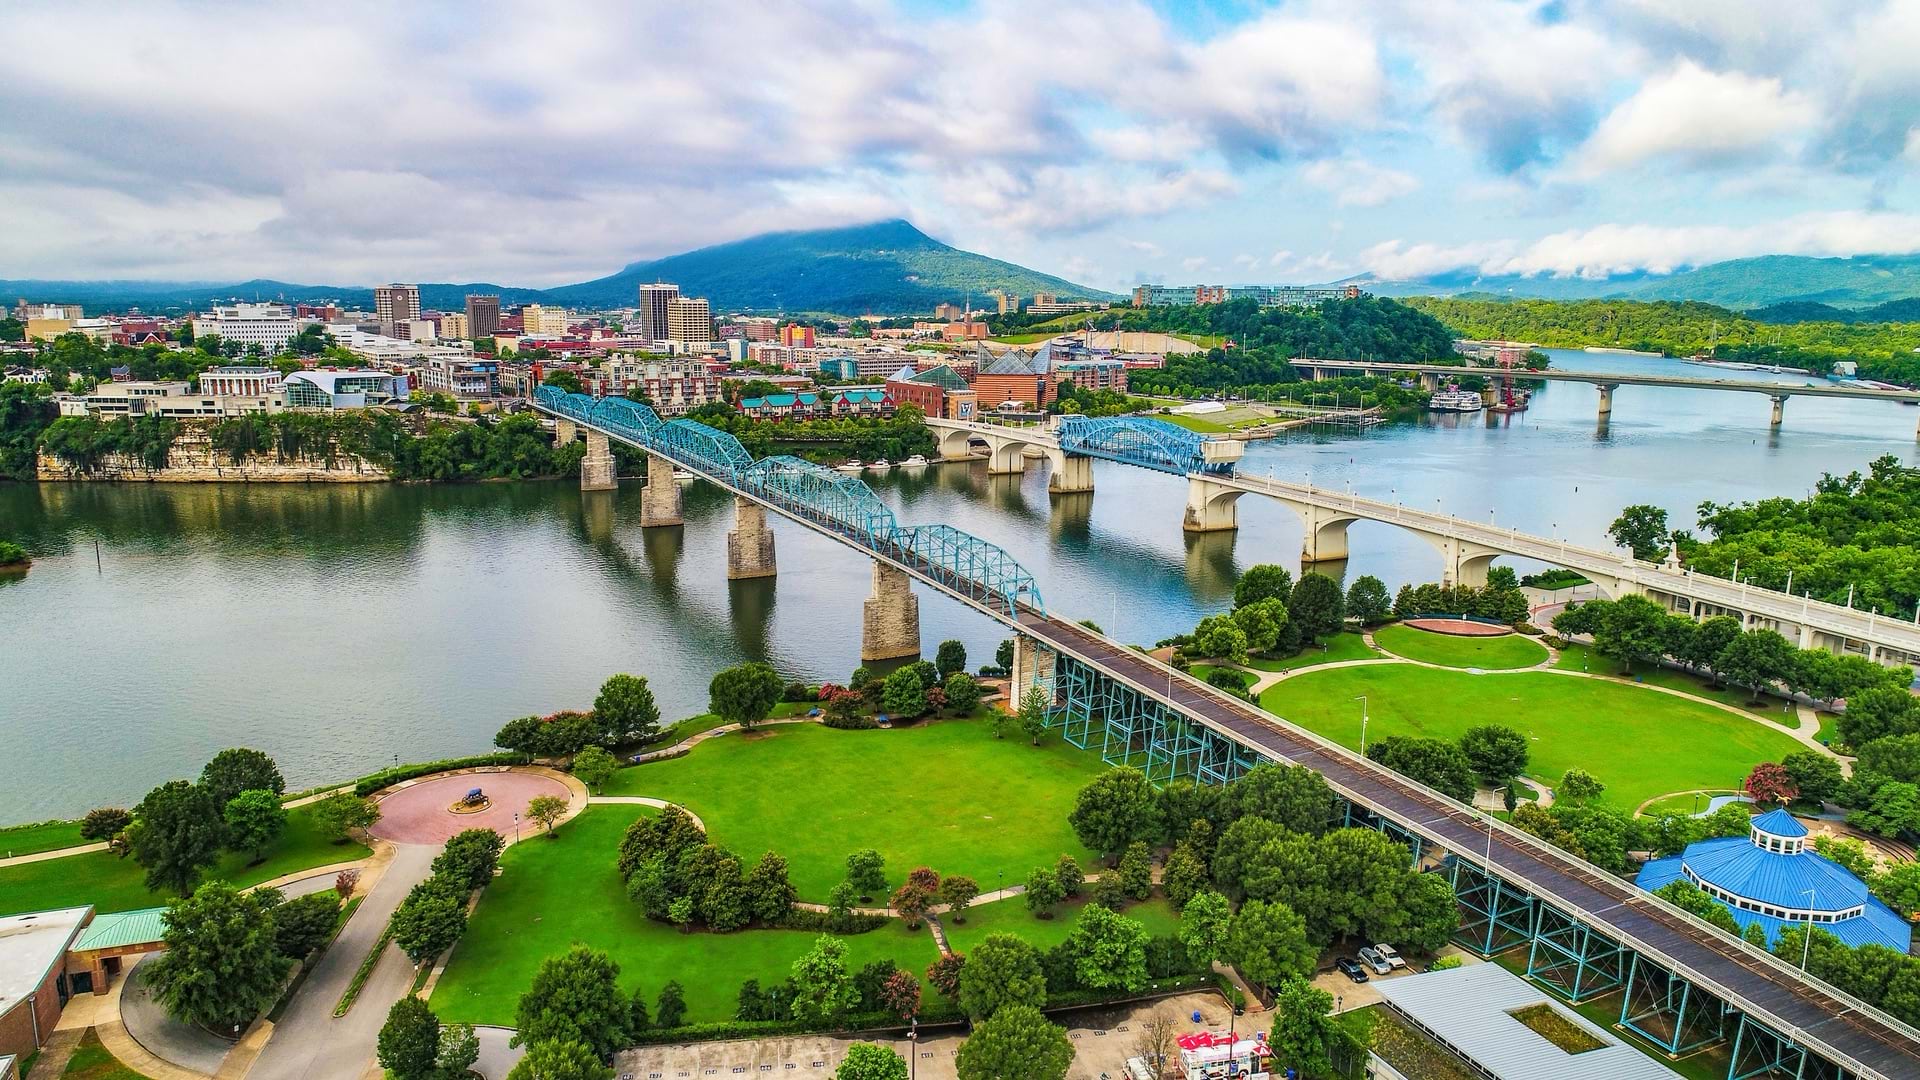
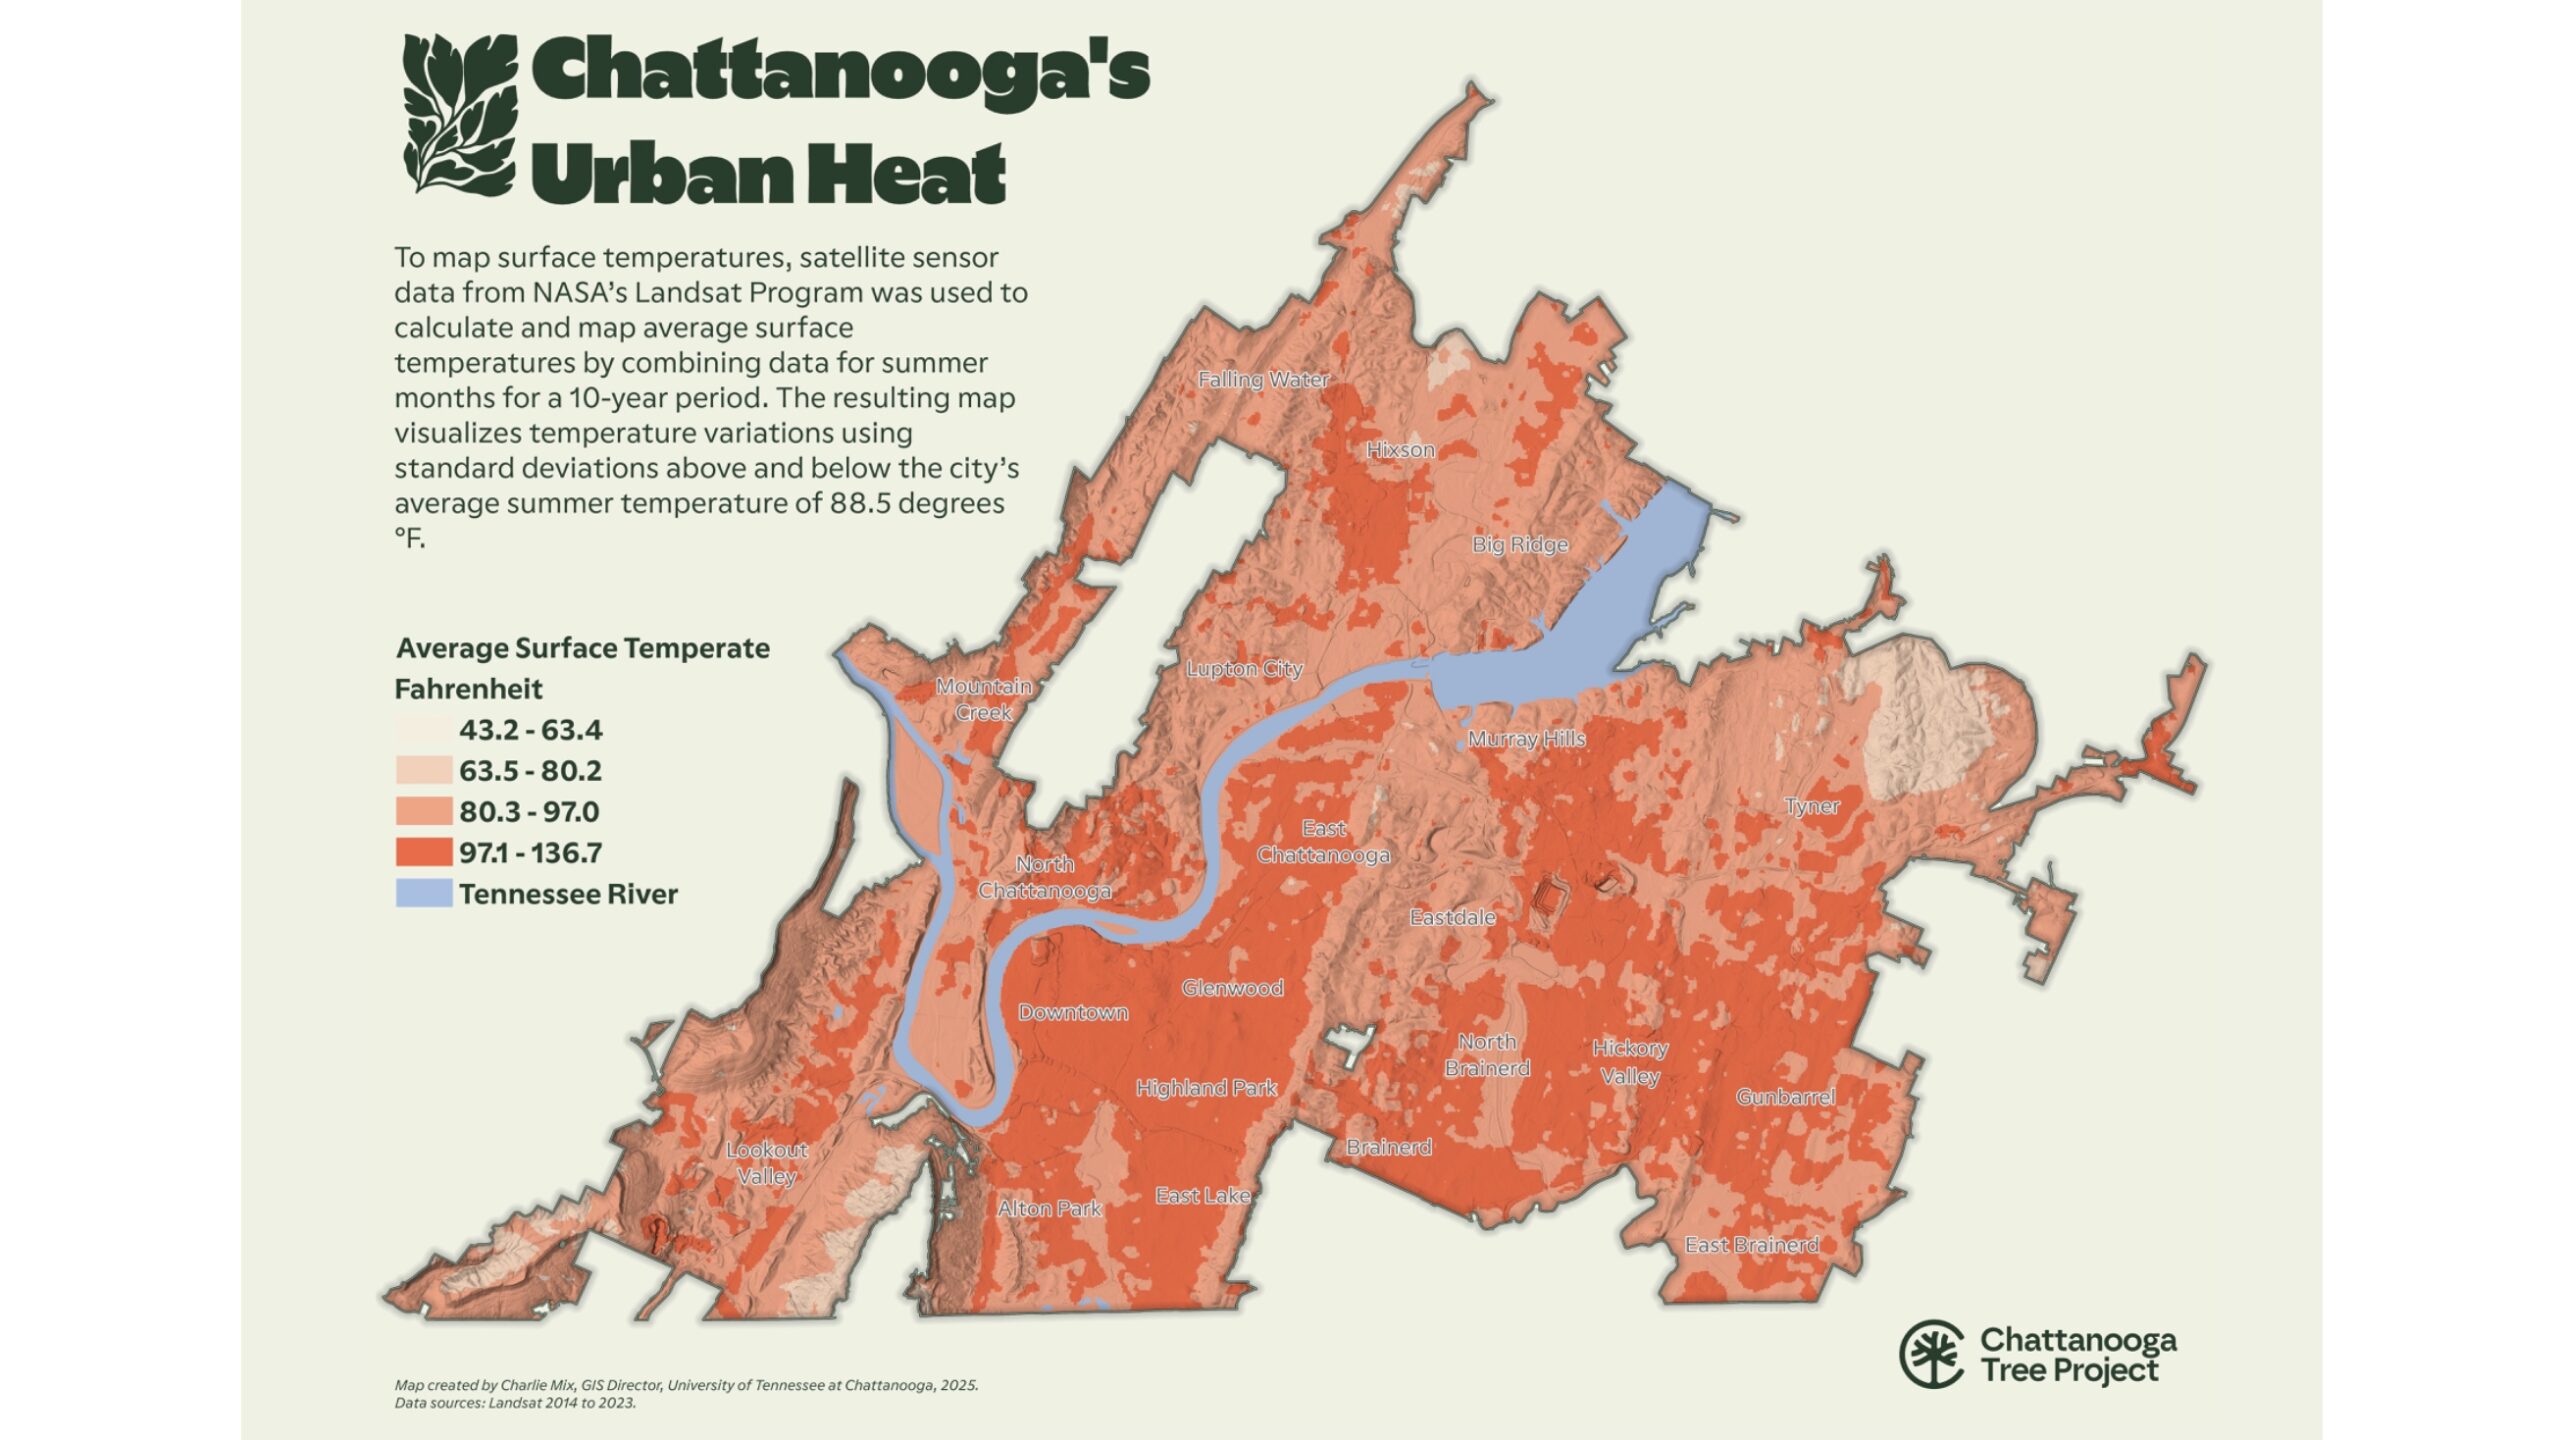
Downtown Chattanooga hits 112 degrees Fahrenheit on summer afternoons. Three miles away in the Moccasin Bend neighborhood, temperatures drop to 90 degrees. That 22-degree gap highlights the role of trees as nature’s air conditioning. Tree shade blocks direct sunlight, leaves release water vapor, and tree canopies channel a breeze.
“Chattanooga sits in the big bowl of the Tennessee River Valley—heat and moisture come up from the Gulf and get trapped here,” said Charlie Mix, director of the Center for Applied Geospatial Data Science at the University of Tennessee at Chattanooga. “It gets even hotter downtown where there’s a lack of tree canopy. If you have a neighborhood with shade, your cooling costs are going to be cheaper. There’s a real economic benefit, not just an ecological one.”
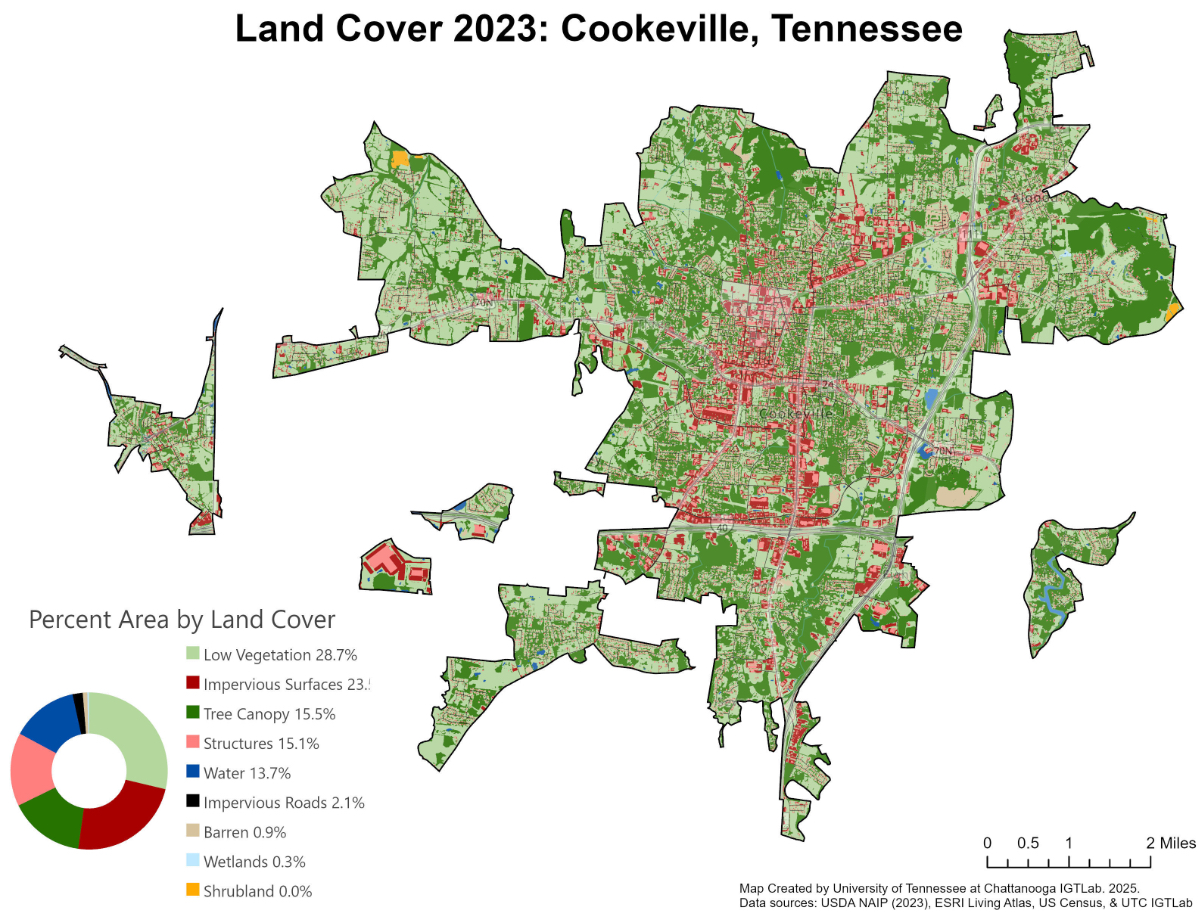
Fewer trees mean higher risk to elderly residents in homes without air conditioning, children in concrete schoolyards, and families without transportation to reach cooler areas. To address that risk, Mix and his team set out to map every tree in the city using aerial imagery, artificial intelligence (AI), and geographic information system (GIS) technology.
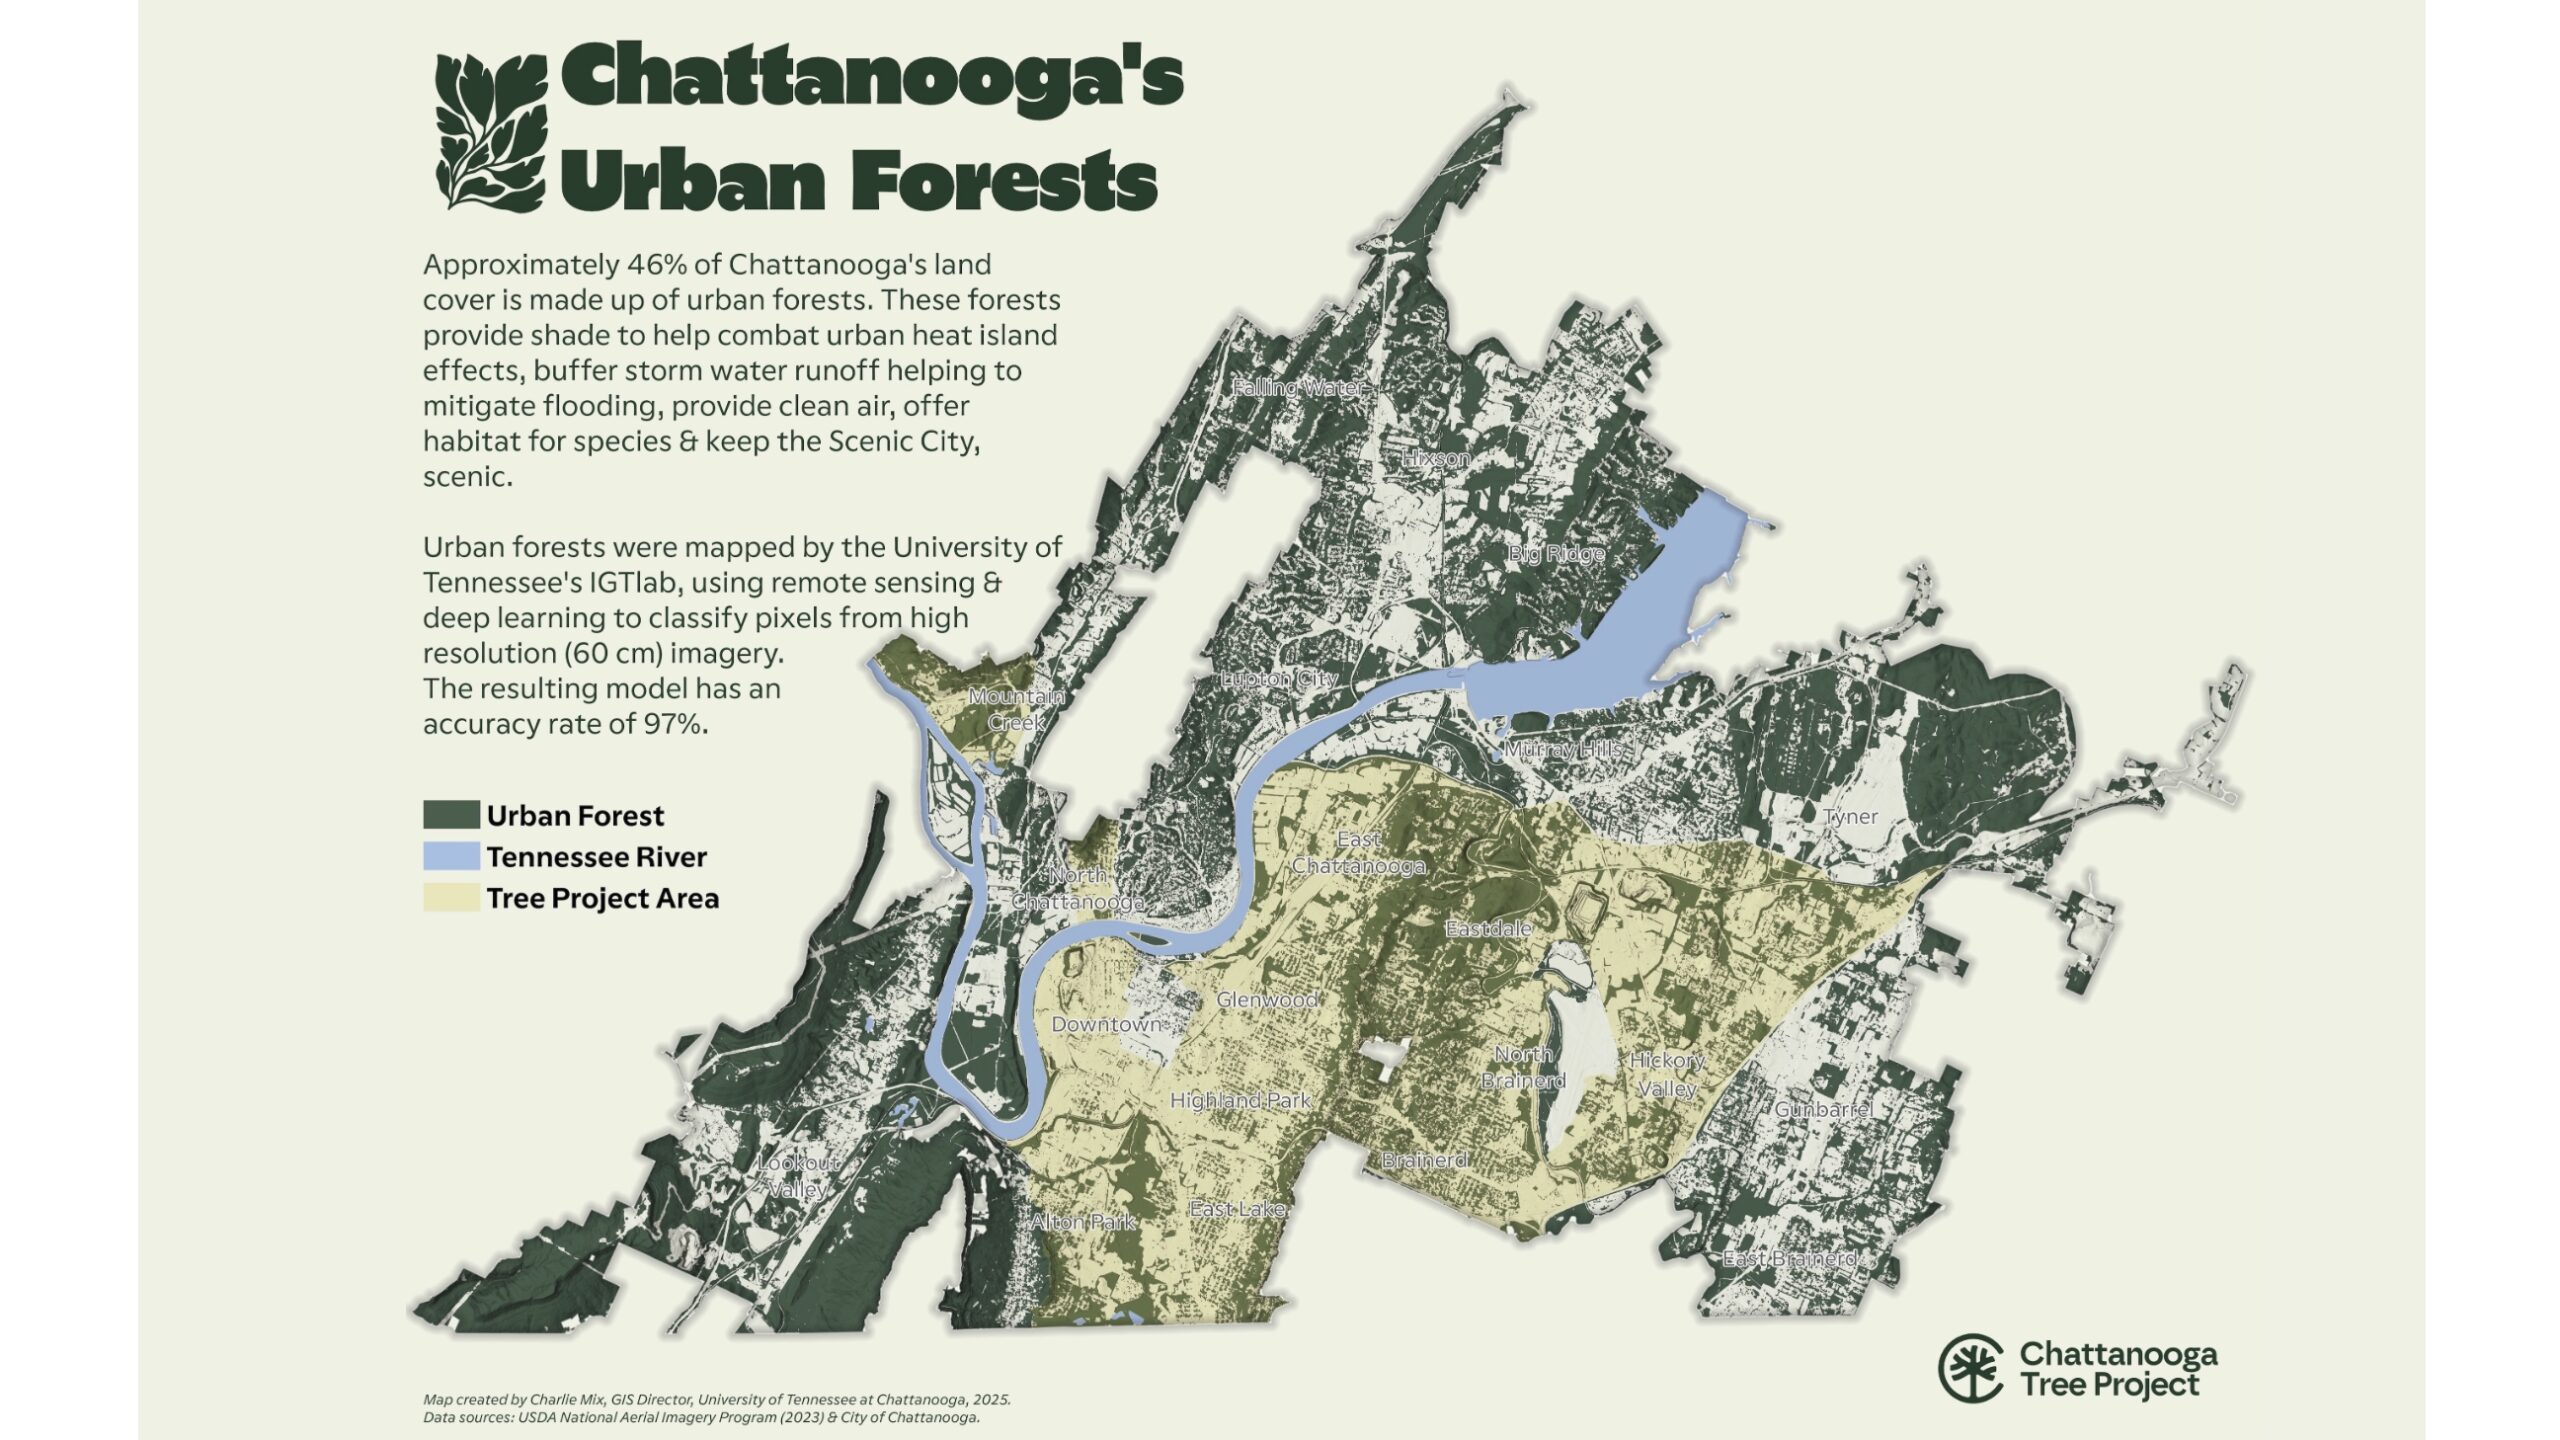
Sending arborists to walk every street and count every tree would have taken years and cost hundreds of thousands of dollars. Mix had a faster approach: teach a computer to see trees. Working with aerial imagery from the US Department of Agriculture (USDA), Mix trained a deep learning model to distinguish tree canopy from rooftops, pavement, and grass.
When the model analyzes an aerial image, it traces every tree crown with precision. The model counted 5.3 million trees across Chattanooga with 97 percent accuracy.
Mix ran the model on aerial imagery from 2014. Comparing historical count to 2023 analysis showed Chattanooga had lost 2,837 acres of canopy—3 percent in nine years. Since 1984, the city had lost 48 percent of its forest cover.
The data showed not just a current state, but a trajectory. The hottest neighborhoods would only get hotter.
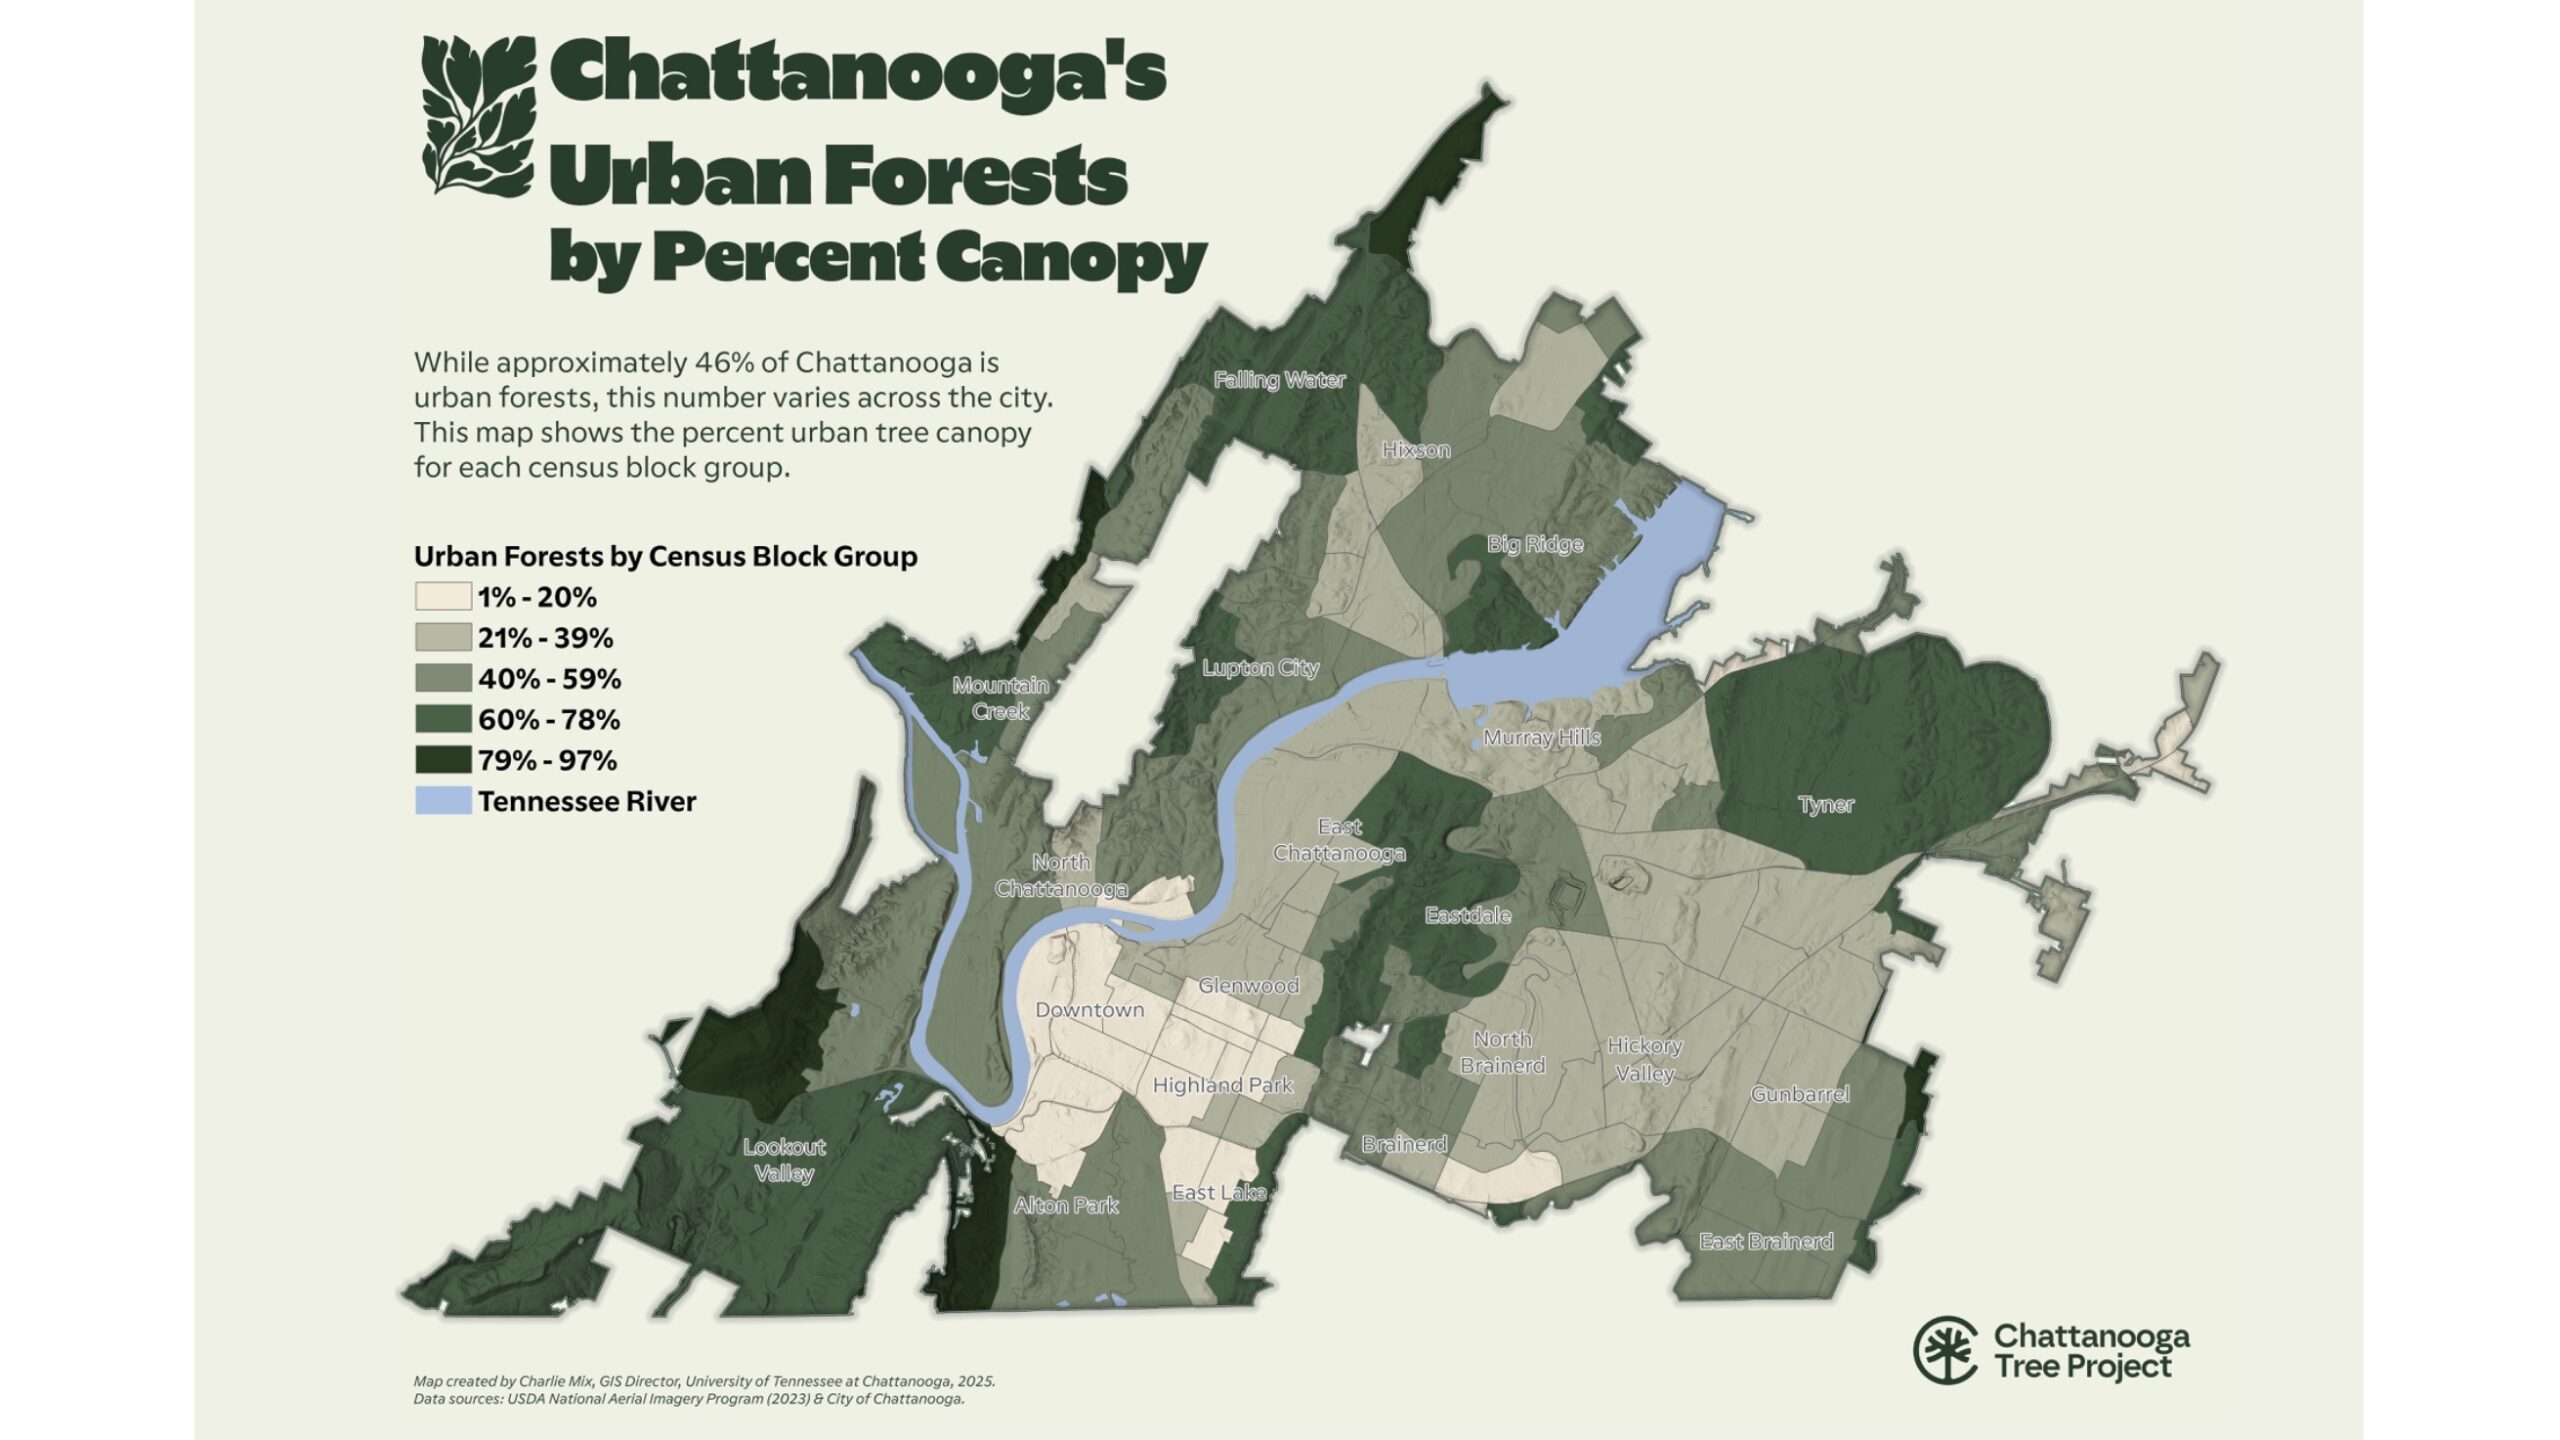
“This really makes a case for preserving our canopy,” Mix said. In cities where tree loss continues unchecked, canopy eventually correlates with wealth—rich neighborhoods keep their shade, poor neighborhoods lose it.
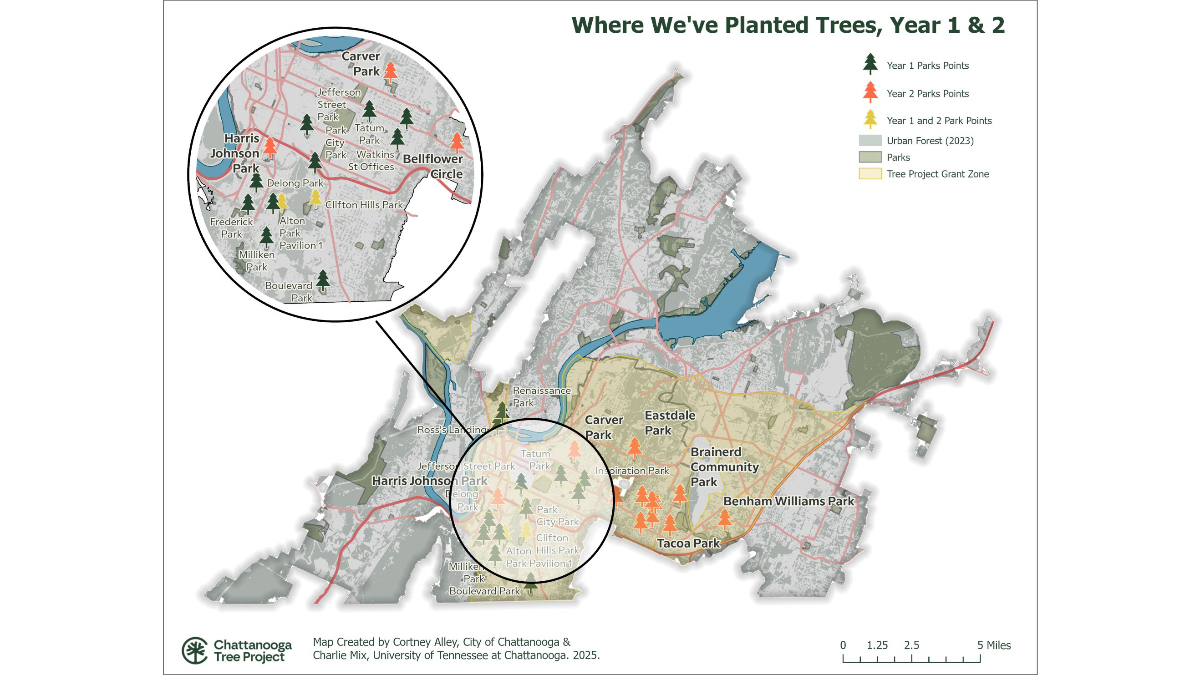
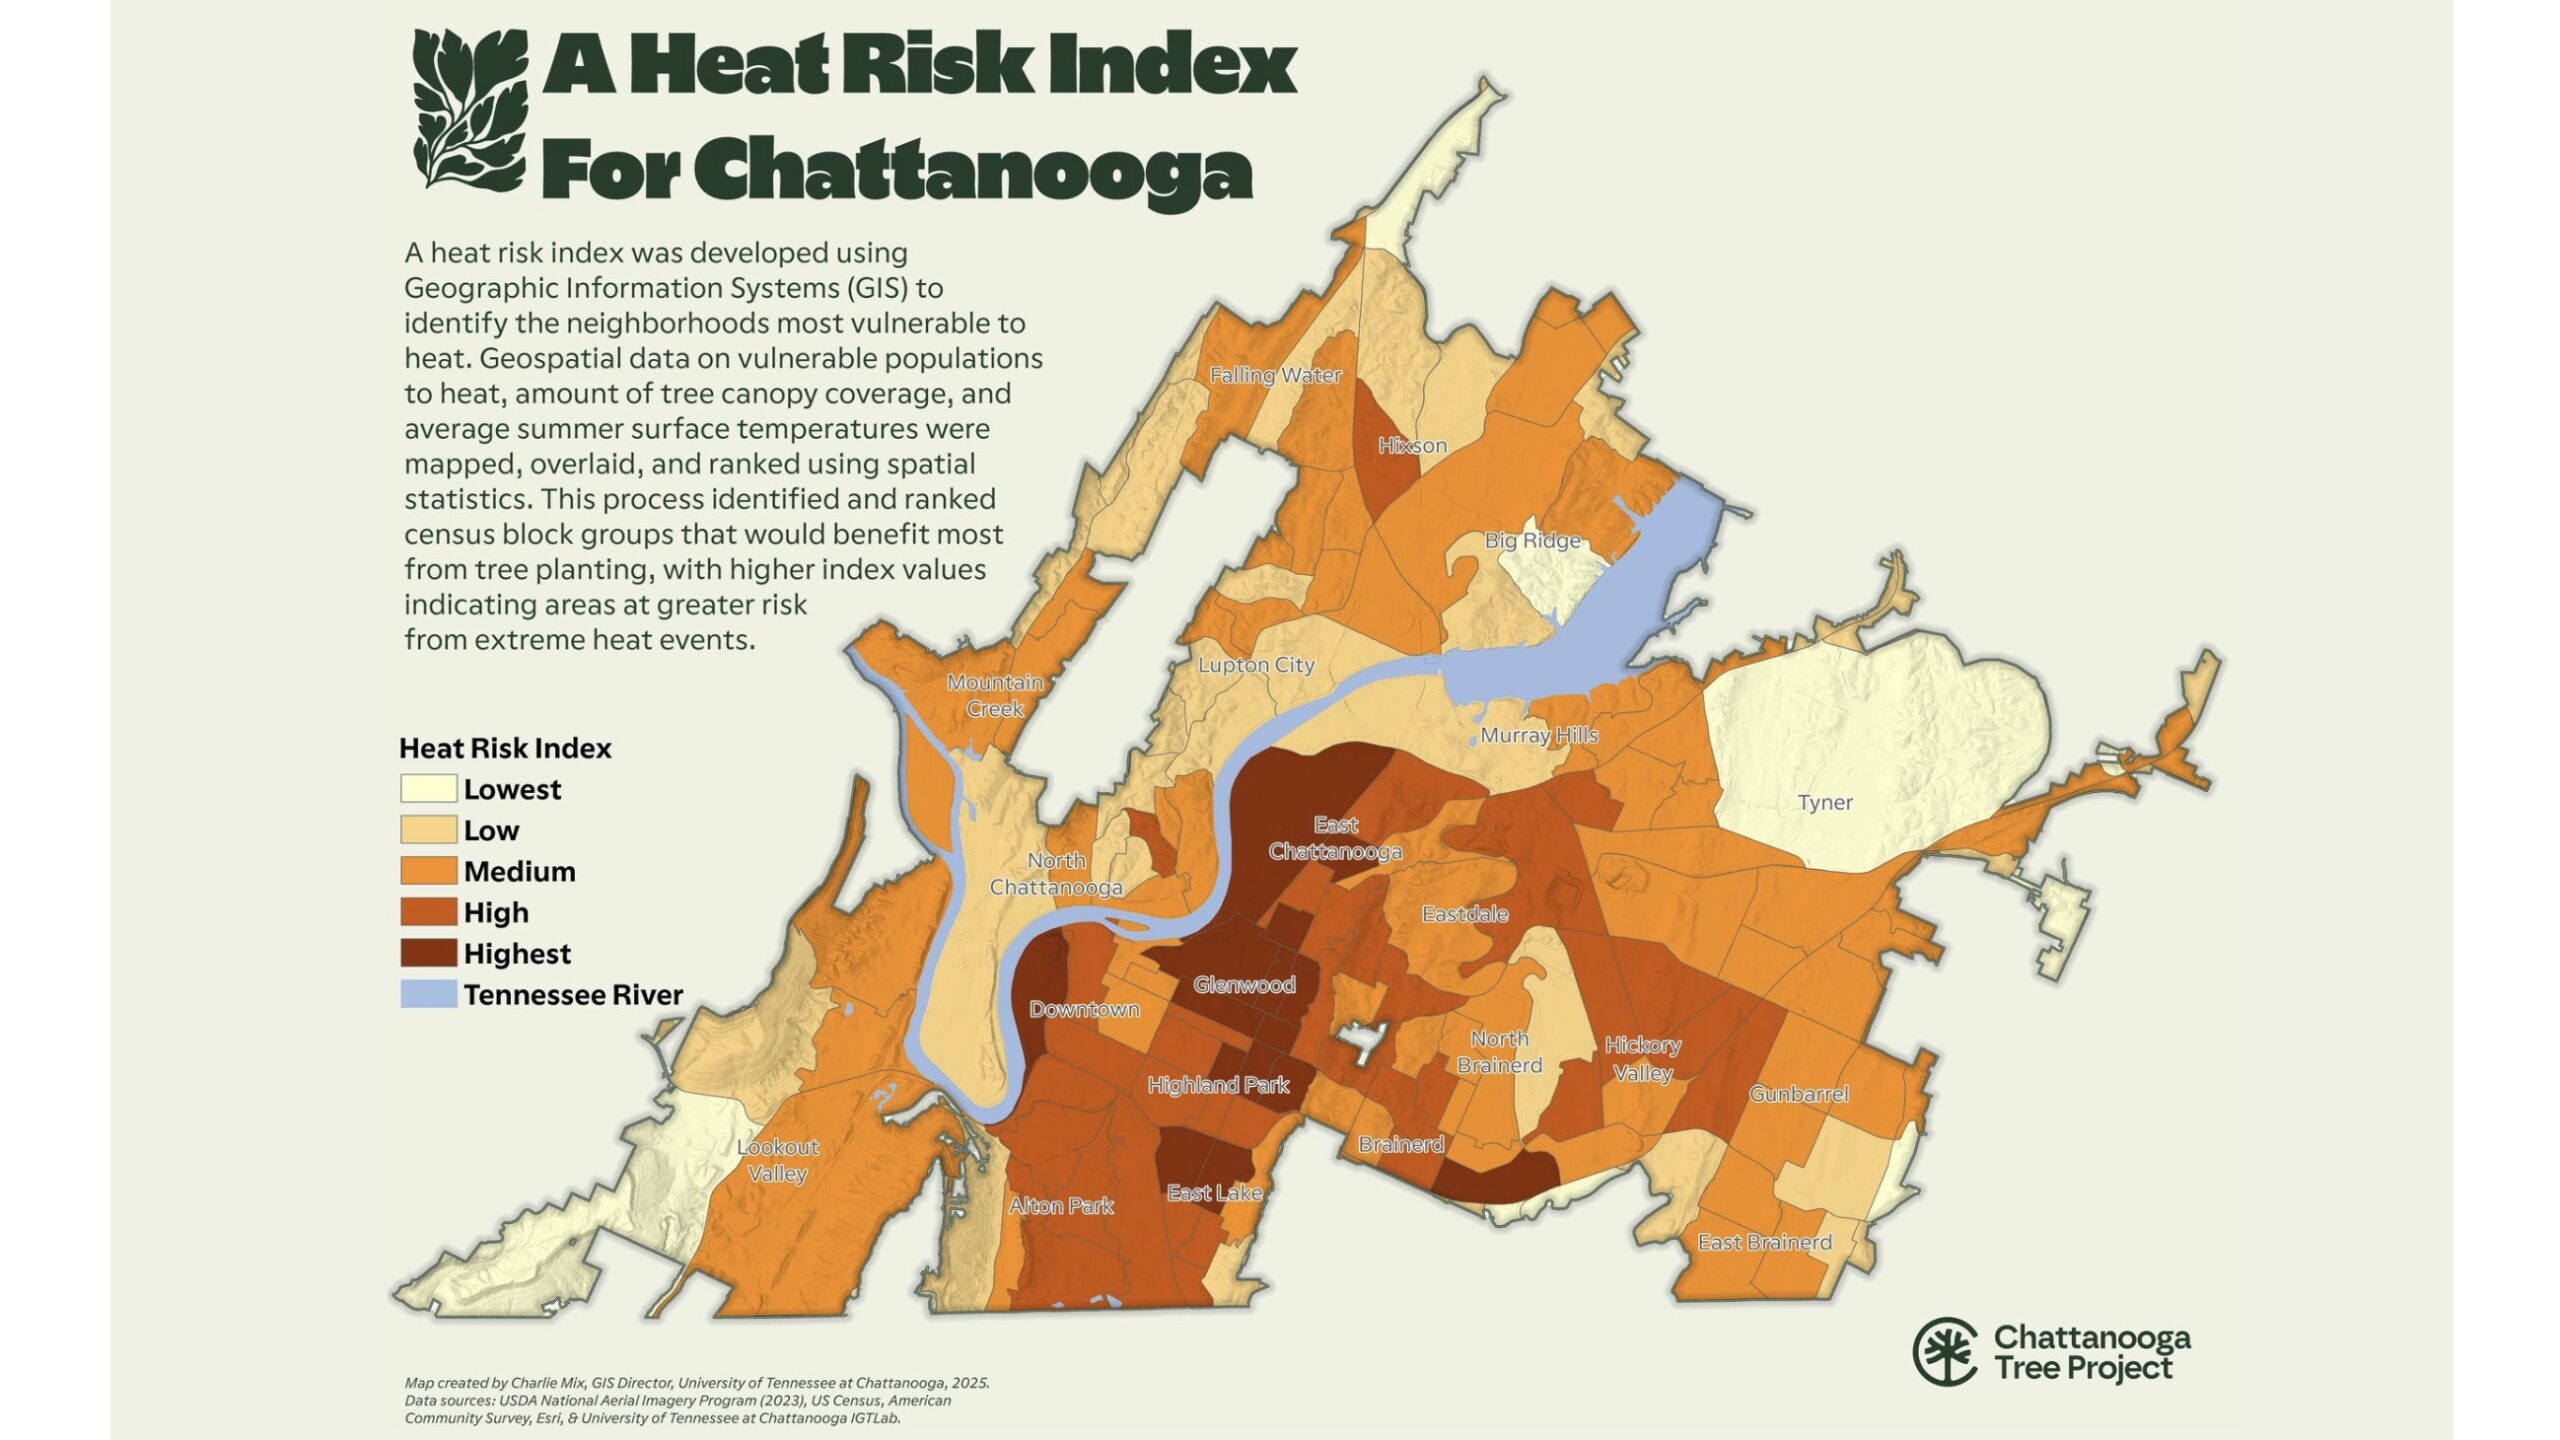
The USDA Forest Service awarded Chattanooga a $6 million grant for an initiative to plant 5,000 trees in priority areas. To determine where those trees should go, Mix created a heat risk index combining surface temperatures with demographics—households with young children and seniors, homes without air conditioning, car ownership rates, and poverty levels.
One neighborhood topped the index: Orchard Knob. The irony wasn’t lost on anyone—the area named for a long-ago cluster of fruit trees had few trees and dangerously high surface temperatures. There was one problem: Orchard Knob sat outside the grant’s original boundaries. Fortunately, the Forest Service approved a boundary change based on Mix’s analysis.
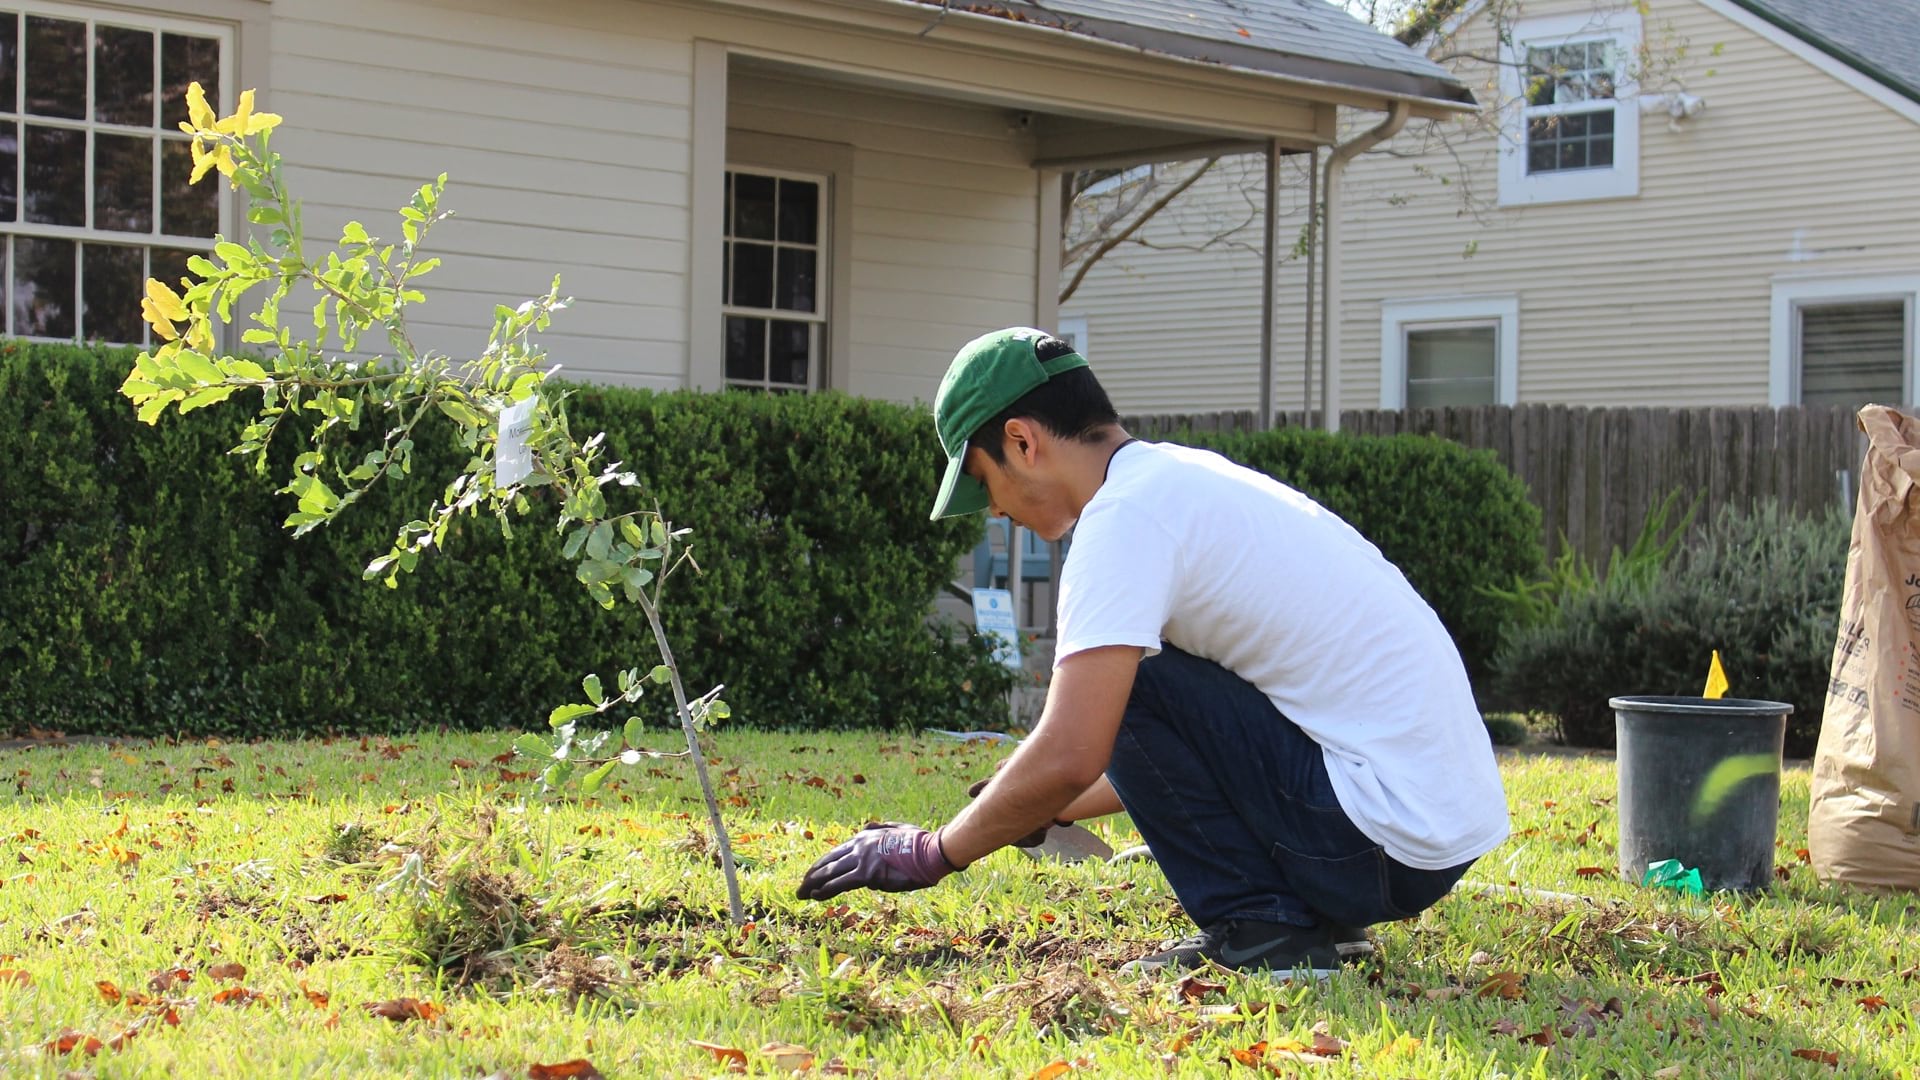
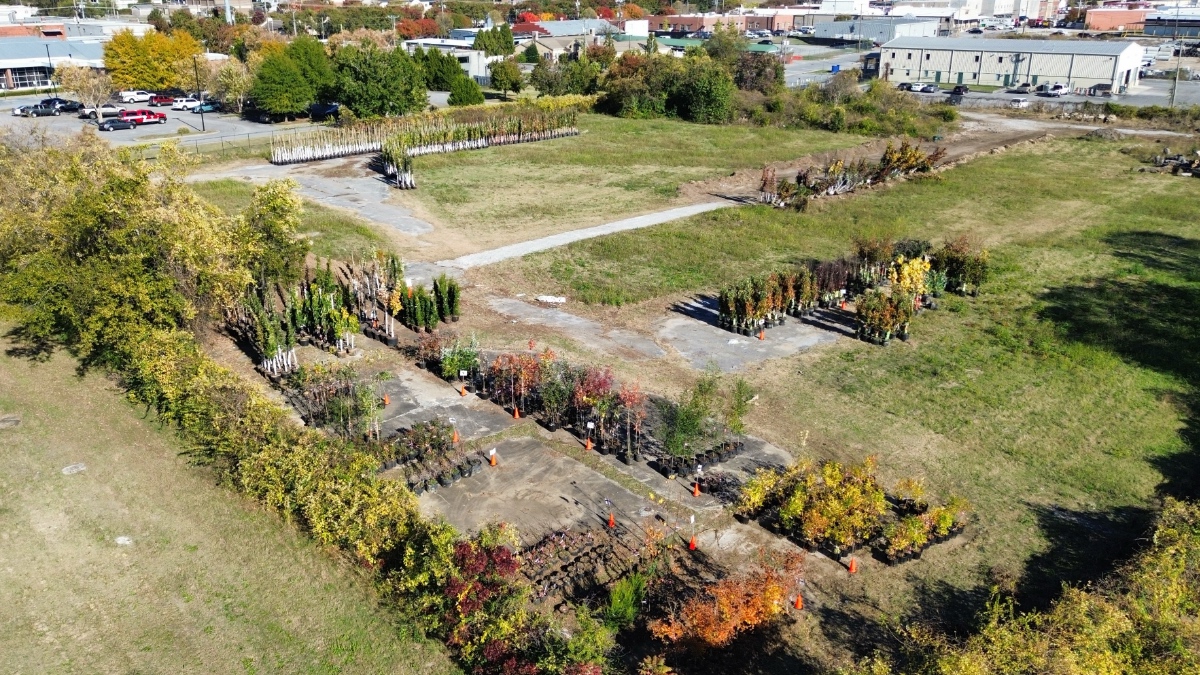
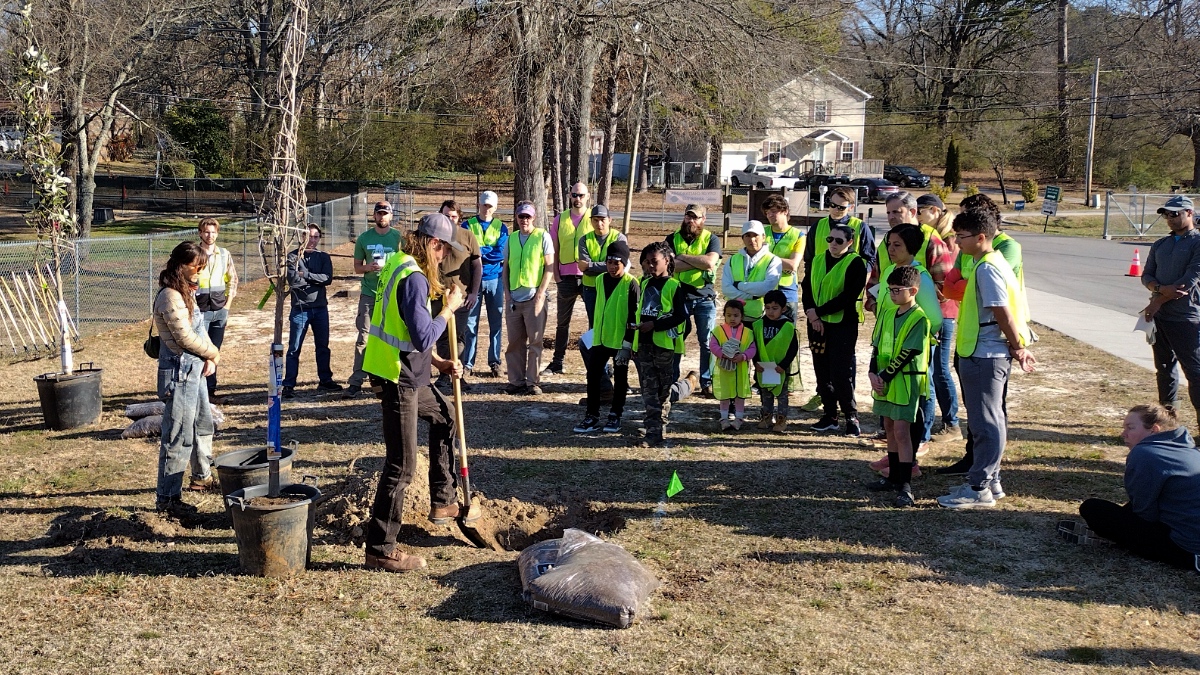
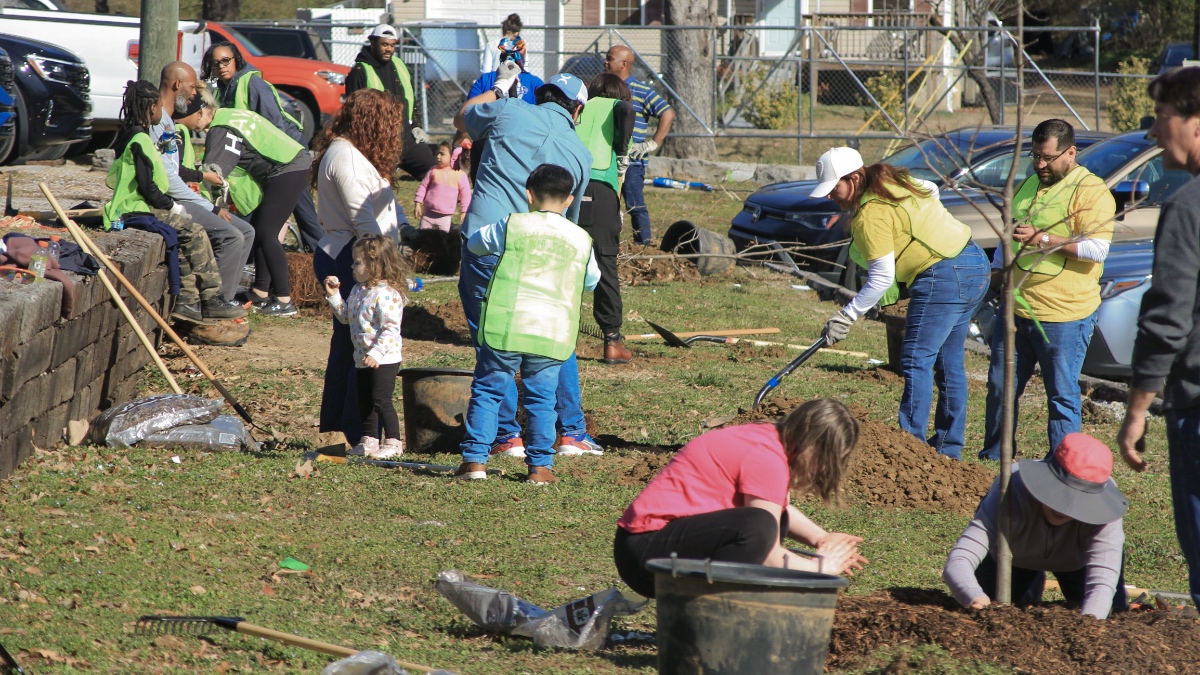
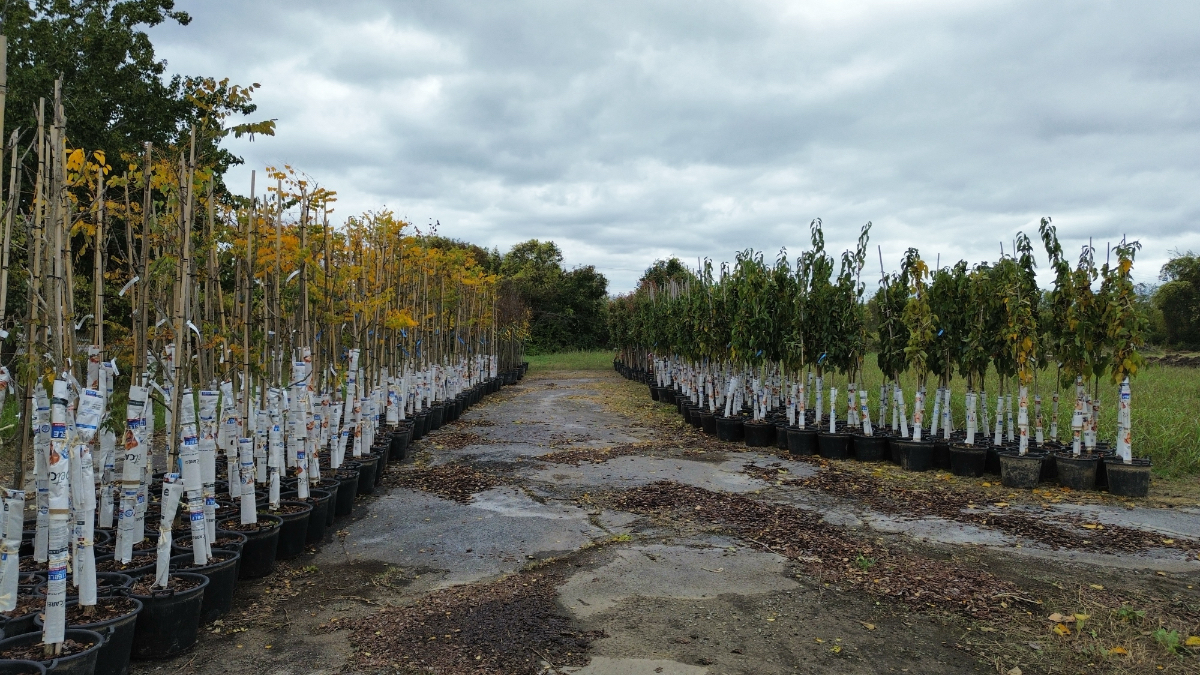
Today, the Chattanooga Tree Project brings together city government, academia, nonprofits, and federal agencies to plant those 5,000 trees in places with the greatest human need and environmental return.
The analysis led to policy change. In 2024, after a year of public meetings, the city passed an updated tree ordinance requiring inch-for-inch replacement of city trees. If someone removes a 36-inch diameter tree, for example, they must plant 18 two-inch diameter replacements.
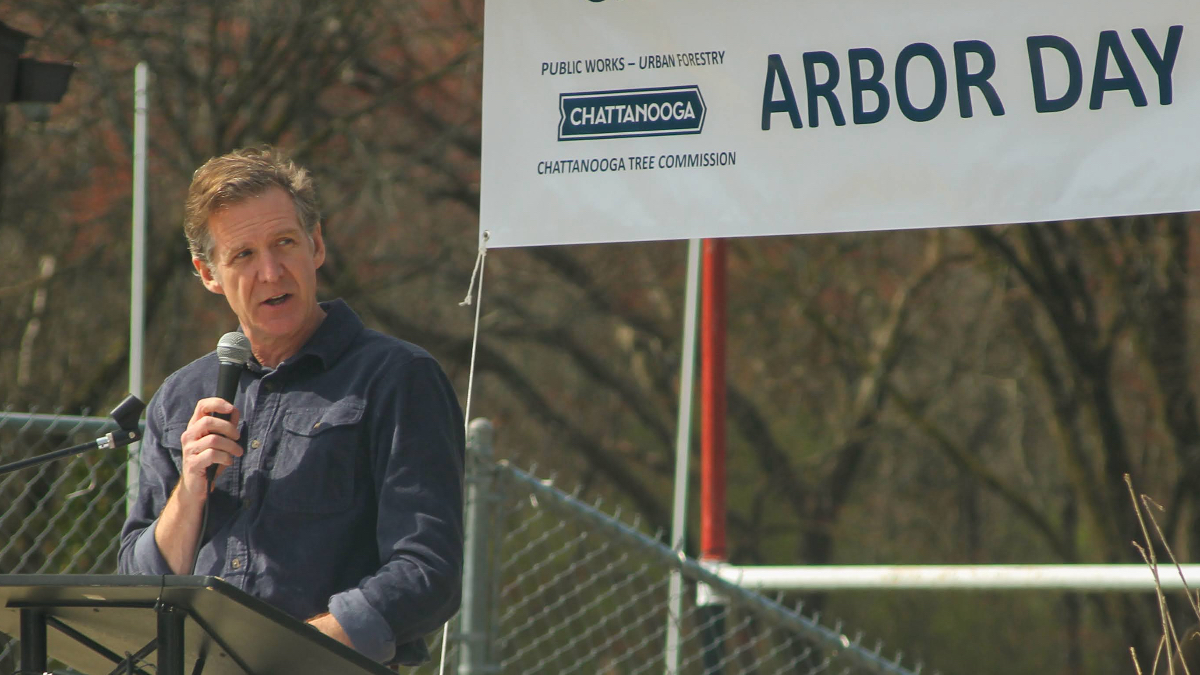
Pete Stewart, an arborist and Chattanooga’s urban forester since 2021, uses GIS maps and apps to guide day-to-day tree maintenance and monitor workflows. Recently, his focus has shifted to land development—guiding where trees are planted, how many, and which species for every project site.
“At least a third of my time is spent in plan reviews and site inspections of construction projects,” said Stewart, who reviews development plans to balance tree inventory and gauge how new construction will affect existing canopy. “Way more trees are planted by developers and affected through construction than any other activity.”
Chattanooga’s focus on trees carries historical weight. In 1969, a report from the US Department of Health, Education, and Welfare identified Chattanooga as having the nation’s worst air pollution. As Mix described it, “The story goes, you could go to work in the morning wearing a white T-shirt and by the end of the day it would be gray from the smoke from all the steel foundries.”
Today, Chattanooga is North America’s first National Park City, an international designation recognizing the city’s commitment to integrating nature into urban life. But as development accelerates and temperatures rise, maintaining the tree canopy becomes both more challenging and more critical.
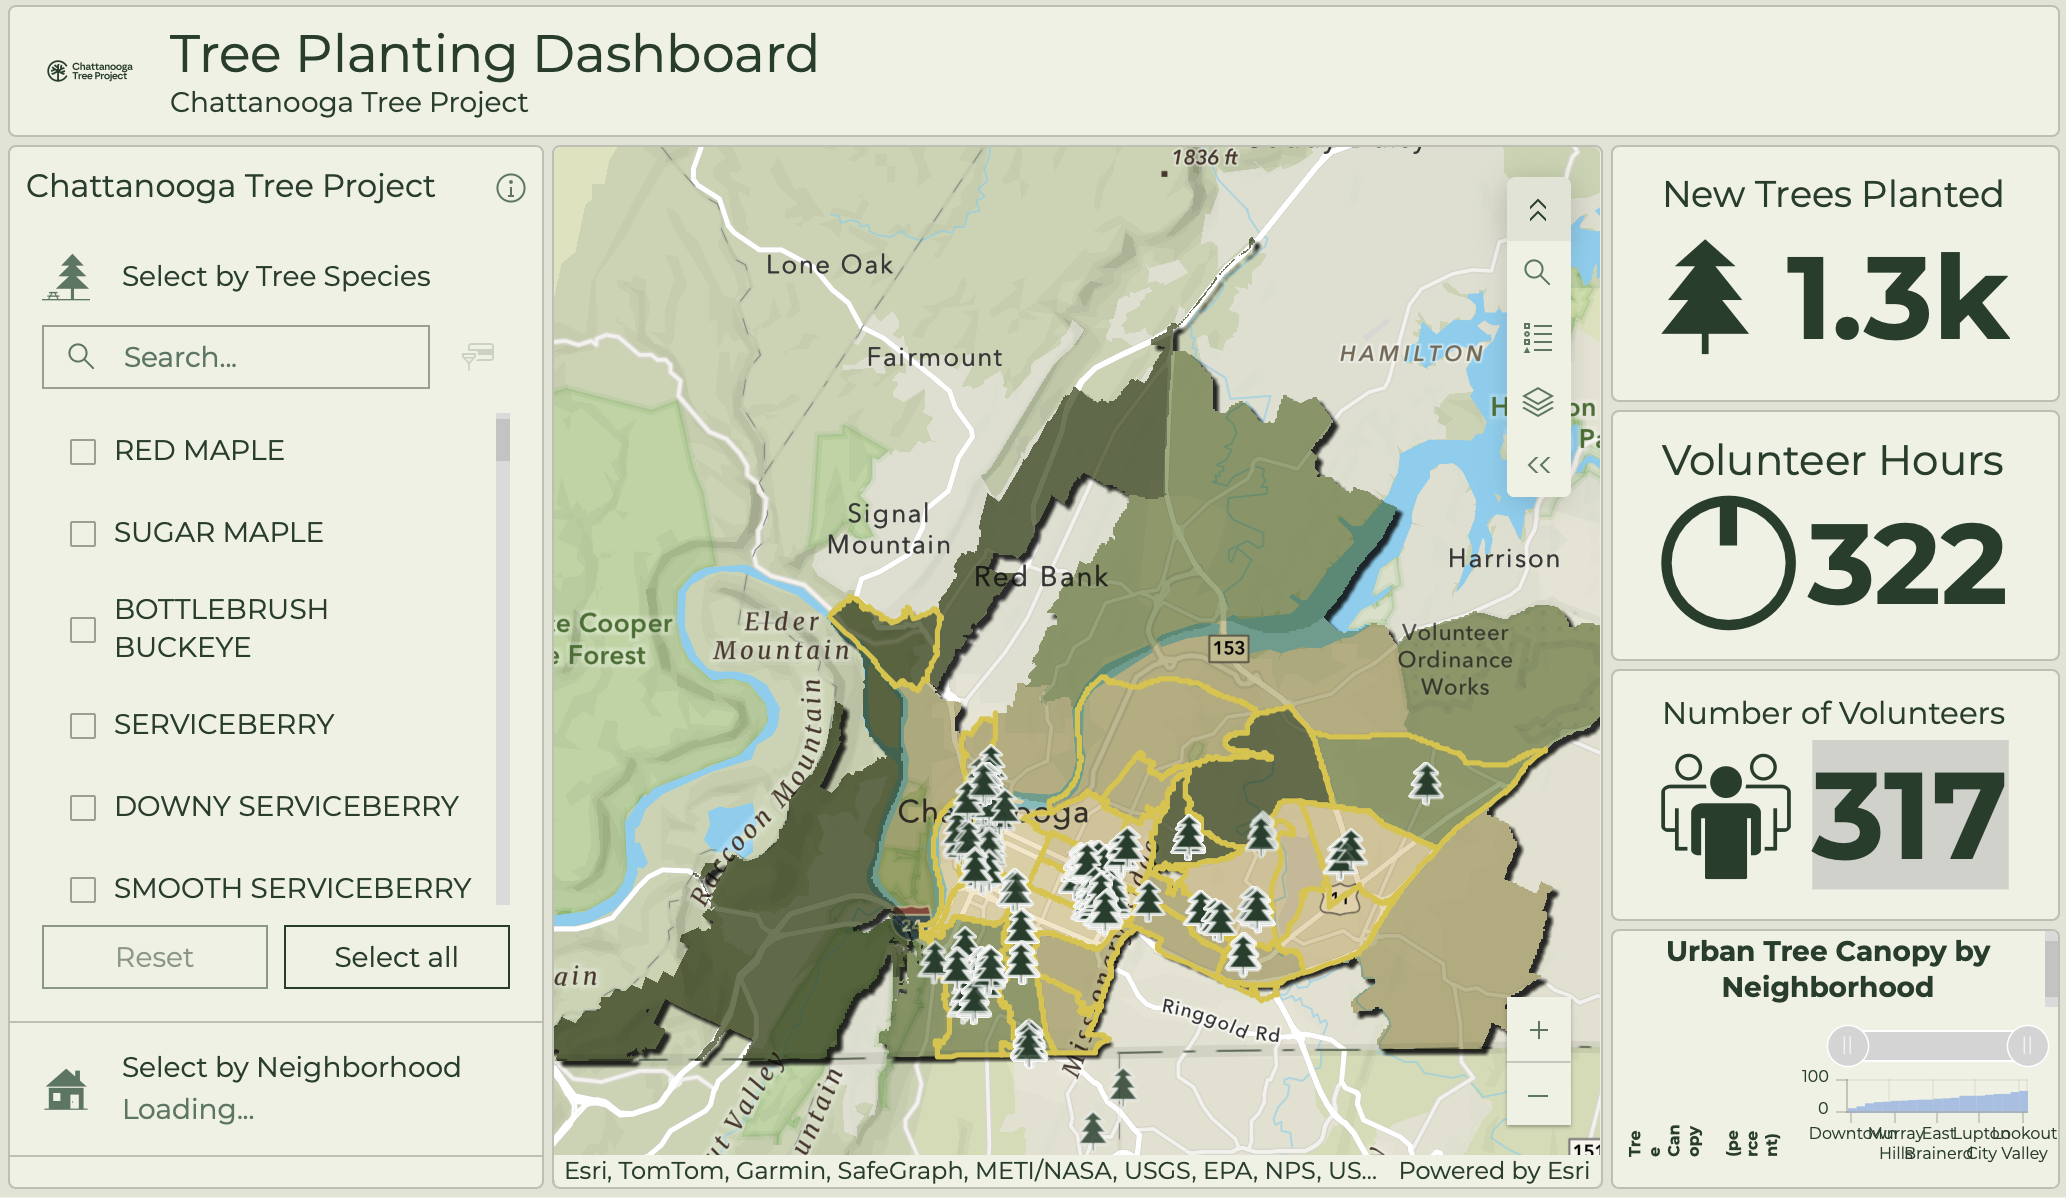
The Chattanooga GIS team, led by manager Brendan Cleary, created a dashboard integrating tree data with the Forest Service’s freely available i-Tree tool to track progress and attach monetary value to each tree—annual property value increases, gallons of stormwater intercepted, and pounds of air pollution filtered.
Tree-lined streets show measurable property value premiums. Hospital admission rates for respiratory illness correlate inversely with tree coverage. A mature street tree intercepts thousands of gallons of stormwater annually, reducing overflow and treatment costs and improving water quality. The GIS dashboards make these quantifiable benefits visible citywide.
They also show that trees do more than filter the air—they help circulate it. Chattanooga is exploring adding air quality sensors mounted to buses to measure air pollution in each neighborhood. That data layered onto tree coverage maps will show where stagnant air necessitates the planting of more trees.
For a city that cleared its air of industrial smoke, the goal of strategic tree planting is within reach. “The resilience of nature is pretty amazing,” Mix said. “We have a real opportunity to protect these forests now, so our neighborhoods don’t become hotter in the future.”
Learn more about how GIS helps municipal foresters map and manage the trees in their city.