
June 16, 2026 |
John Beck | Public Safety
October 15, 2026
The illegal firearms dealer should have been out of reach. Instead, calls out of the Pennsylvania prison system suggested he was still doing business from the outside. He offered to supply weapons to those who could not legally purchase them and to help move drugs to inmates.
A year earlier, phone calls tied to a Philadelphia address had caught the attention of intelligence analysts at the Pennsylvania Department of Corrections (PADOC). In those calls, the speakers, using prison slang, discussed a modified rifle trigger. Analysts deciphered the conversation, then alerted the dealer’s parole agent and a search followed. Norman Copper was arrested after authorities found weapons, cash, and drugs.
But when the case went to trial, a legal error undermined the prosecution and Copper was released. Within weeks, analysts saw signs that he had returned to selling firearms to criminals.
Then a new lead emerged. An inmate mentioned someone who could get drugs into the facility and sent that person a video-visit link. When the video call connected, PADOC analysts recognized the visitor as Copper.
The new evidence came via Copper’s GPS ankle monitor. The location data showed him making repeated trips along certain routes, with those movements converging on a property that investigators identified as a stash house. When Copper shifted the stash location into neighboring Montgomery County, local investigators combined the GPS movement data with their own surveillance reports to support a search warrant. The ensuing search produced the evidence needed to convict Copper, who was later sentenced to 45 years in prison.
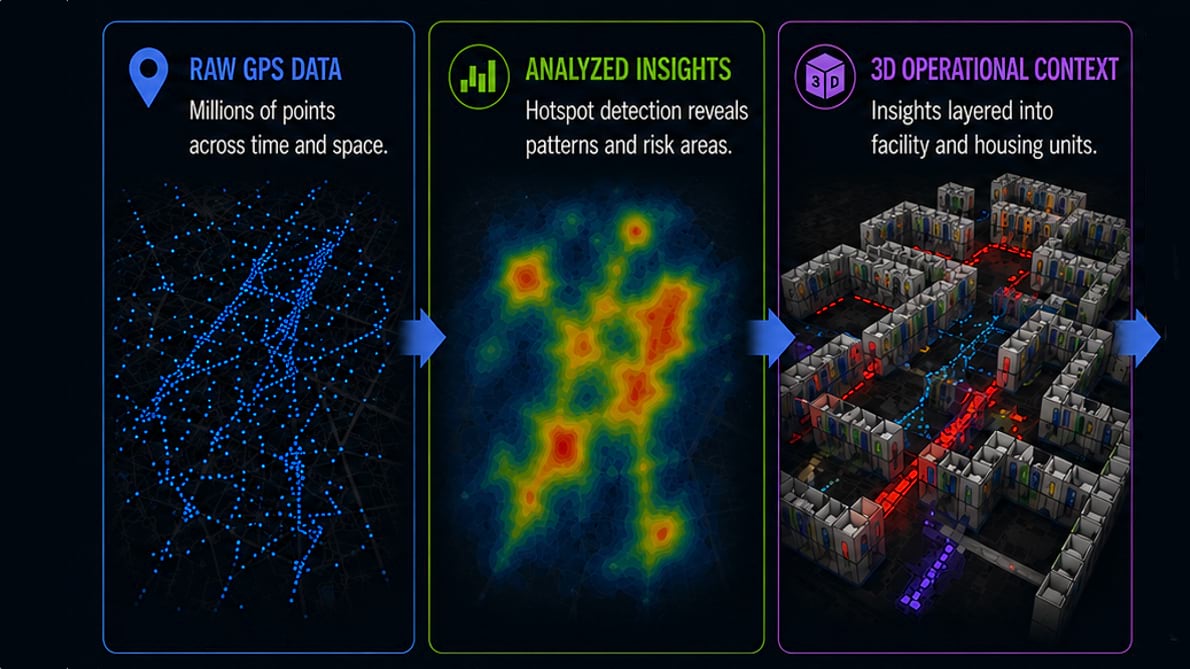
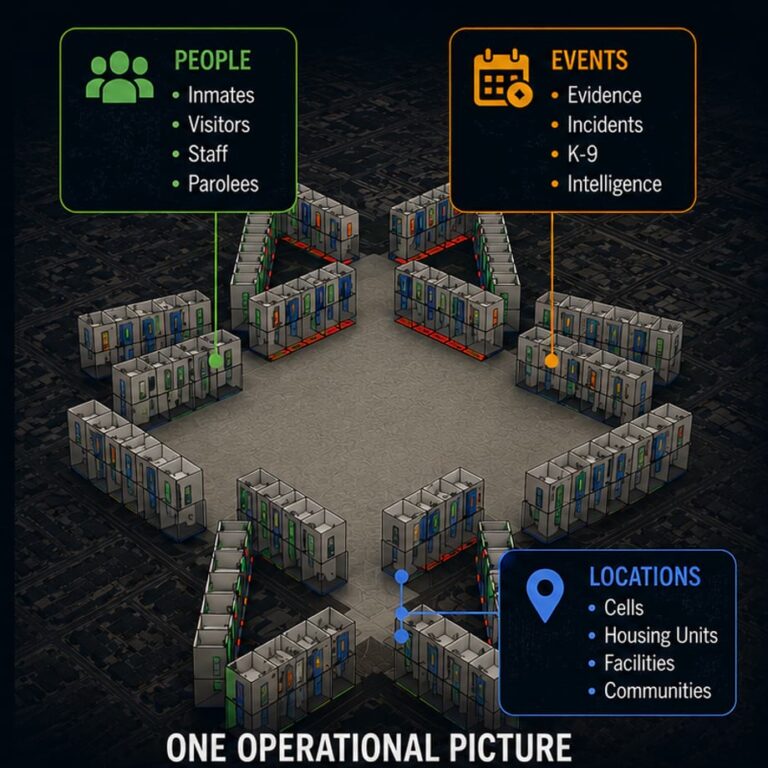
The case proved something the intelligence unit had been arguing for years. Phone calls, video visits, financial transactions, and GPS points can do more than record what has happened. They can also show where people go and whom they meet. By connecting people, events, and locations across time through geographic information system (GIS) technology, hidden patterns reveal themselves and help investigators identify criminal activity, social networks, and additional suspects.
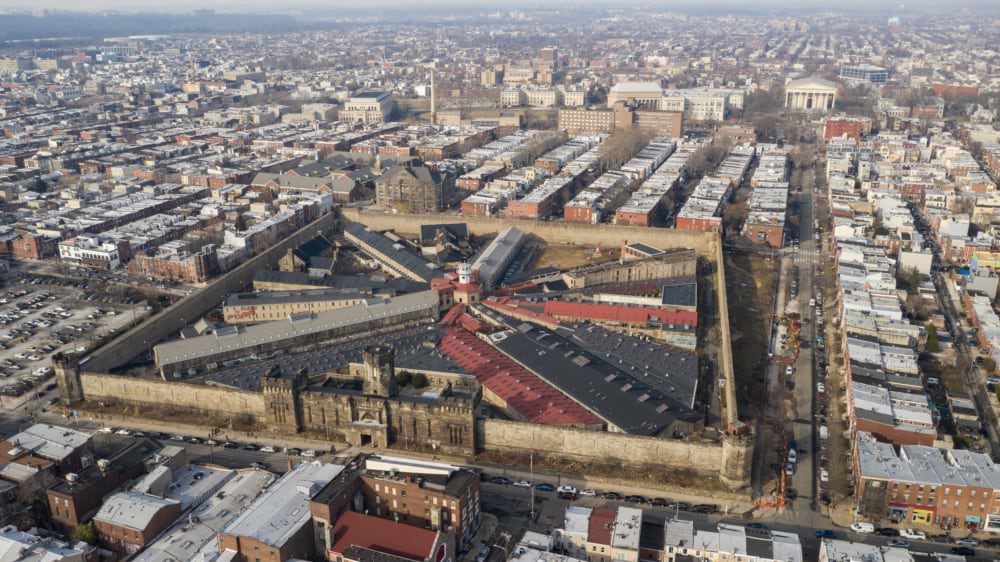
The PADOC supervises approximately 39,000 inmates across 22 state prisons as well as more than 28,000 individuals under parole supervision in communities across the state. These inmates complete more than two million phone calls a month. Add video visits, email, GPS traces, and financial transactions, and the sheer volume becomes impossible to search manually.
Damien Mscisz supervises the analysts responsible for turning that data into actionable intelligence. He thinks about the department’s blind spots the same way that the statistician Abraham Wald recognize a WWII problem for the military. Commanders wanted to reinforce the spots on returning aircraft where there were the most bullet holes. Wald showed the commanders the flaw: Those aircraft were the planes that had made it back. The real vulnerabilities were on the planes that didn’t return.
Mscisz applies the same logic. Inmates who get caught, and the location where incidents happen, are the visible data. A quiet cell might mean nothing is happening there or it might mean someone is good at not getting caught.
Solving for that gap became the design principle behind Pennsylvania’s corrections geospatial intelligence program, built on ArcGIS Enterprise and organized around three questions: What’s happening inside the walls? What invisible relationships connect the people involved? And what happens once they’re released?
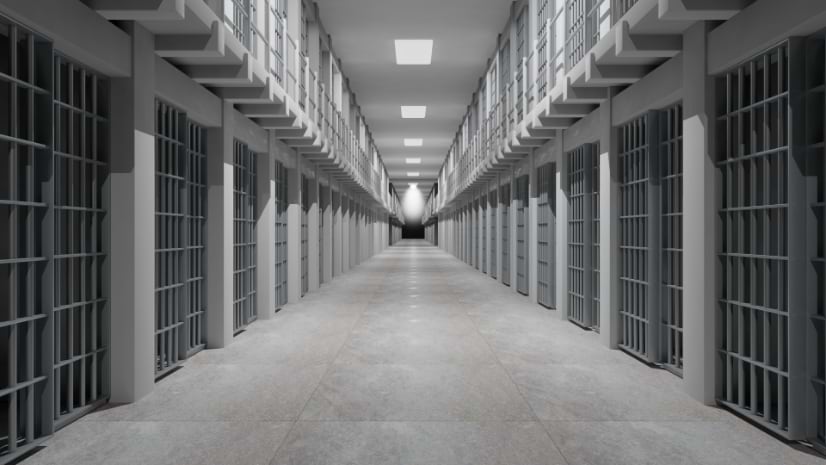
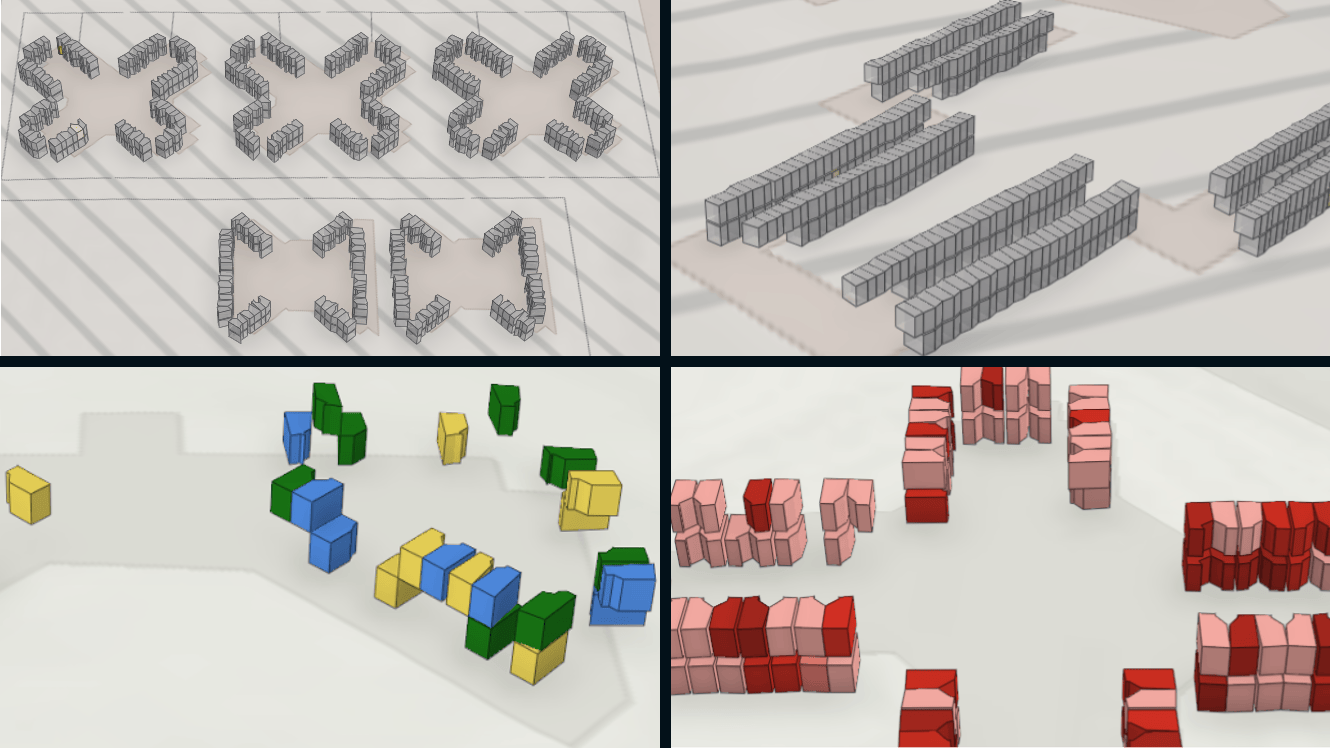
One of the first steps to implementing GIS, was for Mscisz’s team to create digital representations of PADOC facilities. Knowing the layout of each State Correctional Institution (SCI) would show where incidents were occurring, where inmates were housed, and where the problem locations were.
Every one of Pennsylvania’s 22 institutions has its own cell-numbering convention, and numbering plans often changed during or after construction. The unit’s staff ended up asking every facility’s critical incident manager to walk the buildings and write down what they found by hand.
Once the maps went live, counselors who used to sort information in a spreadsheet by cell number to check for gang conflicts, can see the same information layered over the building itself, down to individual beds. They could keep problem inmates separate from the general population or apart from each other if they were in rival gangs or had a history of conflict.
A lieutenant at SCI Albion watched recurring fights break out between inmates from Philadelphia and Erie. He asked to see where people from those cities were housed. The resulting hot spot map explained the friction and allowed the superintendent to make moves that would ease tensions.
Drug activity follows a similar pattern of proximity. Positive drug tests, mapped by cell and cross-referenced against deposits in inmate accounts, can be used to separate users from dealers. Canine units, sent to sniff for drugs, have increased their alerts and finds based on better targeting.
The cell-level map lays out the geography. It doesn’t show the connections. For that, Mscisz built Python scripts that pull together phone records, video-visit logs, and commissary package senders. The scripts flag inmates who all call the same number and get visited by the same person.
Money reveals similar hidden connections. In Pennsylvania, roughly 62,000 outside senders deposit close to $20 million into inmate accounts every month, and every deposit carries a name, an address, and a phone number. Mapped by geography, the data shows senders clustered in the same Philadelphia neighborhood, all supporting inmates at the same facility. It also shows that a single sender is sending money to 10 different people on one cell block. That pattern might mean someone is being forced to traffic items or perform services for protection, commissary packages, or drugs. Recognizing the pattern gives staff a chance to step in and disrupt coercion.
Moving inmates within a prison or between facilities is an obvious answer to proximity problems, but it only buys time. An inmate skilled in exploiting the system often creates a new network wherever they land. Seasoned staff can spot when an inmate or a group of inmates is making a move. A shared map, informed by past patterns, allows every staff member to see it too.
Supervision doesn’t end at release, and neither does the data. About 450 parolees currently wear GPS ankle monitors, generating a rolling week of location history that updates hourly. Before this system existed, a parole agent could only view one person’s trail at a time.
Layered together, GPS tracks show relationships. Two parolees, assigned to different agents but showing up in the same places at the same times, are flagged as co-travelers, a pattern that’s worth examining to see if they’re conducting business together. The system also signals when someone on GPS visits another parolee’s registered home address, a pattern that investigators connected to drug distribution networks.
The department has also started cross-referencing GPS traces against public crime data, looking for monitored parolees who were near the location of a reported crime shortly after it happened. It recently placed its first analyst inside the Delaware Valley Intelligence Center specifically to offer support to local law enforcement, because a pattern alone isn’t evidence. It’s a starting point.
Mscisz has an insatiable curiosity about inmate and parolee patterns and how each indoor map captures the unique nature of every facility. With every successful discovery or intervention, he’s receiving more requests for maps and analysis. Facility lieutenants who were skeptical at first are now asking where to conduct their next canine search.
Learn more about how law enforcement agencies use GIS to analyze crime patterns, share intelligence across jurisdictions, and deploy resources more effectively.