


June 19, 2019 |
Carl Walter | Public Safety
Seattle Police Department’s (SPD) special event planners review past event plans and outcomes from major sporting events, concerts, festivals, and parades. Rather than analyzing elements on the field or the stage, these law enforcement specialists examine crowd flows, officer deployments, and response to incidents.
SPD measures success by the absence of serious incidents. In public safety operations, there is no standard playbook—just experience, comprehensive contingency planning, and real-time situational awareness that enables repositioning to address incidents or threats.
“There’s no formula,” said Officer Pablo Lee, SPD’s veteran event planner who returned to the Seattle Police Operations Center (SPOC) after a stint in traffic safety. “The standard is that no one dies at the end of the day.” It’s a sobering reminder that law enforcement is measured by what doesn’t happen—success equals disasters averted, violence prevented, and crowds that disperse safely into the night.
When Pablo Lee left special events planning in 2017, the department’s geographic information system (GIS) technology capabilities for event planning were discontinued. Budget cuts, staff turnover, and the changing agency priorities meant that sophisticated planning tools were replaced by analog methods. “When I got back to SPOC, I asked where they kept event plans and I learned they didn’t know that they existed,” he recalls. The institutional knowledge had vanished, but technology had evolved dramatically during his absence.
Gone was the systematic three-phase approach with GIS that had made SPOC’s event management so effective. Pablo Lee and his team had developed a workflow that treated each event as having distinct phases: pre-event planning (where GIS tools help determine staffing needs, barrier placement, and resource allocation), real-time operations (where analysts continuously update maps with live intelligence while commanders access dashboards on their mobile devices), and postevent after-action analysis (where time-enabled data becomes the foundation for future planning and legal documentation). “We have a preplan tool; an operational tool; and then postoperational, which is the after action,” Pablo Lee explained. This integrated approach means GIS isn’t just a mapping exercise—it forms the backbone of how SPD approaches event security, from conception through completion, with each phase building on the previous one to create an ever-improving cycle of public safety intelligence.
The contrast between old and new methods is stark. The SPOC captain previously used a printed map of the stadium with Post-it notes representing officer deployments—lose a Post-it note, lose five officers’ worth of coverage. Today, that same captain simply says, “Bring up your map,” and the whole operational picture shows up on-screen. It has every position recorded and every decision saved, and every contingency plan can be accessed with a few clicks.

When commanders question Pablo Lee’s staffing requests, GIS provides evidence to back up expensive decisions. “I show that we need eight people at an intersection, and the commander will ask why because it’s only a four-lane road,” Pablo Lee said. But a click on the spot reveals the true complexity: What appears to be a simple four-way intersection is actually five lanes flowing in four directions with multiple turn lanes. “And then they look at it and they get it.”
Seattle’s special events team now operate as a coordinated unit, with multiple specialists managing different aspects. Rita Lee, enterprise GIS data supervisor, monitors activities during events. Leah Saunders, senior data analyst, maintains the infrastructure that keeps data flowing between city GIS environments. Saunders also creates the mapping layers, applications, and dashboards.
GIS helps city departments work together. The fire department’s staff can flag their access needs, transportation officials can mark critical routes, and commanders can see plans and posts and understand why certain decisions were made.
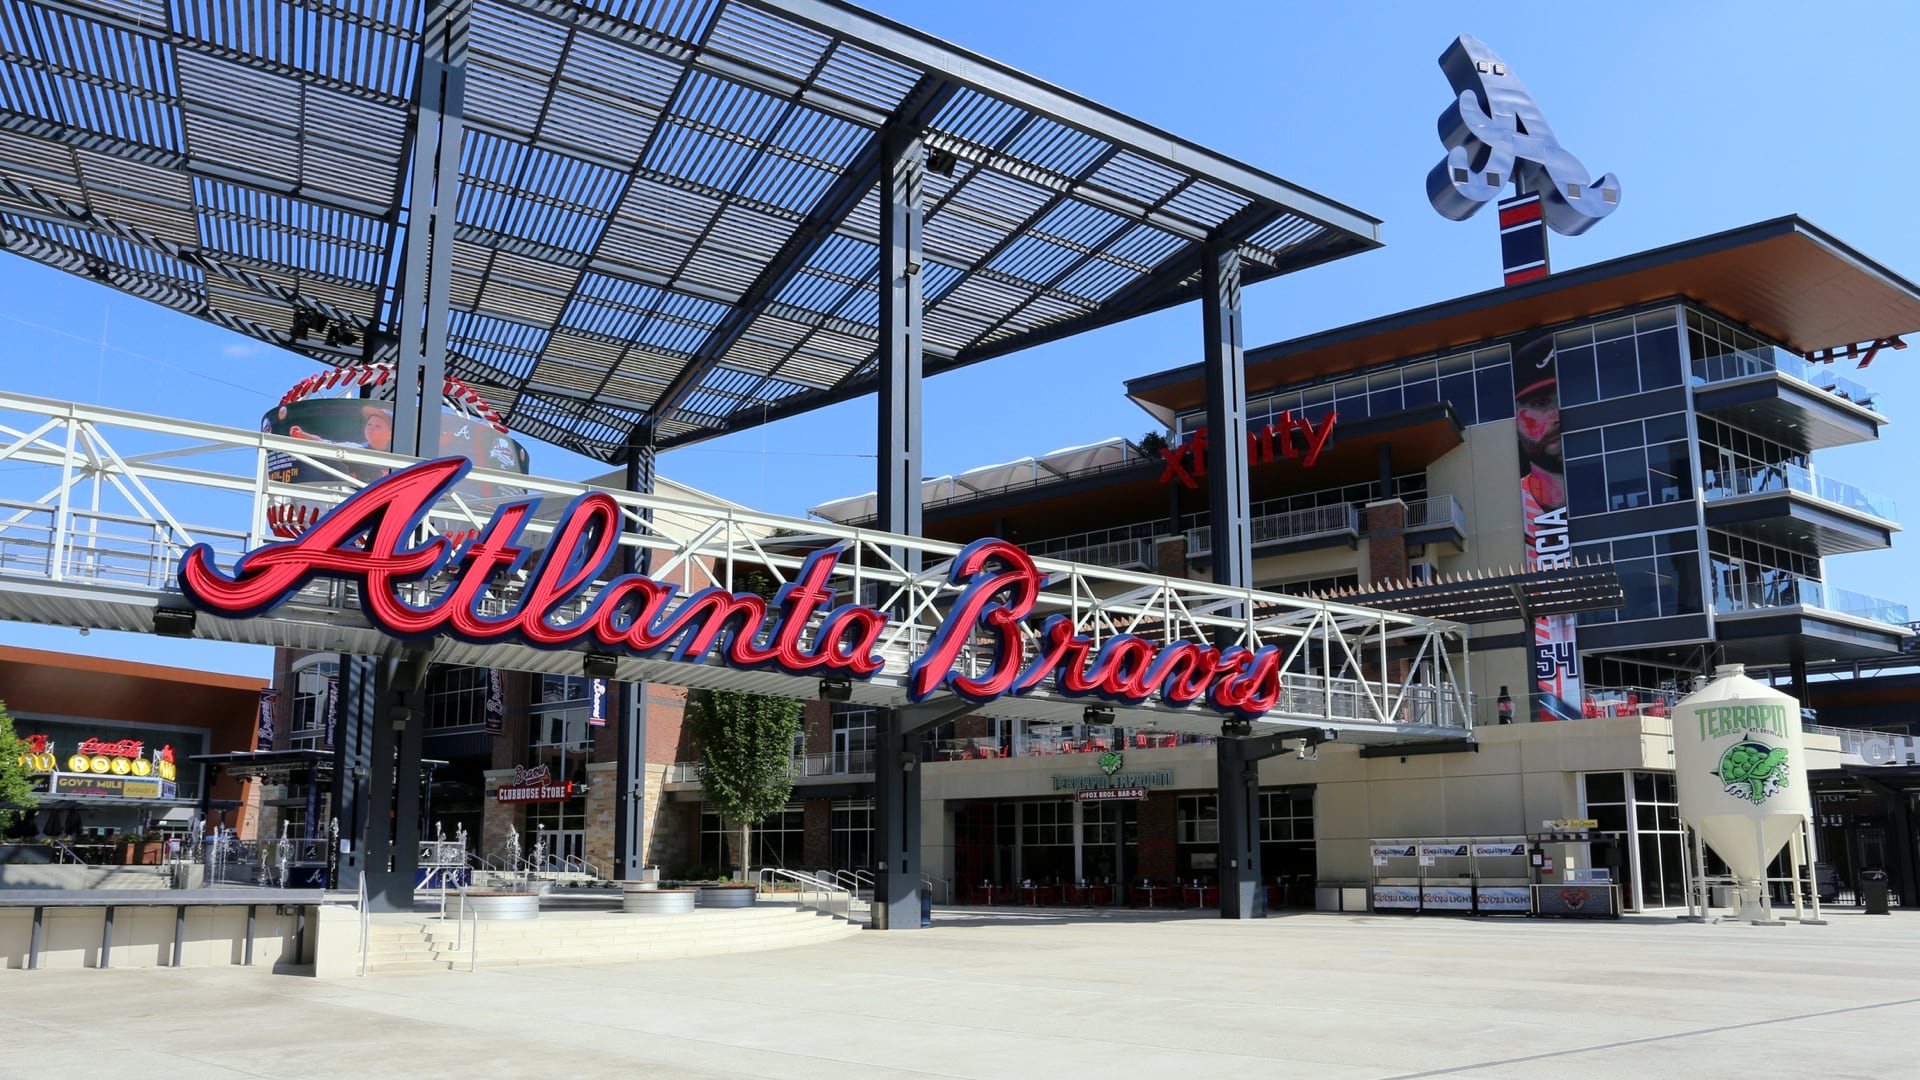
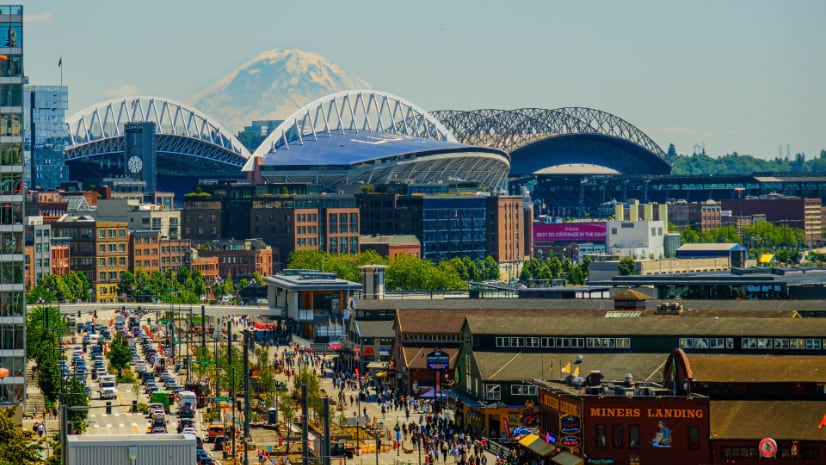
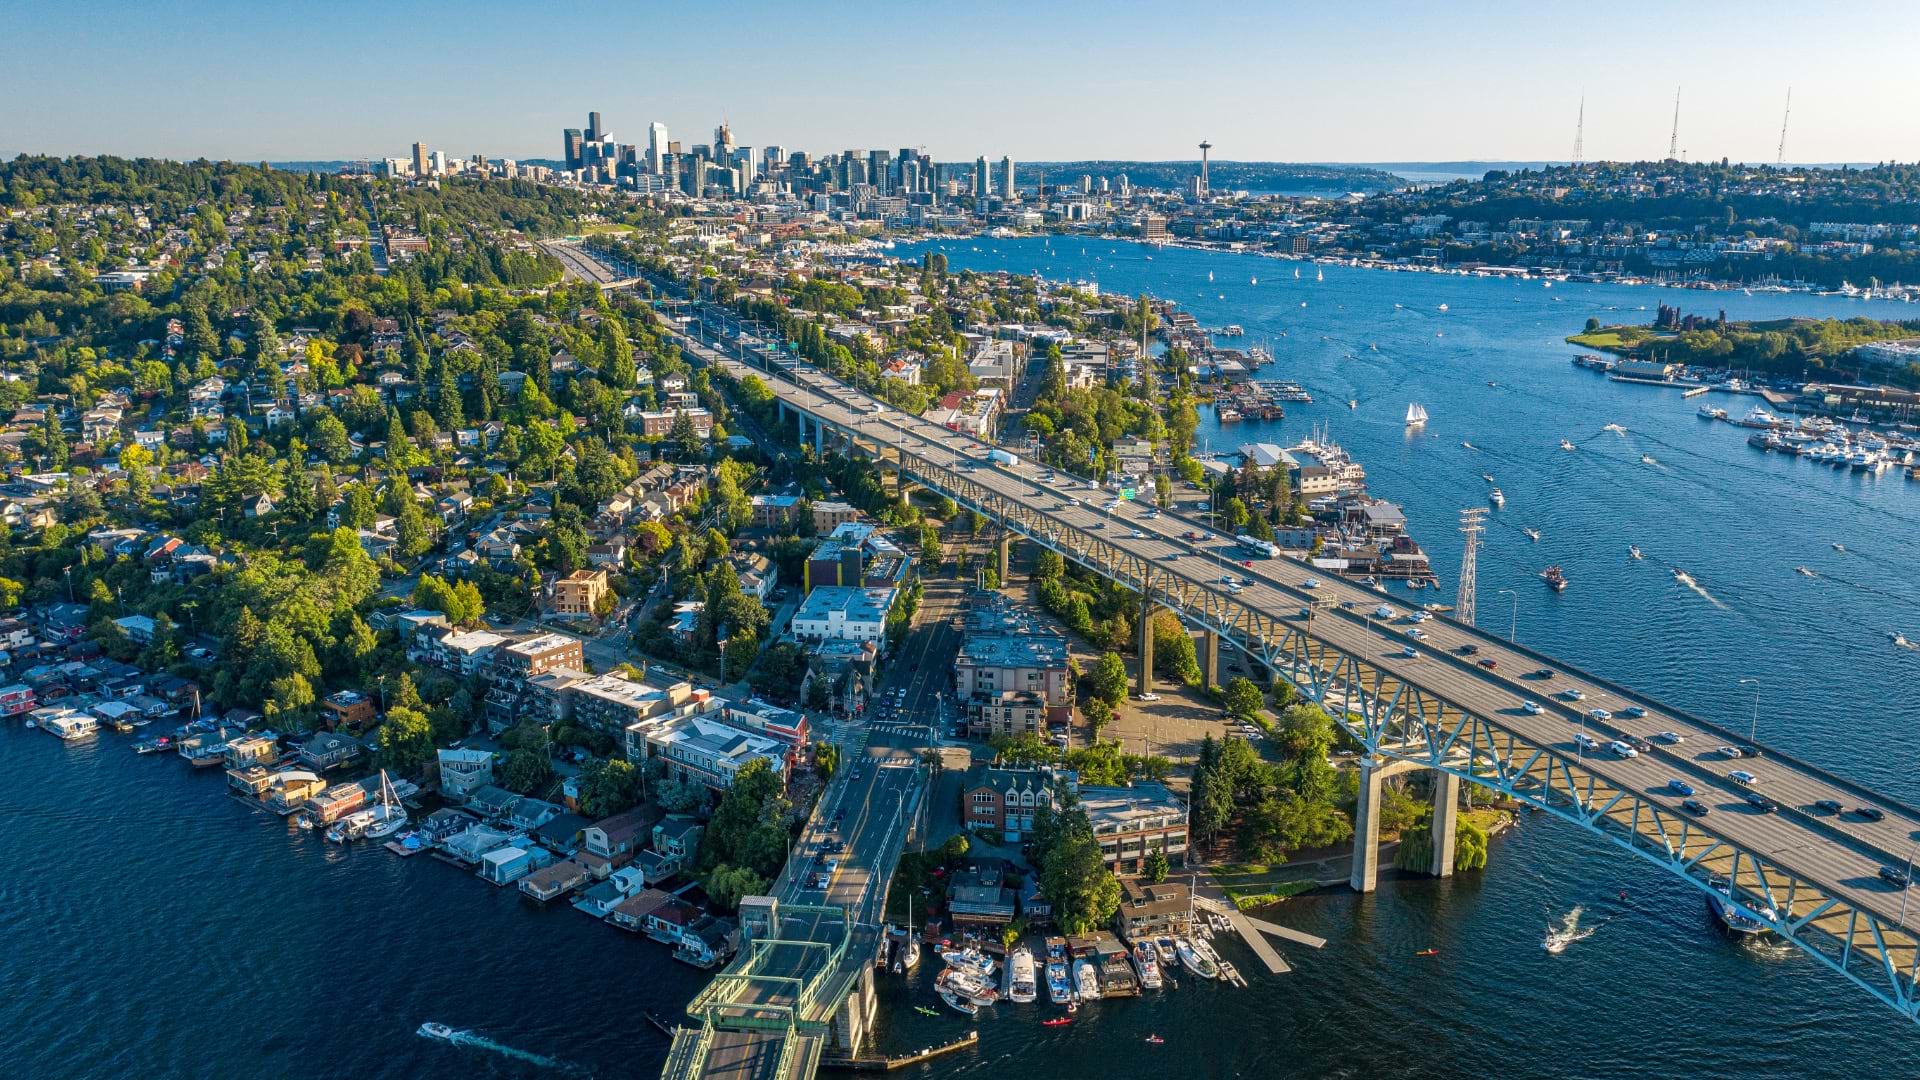
Seattle’s dense urban landscape—squeezed between Puget Sound and Lake Washington with Interstate 5 on one side and water on the other—forms a natural funnel that can trap hundreds of thousands of event attendees alongside regular commuters, cruise ship passengers, and freight traffic bound for the Port of Seattle. Add two stadiums surrounded by businesses, railroad tracks, and highway on-ramps, and you have what Pablo Lee calls a perfect storm of logistical nightmares.
To deal with this complexity, GIS tools calculate capacity limits and resource requirements. SPD staff can determine traffic barrier needs for street closures or and officer deployments along parade routes.
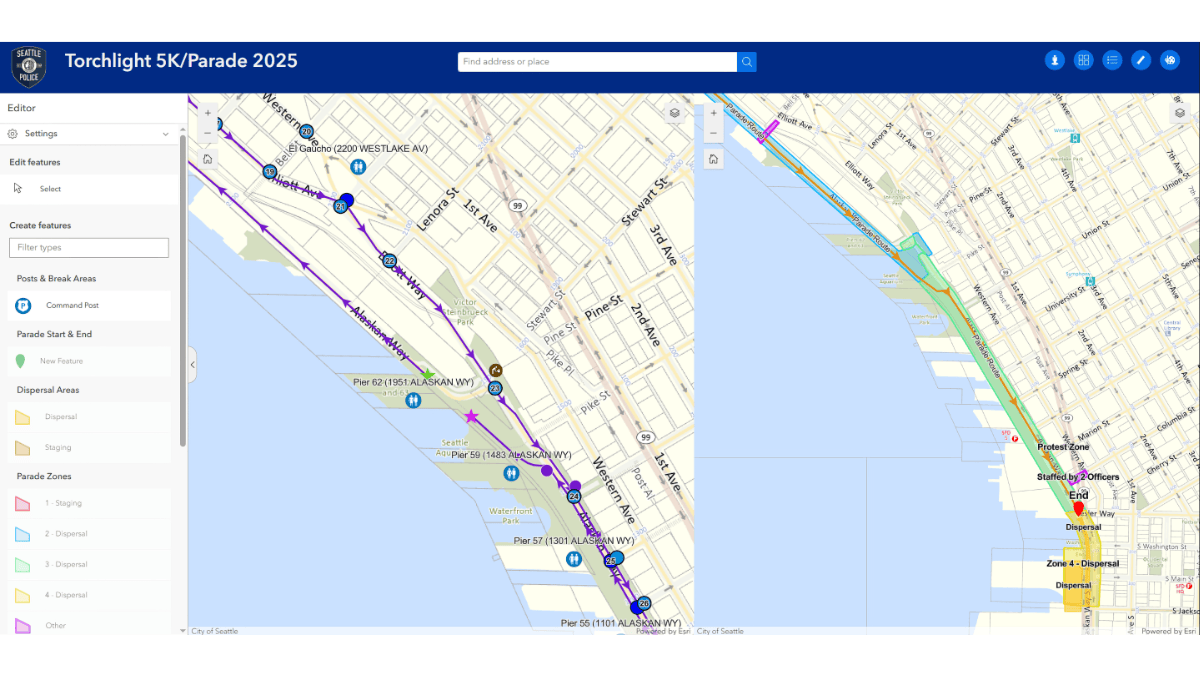
For this summer’s Torchlight Parade, featuring an entirely new route along Seattle’s revitalized waterfront, the special events team accomplished in 30 minutes what historically required months of meetings. “We got the whole route staffed; we knew the traffic plan; we figured out where to put 120 officers; and then within a matter of 30 minutes, we had it done,” Pablo Lee said, marveling at the transformation from dial-up to broadband speeds in public safety planning.
While other police departments leverage aerial drones and extensive camera networks for event security, Seattle operates under an ordinance that prevents this level of monitoring of activity.
This technological constraint forces SPD to rely even more heavily on its GIS platform and observations from personnel in the field.
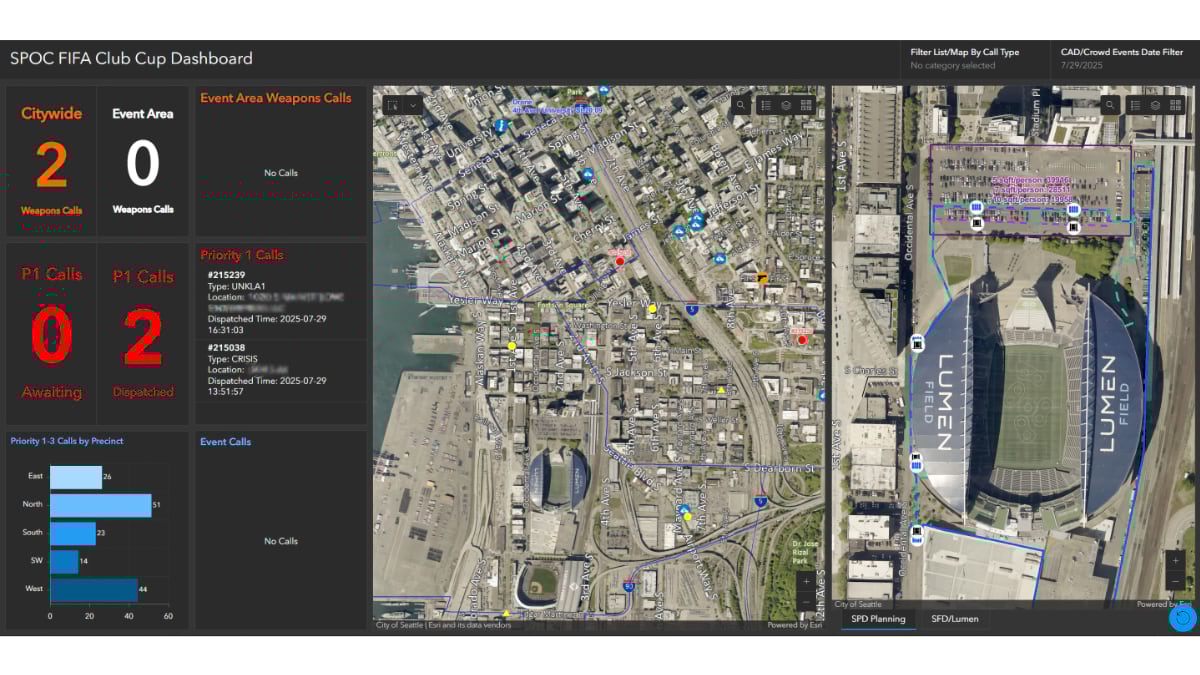
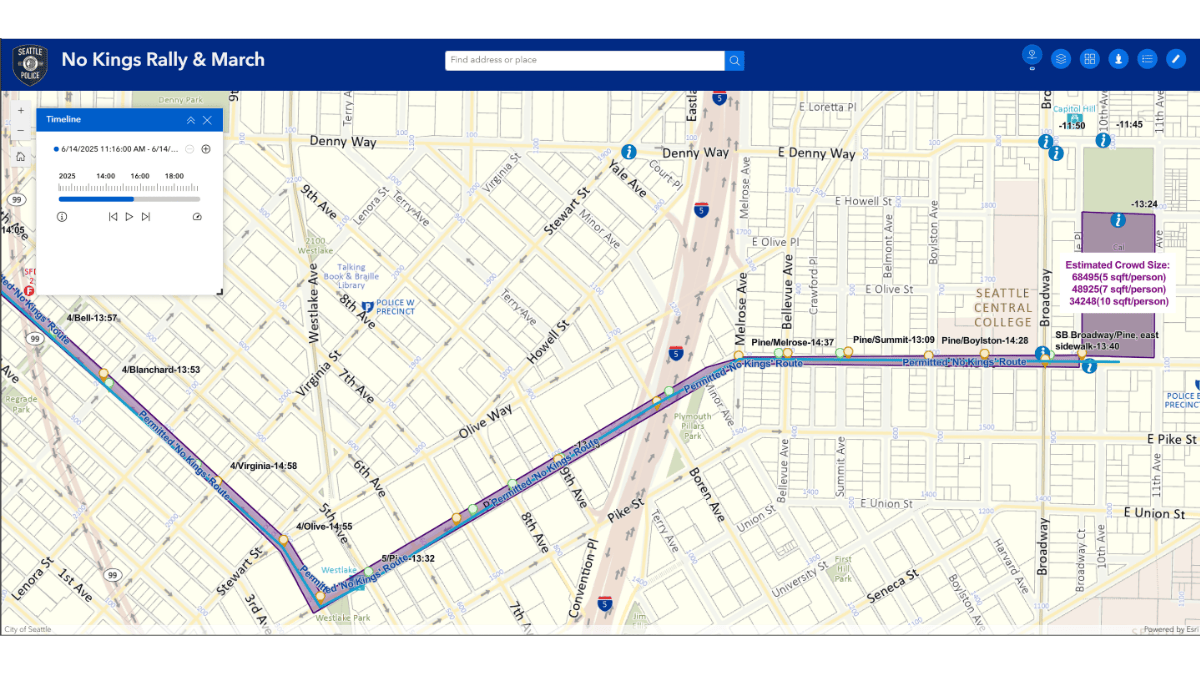
During events, the system transforms into a situational awareness tool. When crowds began flowing from Cal Anderson Park to downtown during recent protests, Rita Lee used GIS tools to map the parade route in real time, including the crowd size estimation tool that Saunders built to interactively calculate the number of people. News reports later confirmed approximately 70,000 attendees, validating the system’s accuracy.
Commanders can view live 911 calls, vehicle locations, available traffic camera feeds, and event-specific incidents. This real-time intelligence recently helped when the city faced questions about staffing decisions during a complex multi-event day. Within hours, the GIS team produced visual documentation showing exactly which intersections were covered and when, transforming a call for accountability into a data-driven justification that made sense. The where and why questions were answered by the GIS maps.
The system makes a record of every decision, timeline, and resource used. It creates an authoritative operational record that ensures safe events and promotes transparency. It also helps special events staff plan the next event, knowing what worked and where there were gaps.

The stakes are particularly high for World Cup 2026 events, given the documented history of crowd management challenges at international soccer tournaments. Unlike typical American sporting events, international soccer can involve organized supporter groups with histories of confrontation and property damage. Security planning must account for the potential of coordinated violence between rival fan bases, a pattern that has occurred at previous World Cup events globally.
The cities of Vancouver, British Columbia; Seattle, Washington; and Santa Clara, California; plan on sharing information about matches on the West Coast to help keep all fans safe for the World Cup.
“The three of us are in very close talks of trying to figure out how we can solve logistical problems,” Pablo Lee said. “If we’re going to get the next match with the team that played in Vancouver or Santa Clara, then we’ll know what we can expect from the fans.”
With Seattle hosting six matches over three weeks, an estimated 750,000 people will visit the city, requiring comprehensive deployment of the event team’s systems. The operational complexity exceeds any previous sporting event or concert the city has managed. Pablo Lee notes particular concerns about elimination matches, where disappointed fans may be more likely to engage in destructive behavior when their teams are knocked out of competition.
Seattle’s GIS-enhanced approach offers a model for cities facing similar challenges. As Pablo Lee puts it, “I always knew we had an answer with GIS. It was just how to work it to our advantage.”
Vancouver Police Department has already requested demonstrations of Seattle’s system, while Santa Clara is also adopting a similar GIS-centric approach to event security.
Learn more about how real-time GIS and situational awareness guide special event safety.