September 24, 2019 |
January 27, 2020
During California’s recent dramatic drought—a crisis that persisted from 2011 to 2017—many agricultural operations in the state halted. This was not the case in the desert of the Coachella Valley.
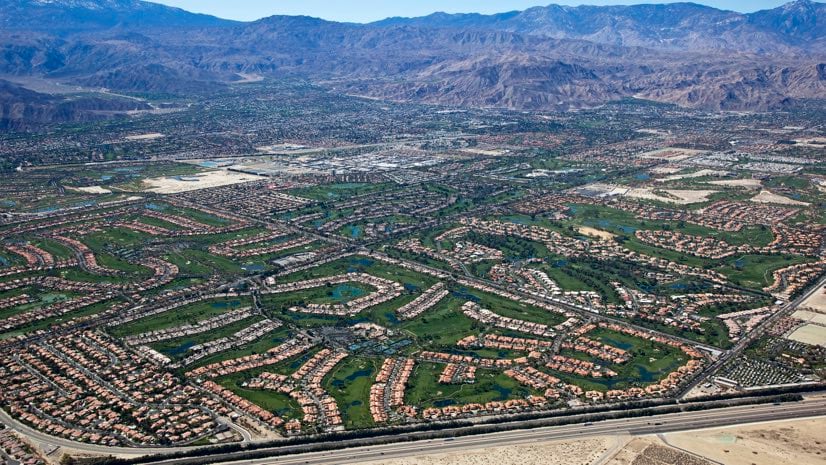
An enormous aquifer, hidden beneath the valley floor, has served as the desert’s main water source for centuries. Stretching 65 miles from the Whitewater River to the Salton Sea, the aquifer gets replenished by snow melt from the San Gorgonio Mountains and Colorado River water and supports an annual crop yield valued at $730 million.
The Coachella Valley is an area prone to low rainfall and high water demand—from agriculture and neighborhoods with golf courses and swimming pools—and its water resources must be carefully managed.
The Coachella Valley Water District (CVWD) manages the aquifer and the complex infrastructure that delivers drinking and irrigation water to 9 cities in the 1,000 square mile area. CVWD works in collaboration with other local water agencies to ensure that the aquifer is protected.
“The health of the aquifer, responsibly drawing the water and replenishing it is a top priority,” said Thomas Hasselbeck, GIS specialist at CVWD.
Hasselbeck and the teams at CVWD have started using high-resolution imagery, apps, and maps to protect the area’s water resource.

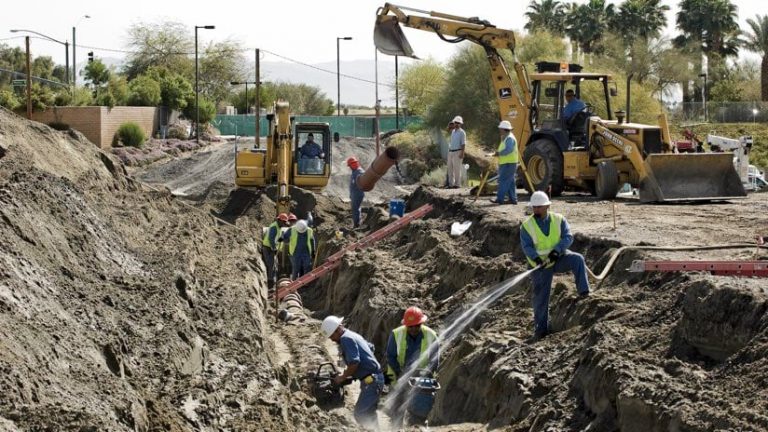
Before they can inspect or fix any water pipe, pump, valve, or hydrant, CVWD field crews and contractors have to be able to find it—not an easy task with desert sand, dust storms, and mountain terrain.
Crews are guided by smartphone apps that reveal key details on data-driven maps built using a geographic information system (GIS). The agency added high-resolution imagery, from Esri partner Nearmap, so their maps and apps have a horizontal accuracy of 10” (25.3 cm) and a spatial resolution of sub 3” (7.63 cm). Updates made in the field sync with the CVWD office to reduce errors and speed communication.
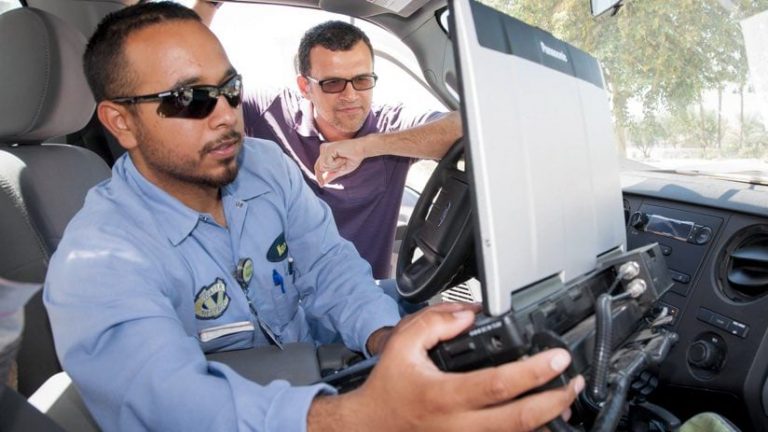
“If crews can see the asset but can’t walk directly up to it because it’s behind a fence or down at the bottom of a steep ravine, the high-resolution imagery still lets them collect the right point because they have an accurate location on their screen,” Hasselbeck said.
CVWD is currently working on a multi-year data collection project. Ultimately the team plans to create a digital twin of its water distribution network, a model that will help inform and prioritize maintenance. Already, the data and imagery is aiding inventory efforts once hampered by dust storms that bury assets under sand.
“Visibility in sandy conditions used to be a huge problem,” Hasselbeck said. “It was difficult to find valves if they got buried, but now we can locate them easily because we’ve collected locations in our GIS database.”
The Coachella Valley is home to many resort communities with 121 golf courses—the highest concentration in the nation—that place a high demand on water.
“We work closely with the golf course community to ensure they are working toward improving their water efficiency,” Hasselbeck said.
CVWD developed a recycled water system for golf course irrigation that reduces the cost and energy required for water treatment and shifts courses from direct well withdrawal. This approach mixes recycled non-potable water with Colorado River water, tailoring the mix for each course.
To reduce water use, CVWD offers cash rebates to encourage customers to remove grass and replace it with desert landscaping that doesn’t require as much irrigation. Imagery plays a role in both of these programs.
“We have a team that goes out to every customer who expresses an interest in turf conversion rebates,” Hasselbeck said. “The customer shows them the general area they want to convert, and the team member comes back into the office to view the imagery, measure and map the area, and calculate the rebate based on the square footage.”
Homeowners or golf course operators can use these maps and calculations to help carry out the replacement. Regular refreshes of imagery help CVWD staff audit and monitor turf conversion to ensure it remains desert scape.
All of CVWD’s 110,000 domestic customers are billed based on budget based tiered rates. A key integer in the budget equation comes from GIS. Each property is individually mapped and the amount of landscaped area is used to compute that customer’s budget each month.
“Our entire billing system relies on the accuracy of the measurements we take,” Hasselbeck said. “The use of GIS software makes budget based billing possible.”
Imagery also gives critical input to the crop census and agricultural activity assessment CVWD carries out three times a year.
“The imagery is good enough that our crop expert can see what kinds of crops each farmer is growing,” Hasselbeck said. “I couldn’t tell the difference between a head of lettuce or a strawberry plant, but our expert can, and the imagery saves him a lot of time and a lot of driving.”
When a vote of the citizens created the CVWD in 1918, the primary objective was protecting the aquifer. One of the first actions of CVWD leaders was to claim water from the Whitewater River, the valley’s only natural water source. In 1931, the agency secured rights to Colorado River water.
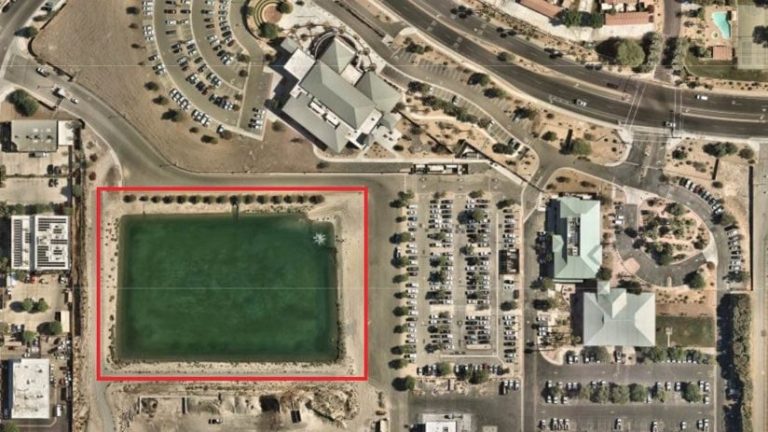
They also established large replenishment ponds at the west and east end of the Coachella valley. The first ponds were created in 1930 in an area called Windy Point. The second facility, named Thomas E. Levy after a former CVWD general manager, was completed in 2009 and is located in the town of La Quinta. A third facility, opened in 2019, is in the middle of the valley.
At the ponds, porous soils and routine pumping keep water flowing back underground to help balance what’s taken out.
The goal is to balance withdrawal and renewal to sustain this resource for the long term.
“During the drought, we created a three-dimensional terrain model and animated the water levels per year going back to 1960,” Hasselbeck said. “That gave us a clear picture of the health of the aquifer through the years. Now, we have a number of computer systems and sensors that help monitor withdrawal and replenishment, and the aquifer is in a much healthier state.”
Learn more about how water utilities use GIS.

September 24, 2019 |

September 19, 2019 |

February 1, 2019 |