March 3, 2026 |
Ryan Lanclos | Resilience
March 10, 2026
Jackson Hole Mountain Resort has recorded every significant avalanche since the early 1970s. For decades, this meant boxes of handwritten paperwork—notebooks filled by forecasters who understood that what happened on the mountain would matter to future ski patrollers trying to predict daily dangers.
“The culture here has always been about meticulous recordkeeping,” said Mike Rheam, who leads avalanche hazard reduction for Jackson Hole Ski Patrol and forecasts for the Bridger-Teton Avalanche Center. “Somebody might want to do a research project on something we haven’t even thought of yet. The records have to be there.”
More than 17,000 of those slides can now be explored in 3D on a map.
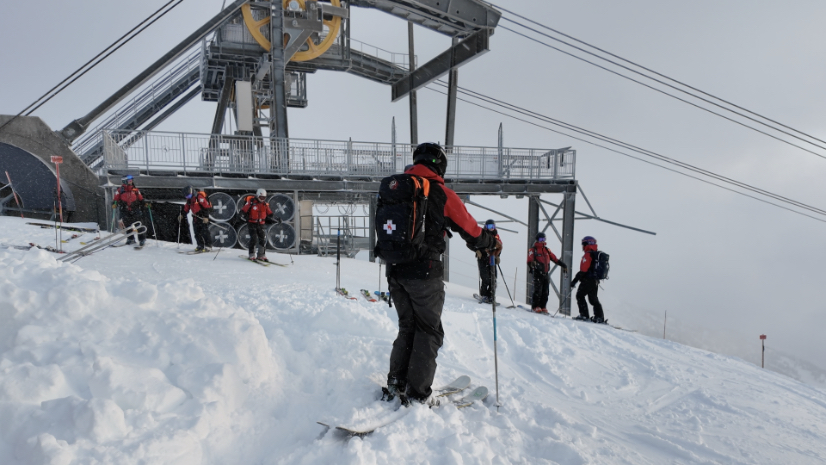
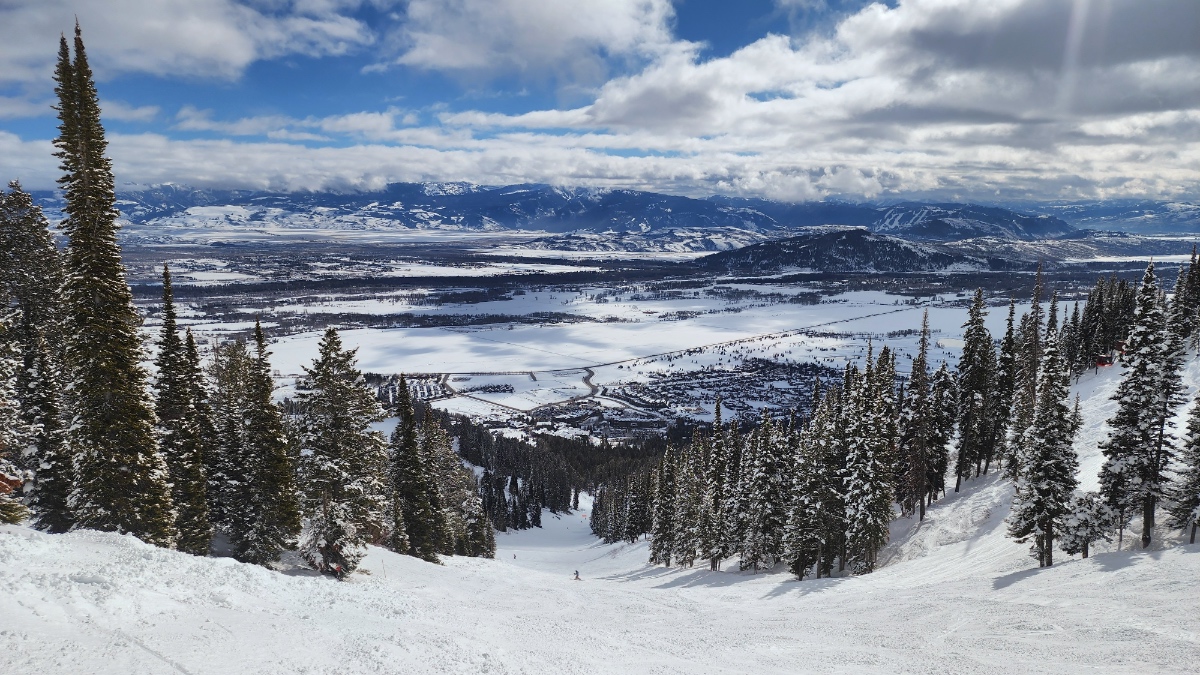
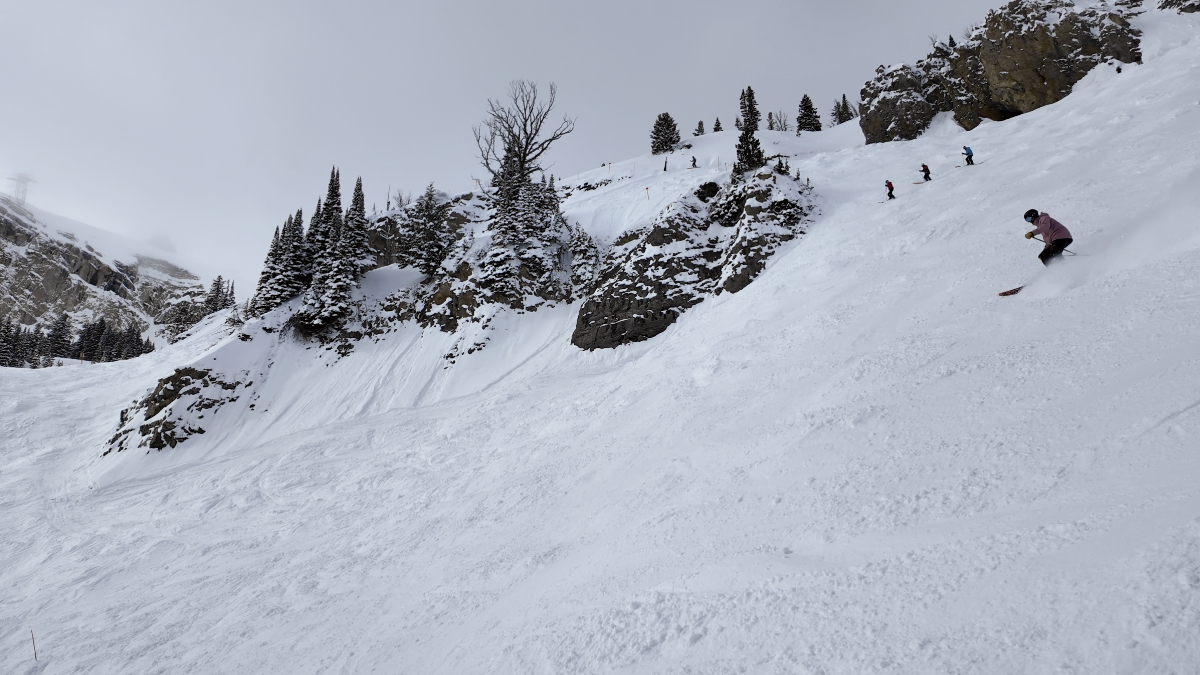
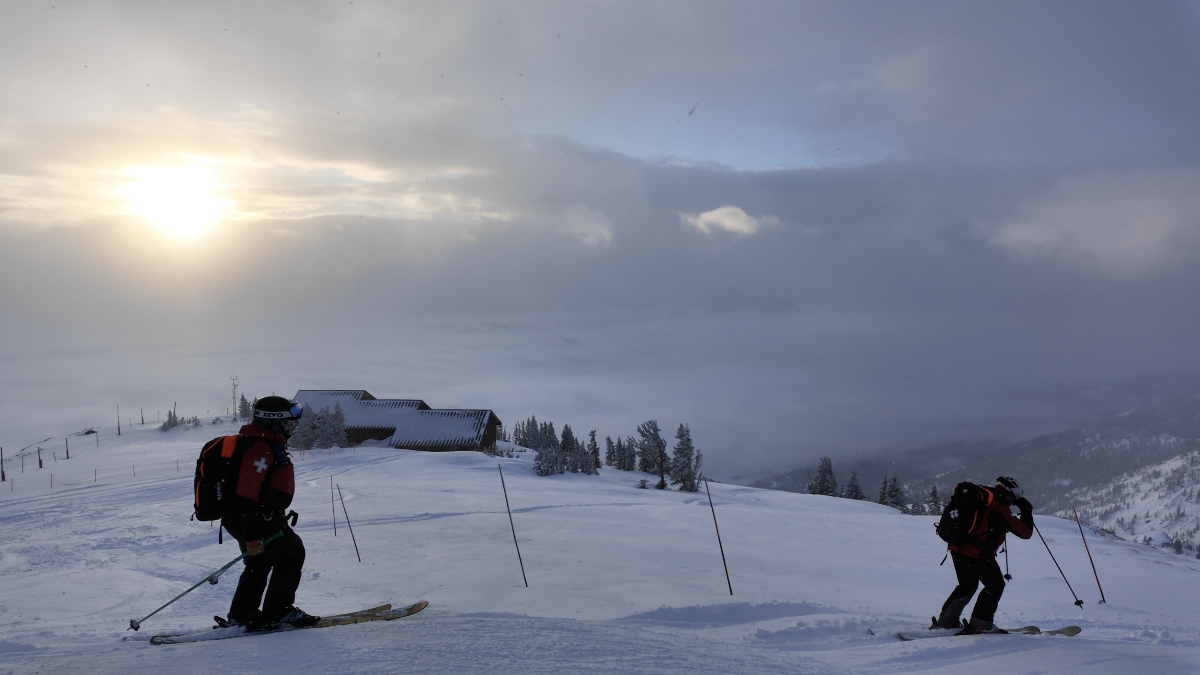
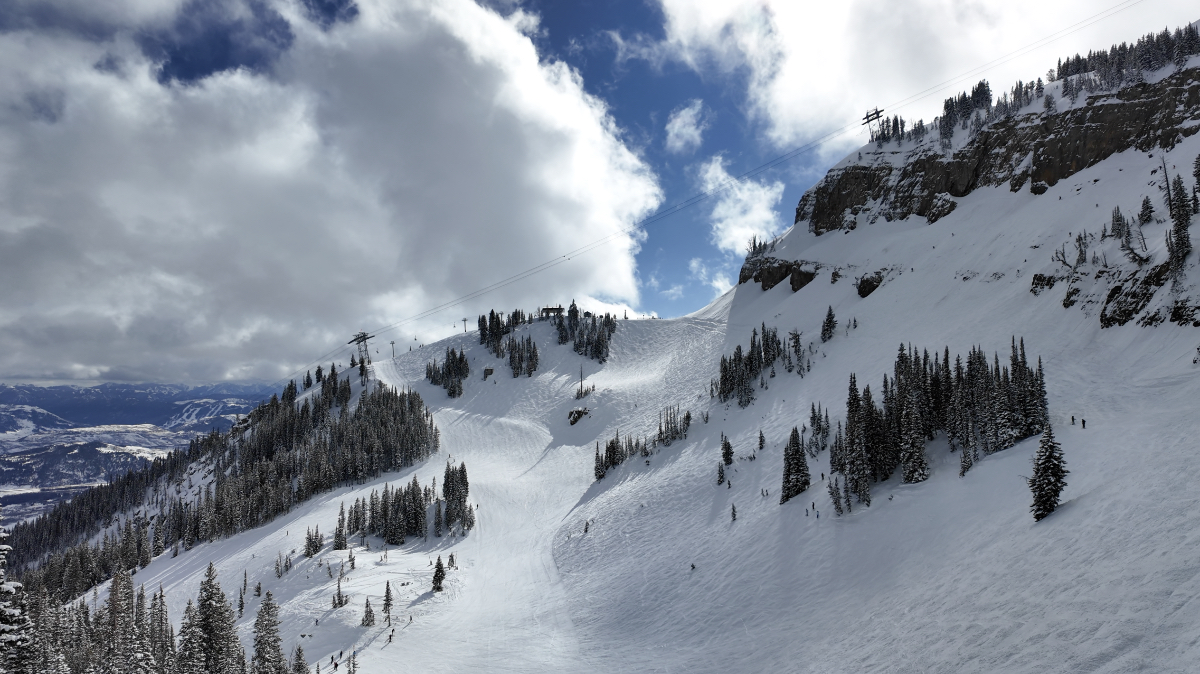
The terrain demands it. Jackson Hole covers 2,500 acres with a vertical drop of 4,139 feet and has received more than 240 inches of snow at the summit this season—more than double Colorado resorts like Telluride and Vail with similar expert terrain. Corbet’s Couloir drops 20 feet into a steep chute. From the Bridger Gondola, a steady line of skiers hikes towards the Headwall cliffs. Before each patroller heads out to prepare the mountain, the dispatcher tests their avalanche beacon: Is it beeping? Then they go to work.
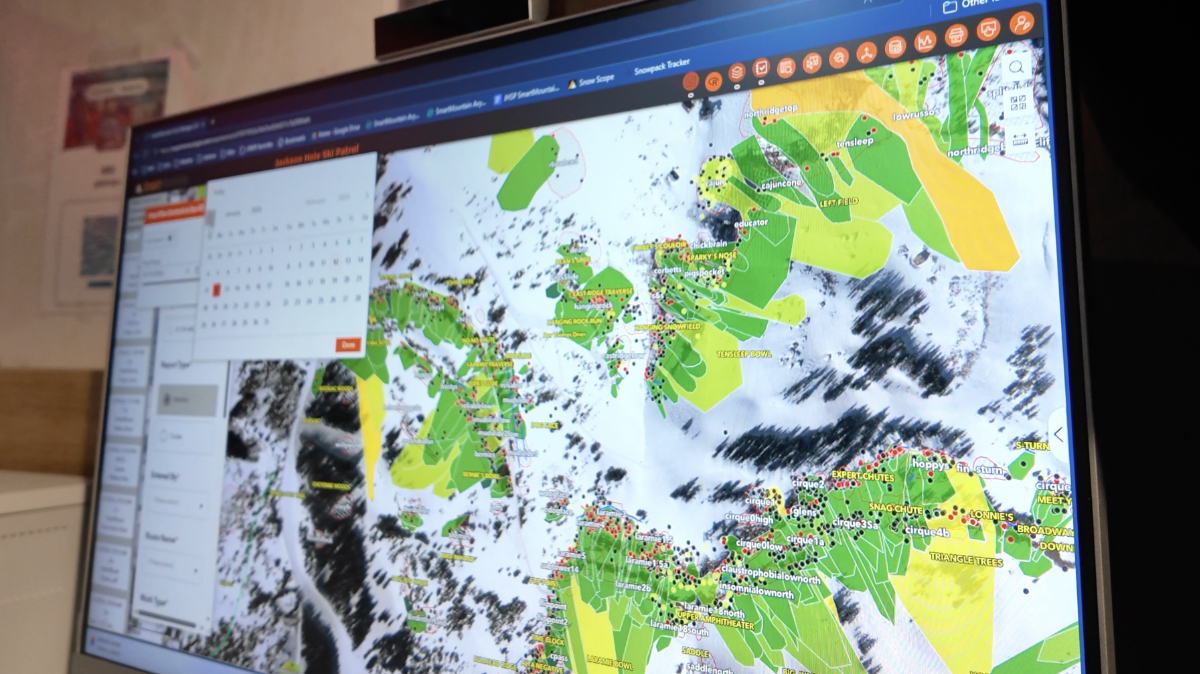
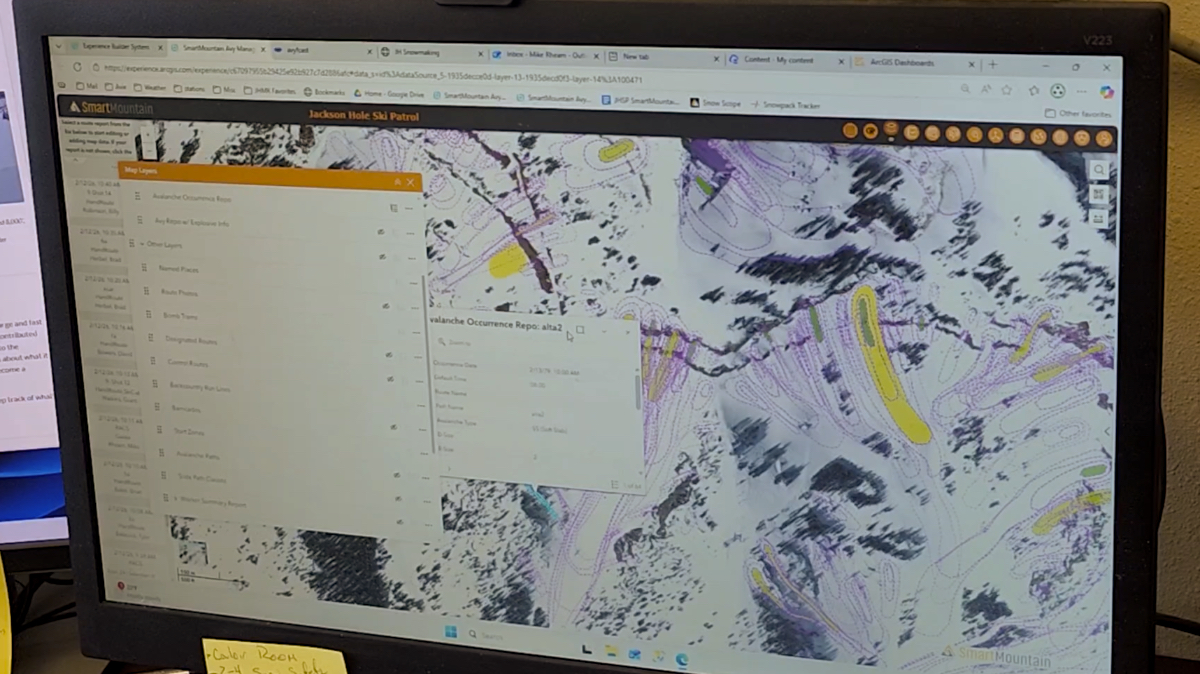
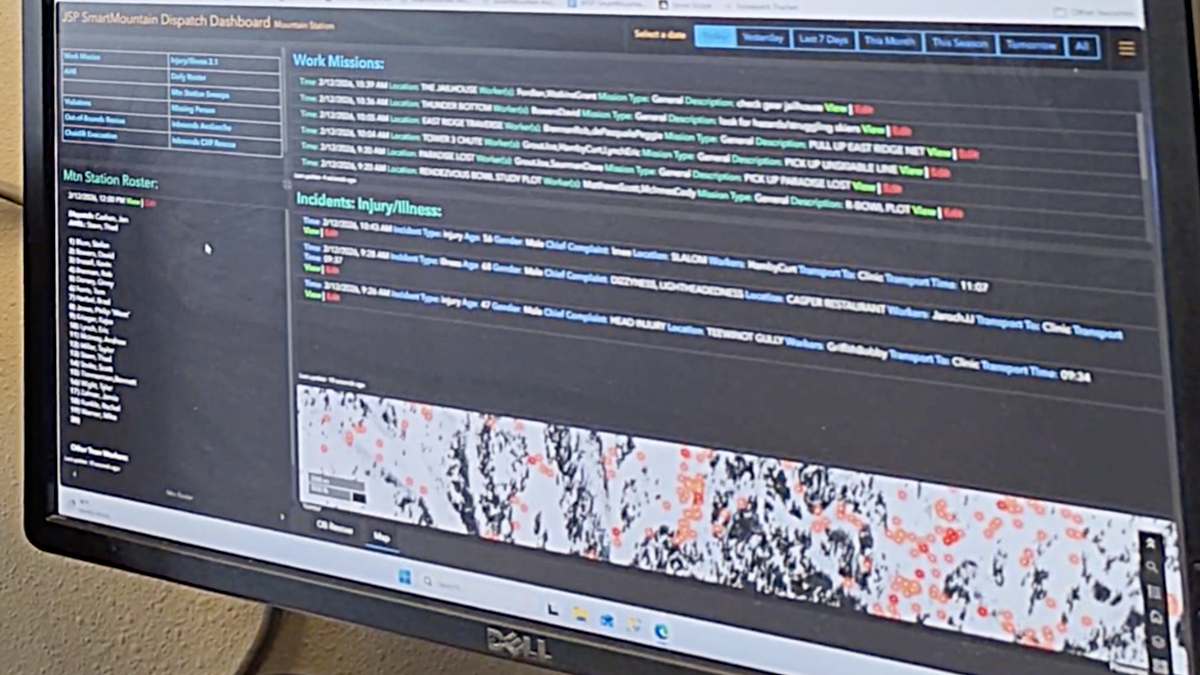
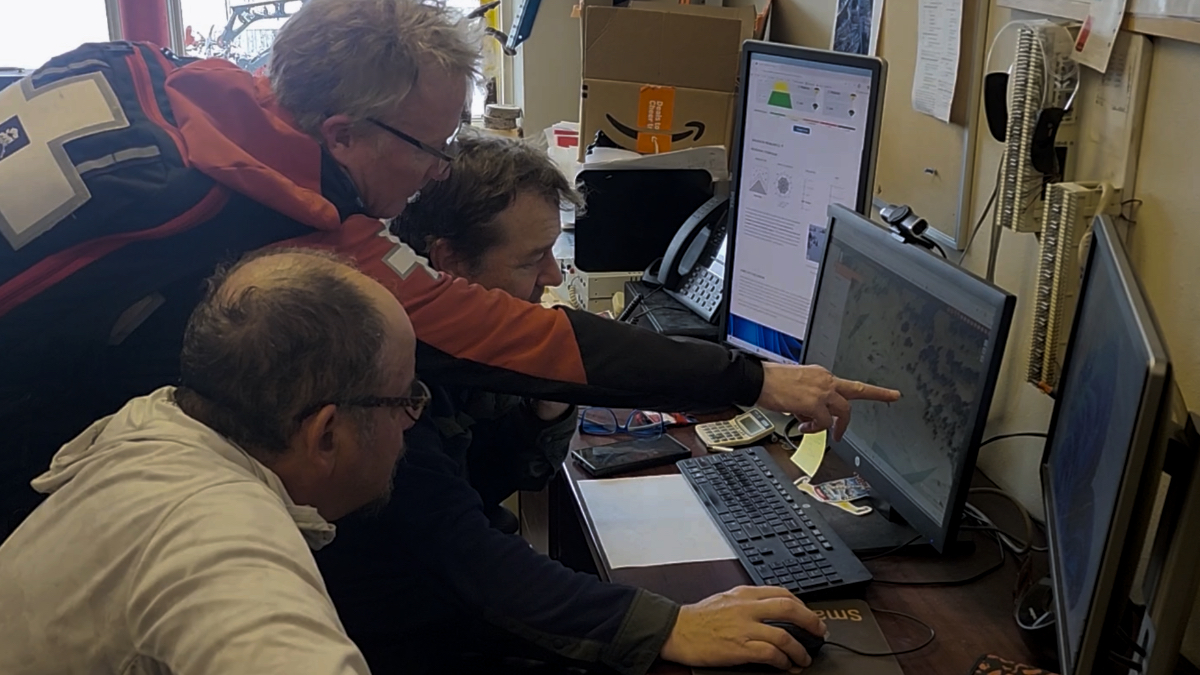
That work is now tracked in SmartMountain, a suite of geographic information system (GIS) applications. What began as avalanche risk mitigation now also manages ski patrol dispatch, missing persons, and injury response. The paper is gone. The map is the operating record—every condition observed, every action taken, documented with coordinates and time stamps that can be queried long after the snow melts.
On February 12, patroller Scott Matthews read conditions aloud to the crew. The previous day brought the largest 24-hour snowfall of the season—the first significant storm after 30 dry days. Southwest winds were gusting nearly 40 miles per hour. Slabs up to two feet expected in unskied areas. This was an avalanche mitigation day.
It was also the last day of preparations before the Kings & Queens of Corbet’s competition—an annual event where spectators gather in Tensleep Bowl, accessible only through expert terrain. That Valentine’s Day weekend, patrollers prepared the area so a crowd could safely watch the best freeride skiers in the world drop in. A couple—Tristen “Pants” Lilly and Piper Kunst—fittingly were crowned.
The snow and the terrain make the contest possible. The Teton Range rises abruptly from the valley floor with no foothills to slow incoming weather. Pacific storms hit the range head-on, forcing moist air upward—a process called orographic lift–dropping it as snow. The summit regularly exceeds 400 inches in a full season. The same geography that creates steep terrain keeps it loaded.
This season’s snowpack tells a layered story. Warm temperatures through November and December brought rain to high elevations, forming a dense ice crust. Big avalanches followed. A subsequent storm arrived warm and gradually cooled. “We had good bonding of the new snow, so we kind of put that ice layer to bed,” said Kevin Brazell, an avalanche hazard reduction specialist. “It’s down in the pack and we’re not too worried about it. It will probably reawaken in the spring.”
Deeper, faceted layers—sugary, cohesionless snow formed during dry spells—remain the persistent concern. When enough mass builds on top, it can collapse. “You can’t really be a good avalanche forecaster if you don’t have your head in it all the time,” Rheam said. “The only way to have that knowledge is to be thinking about it from the first snowflake in the fall.”
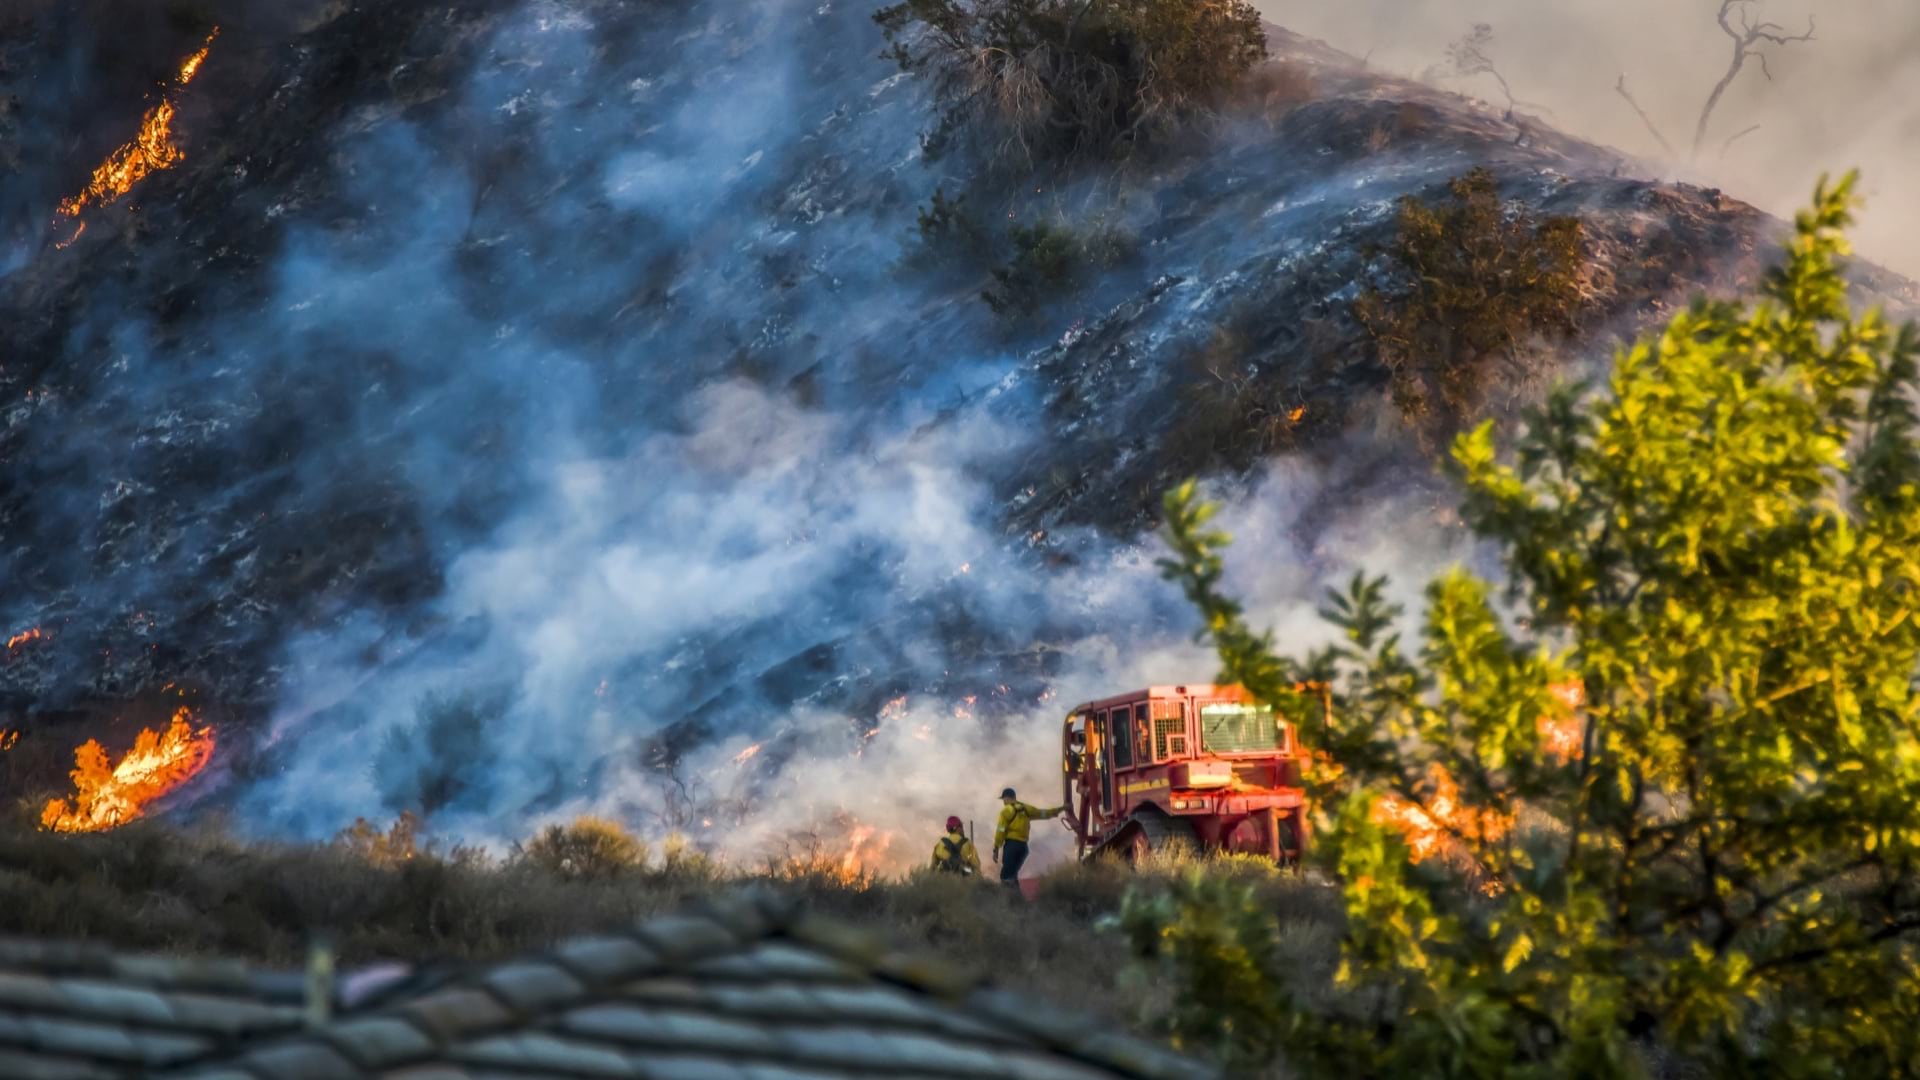
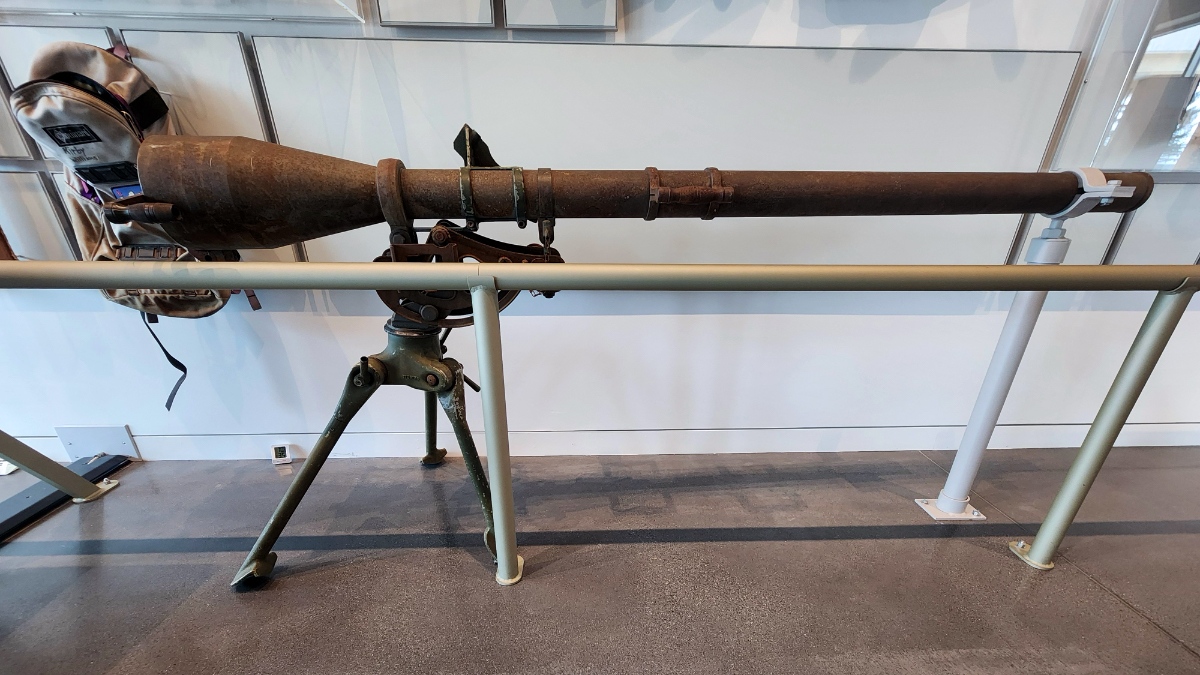
Before patrollers head out, Brazell sits at a console operating remote exploders—automated systems that deliver charges ranging from 10 to 35 pounds onto avalanche-prone slopes. “Nobody is out there right now, and I’m able to mitigate the slope from here,” he said. Automation replaced the artillery the resort used for decades, until expansion eliminated the lines of fire. “We lost targets,” Brazell said. “Too many new buildings and lifts in the way.”
Explosives are prepped in the staging room, loaded onto the tram car, and deployed from designated positions. Forty patrollers head out in teams of two. Some charges are thrown by hand from clifftops along routes mapped as layers in the system.
After mitigation, every patroller logs what happened. Rheam called it the “100 workers, 100 ways” problem—some patrollers are technical, others less so. The form has to work for all of them. Each patroller selects their route, marks explosive placements on the map, and if an avalanche resulted, draws the extent of the slide–how deep it broke, how far it ran. The system calculates vertical fall and slab width from terrain data.
That link between charge and consequence is the system’s core value. On the map, color-coded dots tell the day’s story: red means the explosive triggered an avalanche; black means it didn’t; yellow means weather obscured the result. “We can use this tool to look at a period of time in a storm cycle and make sure we’re getting the activity we expect,” Rheam said, pointing to the large path—the biggest slide at the resort this season, triggered by a snowcat working above it.
At day’s end, forecasters review every entry, verify sizes, correct mistakes, and push cleaned data to a permanent repository. Significant events get flagged for training or investigation. The system also serves patrollers on days off—pull up the avalanche outlines, understand what you missed before stepping back into it.
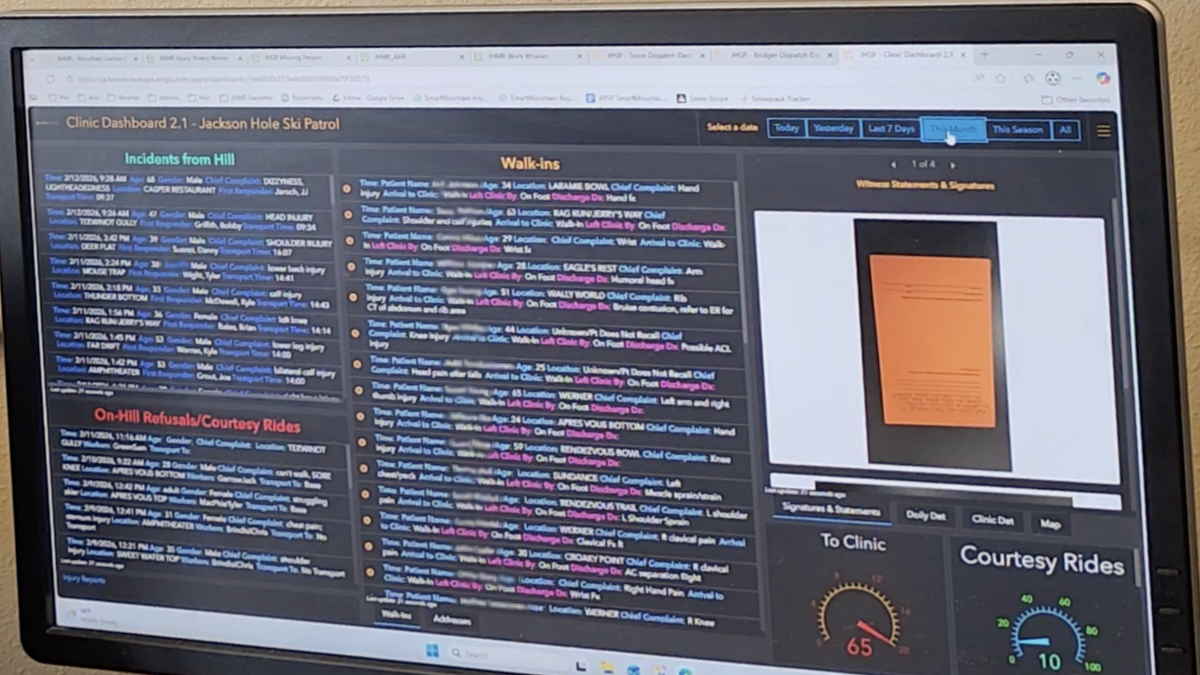
SmartMountain covers end-to-end patrol operations. When someone is injured, the process starts with rough information over the radio—approximate age, location, complaint. A pin goes on the map. The nearest patroller arrives and updates the form. If care is accepted, the form follows the patient from slope to clinic, where staff add identification, vitals, drug administration records with signatures at every level, and a narrative of what happened. The same system tracks rope-line violations with photos and repeat-offender histories, out-of-bounds incidents, and missing persons—down to jacket color and last known contact with family.
All this data stays internal. But with avalanche records, Jackson Hole takes an unusual approach.
The resort merges avalanche activity with the Bridger-Teton Avalanche Center’s database, making resort explosive results visible to the public. “Everything’s transparent here,” said Rheam. “We do our best to mitigate the avalanche hazard. We can’t reduce it 100 percent. So we’re letting the public know the hazards exist.” The partnership dates to the 1970s, when two young men died on Jackson Peak and the community recognized the need for backcountry forecasting.
The transparency has practical value. Backcountry travelers use the resort’s explosive results to calibrate their own risk. When a 35-pound charge triggers a significant slide on a slope that’s been mitigated all season, it says something about what’s waiting on slopes that haven’t been touched.
The database that started with handwritten observations in the 1970s now tracks a lost child’s jacket color and links a charge detonated at dawn to the avalanche it produced. Fifty years of institutional memory, mapped and searchable, used every day by the people responsible for safety on one of North America’s most demanding mountains.
Learn more about the GIS components that combine to deliver operational intelligence.