We built relationships early on, and people know to come to us for support now. Going through a derecho and COVID-19 has really helped illustrate the power of GIS and what we can do.
Epidemiologist, Linn County Public Health
Amy Hockett
When the COVID-19 pandemic hit, epidemiologist Amy Hockett knew early on that what she was witnessing would trigger unparalleled needs for her county in Iowa.
Linn County, home to Cedar Rapids, is the state’s second most populous county, with more than 225,000 residents. By early March the mounting number of hospitalized victims in the county due to the pandemic had already stretched medical resources.
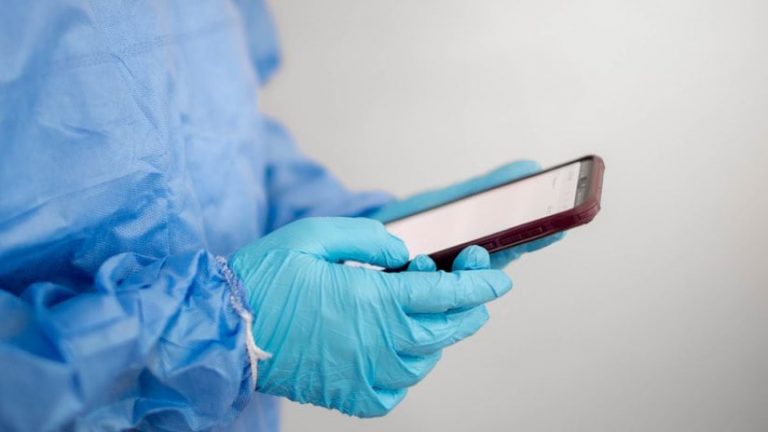
More alarming, the region’s first responders were falling ill, depleting the main core of those fighting COVID-19 at a time when they were needed most.
As the pandemic shut down schools and businesses, many people needed help securing food and shelter. The problems were compounded as local meat-packing plants slowed or closed and employees—including many recent immigrants—found themselves without a livelihood and with limited knowledge about where to turn for help. Anxious parents, teachers, and community leaders sought clear, concise, and authoritative information.
That’s when Hockett decided she had to act. Hockett realized the crisis could devastate her community. In her eyes, what the community needed was someone to successfully assemble all the relevant data to help leaders coordinate their responses and provide resources where they were needed most.
Although she did not have extensive training in geographic information system (GIS) technology or the location intelligence derived from geographic analysis, Hockett understood that it would be an extremely useful tool for compiling, analyzing, and visualizing data and trends and communicating that insight in ways everyone could understand. She also believed that, given the depth of the crisis, she had to expand her sense of what an epidemiologist could do in a moment like this.
“I never thought I’d be part of the emergency response,” Hockett said. “In my everyday work, I’m at my desk, and I get to look at data. But that human aspect is always really important to me—being able to help anybody in any way that I can.”
To get community members that data they needed, Hockett decided to create a COVID-19 dashboard. At first, the goal was just to deliver basic information out to members of the public, so they could visualize the spread and assess the risks. “How many cases do we have today? Who is being impacted? That was our very early goal,” Hockett said.
We built relationships early on, and people know to come to us for support now. Going through a derecho and COVID-19 has really helped illustrate the power of GIS and what we can do.
Her work was inspired by the work of people from Johns Hopkins University, who had then started compiling national and international statistics on the spread, incidence, hospitalizations, and deaths related to COVID-19.
Similar to the Johns Hopkins’s effort, the Linn County dashboard was to be publicly available, easy to understand, and with data streaming in near real time.
“Our real goal was to give information to our public and partners,” Hockett said. “So, one of the things we wanted was to be able to paint the local picture, the state picture, the national picture, and the international picture and make it accessible.”
No one had ever attempted such an effort on a county level in the state of Iowa before.
The publicly accessible data collected eventually ran the gamut from simple spatial statistics to analysis of vulnerable people and rates of infection across space and time. Hockett and her team used GIS to layer data about food resources, ethnic groups and languages spoken across the county, homes where electrical outages could stop lifesaving medical machinery, and more.
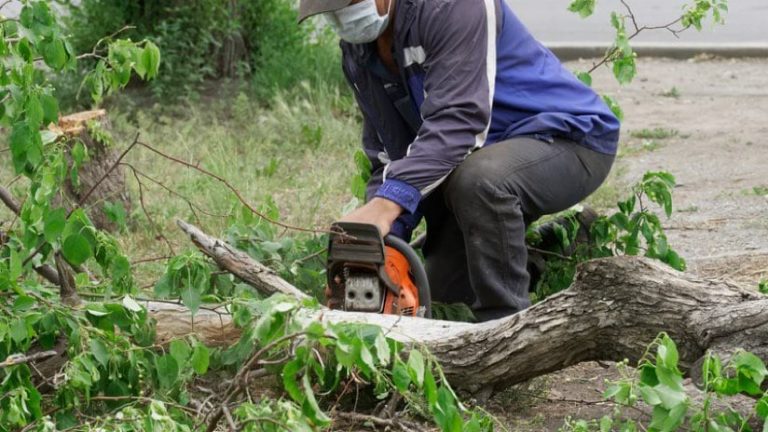
That work has added immensely to the county’s resiliency—and not just for COVID-19. In August, the data-rich maps also supported local responders in the aftermath of a derecho storm with hurricane-force winds that caused widespread destruction.
“All of our trees went down here, and it was terrible,” Hockett said. “We have a great community here in Iowa, everybody wants to help each other, and that meant a lot of unmasking and a lot of close contact as everybody was cutting trees, removing debris, even helping people get out of their homes who were trapped by falling limbs.”
Hockett’s work to create user-friendly dashboards—which could keep up-to-the-minute tallies on vital indicators, engender public trust, and enable the public and first responders to grasp the reality of what they were facing with COVID-19—earned her national honors from the Washington, DC-based American Public Health Association. She graciously deflects individual praise for the 2020 Innovation in Public Health Award that is in her name.
Instead, she recognizes the many public officials, agency leaders, and location intelligence specialists who provided data and helped her create the charts and dashboards that provided critical information. And she praises the quick adoption of digital and interactive smart maps to guide actions, including rallying resources to areas with the most pressing needs.
Hockett also can’t help but call attention to the cooperation and partnership evident throughout the county. “We’ve cultivated a lot of different relationships over time,” she said. “But I think this made it more clear to our community partners that we needed to work in a more efficient manner. We really needed to be able to share.”
In giving her the award, the judges said Hockett’s work helped community partners collaborate to ensure basic needs were met. And, they noted, “without the development of these innovative technologies and techniques, the response by Linn County Public Health would not have been as robust as it was.”
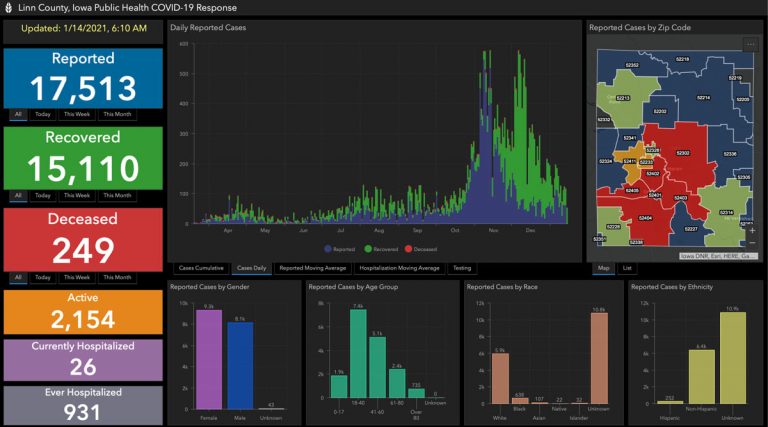
Creating a hub for COVID-19 metrics with analyses down to ZIP code level required long days of work and cooperation with many departments, agencies, hospitals, and long-term care facilities. It also required a strong commitment to continually refine and simplify data presentation after receiving questions and feedback from the public. All of this was carried out under stressful conditions while new challenges were constantly presenting themselves. A shared understanding of the situation, delivered by the dashboard, allowed many in the community to feel they were on the same team and striving toward the same goals.
“We actually had a lot of different audiences that we had to consider,” Hockett said. “We needed to be able to see emerging information, our hospital capacity, the trajectory of the disease, who the population was. All of that needed to be immediately accessible.”
“In the beginning, we wanted to just make the case for information,” she said. “But we had early difficulty with an inconsistency in our state-level data and our local data. So, our public really didn’t have a lot of trust. That was where we wanted to step in and say, ‘No, we want you to have the best information possible and in a way that you really can understand.'”
Her two main tools for collecting all the information and displaying it on smart maps were ArcGIS Survey123, an app that allows agencies to input data daily, and ArcGIS Dashboards, a web app that can help organizations collate and monitor trends.
As Hockett updated her knowledge of GIS technology, she turned to a colleague, Sunshine McDonald, who works for the nearby Marion Police Department and has experience processing enormous amounts of data and then plotting the results on maps.
With advice and help from McDonald, Hockett was able to layer many categories of data so residents in need of food aid could simply enter their addresses on the map to find nearby public agencies and private charities. Many of Linn County’s newest residents come from cultures with restrictive diets for religious or cultural reasons, so mapping their location and needs helped avoid food waste and ensure appropriate supplies.
The use of dashboards and maps prompted others to suggest adding new layers of data—and made Hockett and other officials aware of still more unmet needs. This was especially crucial when the windstorm hit.
“Due to the derecho, we didn’t have electricity for almost a month,” Hockett said. “And we had a lot of people whose electricity was crucial for at-home medical equipment.”
Once the vulnerable people were identified and mapped, first responders checked on them. That required help from power companies, medical groups, and the public at large. And it involved connecting a lot of data, which was no easy task. But it was a necessary task, and that’s all the motivation Hockett needed.
“We built relationships early on, and people know to come to us for support now. Going through a derecho and COVID-19 has really helped illustrate the power of GIS and what we can do.”
It also illustrates her abiding passion: helping people any way she can.


October 9, 2020 |

April 7, 2020 | Multiple Authors |

December 14, 2020 |