December 13, 2017 |
March 21, 2018
On March 8, 2014, Malaysia Airlines Flight MH370, a commercial jetliner on its way from Malaysia to China with 239 people on board, strayed from its flight path and disappeared from air traffic control radar. Analysis of satellite data revealed that MH370 had flown for over six hours after contact was lost and likely crashed along a narrow arc of the southern Indian Ocean. The loss of MH370 remains one of the highest-profile catastrophes of modern commercial aviation, and four years later, despite one of the most expensive searches ever undertaken, MH370 still remains missing.
The difficulty in finding MH370 can be blamed in part on geology. The rugged topography of the Indian Ocean floor could potentially obscure the debris field, making undersea mapping an important part of the investigation. Despite the failed search effort, the monumental deep-sea mission produced the most detailed underwater map ever created.
A joint communique from the transport ministers of Malaysia, Australia, and China included the following statement upon the conclusion of the search:
“Despite every effort using the best science available, cutting-edge technology, as well as modelling and advice from highly skilled professionals who are the best in their field, unfortunately, the search has not been able to locate the aircraft. Accordingly, the underwater search for MH370 has been suspended. The decision to suspend the underwater search has not been taken lightly nor without sadness.”
Charting Uncharted Waters
In March of 2014, Australia led the search operation at the request of the Malaysian government. After a two-month aerial search of the surface that found no trace of MH370, the Australian Transport Safety Bureau (ATSB) began an underwater search that would use sonar, submersible vehicles, and a location intelligence platform to visualize the data. Geoscience Australia, Australia’s public-sector geography authority, led the mapping effort, processing seafloor maps that helped the searchers visualize all data and adapt their strategies.
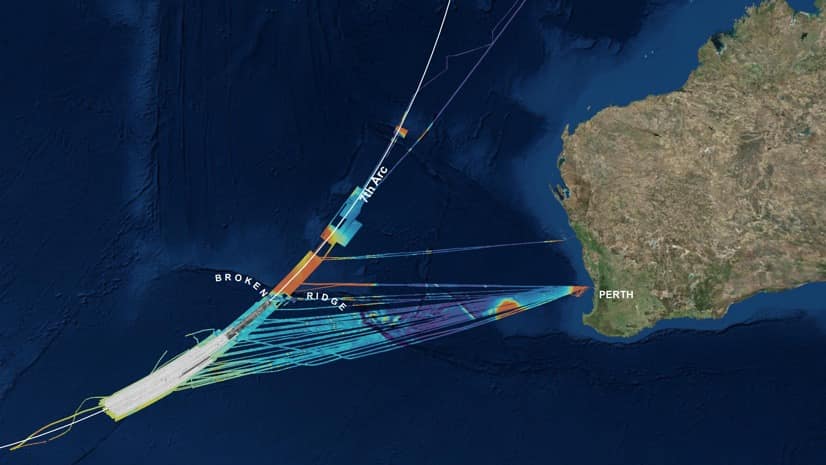
An analysis of radar data and metadata associated with subsequent satellite communications with the aircraft placed MH370 on a long arc within the Australian search-and-rescue zone. Investigators mostly agreed that the plane exhausted its fuel somewhere along that corridor. By analyzing satellite communication data, Geoscience Australia drew the search area on a map and updated it as the analysis was refined. The initial search area encompassed more than 450,000 square miles.
Existing ocean depth (bathymetry) data of the search area was not of sufficient resolution to guide the submersible vehicles that would travel close to the seafloor to take closer looks. The first phase of the search would consist of a high-resolution survey of the ocean bottom. The underwater search primarily employed sidescan and multibeam sonar equipment towed behind vessels to collect high-resolution images. The ships acquired data 24/7 as they traveled across the search area.

Flagging Potential Hiding Places
As the vessels moved across the search area, surveyors reviewed the sonar data in real time to flag any anomalies that could be an aircraft debris field. Onboard the ships, a geographic information system (GIS) functioned as a photographer’s “dark room,” allowing Geoscience Australia to develop pictures from the incoming data that would help searchers monitor sonar data quality as well as mission progress.
The resulting high-resolution maps would orient an autonomous underwater vehicle’s (AUV) more detailed searching. The AUV was used to explore the anomalous areas that warranted closer inspection with a camera and it was also used to search areas where there were gaps in the primary sonar coverage due to the seafloor terrain. Geoscience Australia mapped each gap that could potentially hide pieces of aircraft.
“Gaps will always exist where steep geology prevents soundwaves from reaching bottom,” said Megan McCabe, cartographer at Geoscience Australia. “The idea was to capture as much of those areas as possible and stitch the data captured by the AUV into the sonar coverage.”

Building an Underwater Highway
With gaps sparsely spread out over the entire search area, the challenge centered on the best way to search each gap. A makeshift underwater highway had to be created using the Esri mapping platform.
“We created a network analysis to see how we could move from gap to gap most efficiently by thinking about it like a delivery man’s dilemma,” McCabe said. “The goal was to prioritize anomalies to build a ‘road network’ between them that we could efficiently investigate.”
Once it had the network, Geoscience Australia could create the best routes to get from point A to point B. This method helped navigate the AUVs to the areas of highest priority. The search located four shipwrecks but found no aircraft wreckage.
The improved resolution of the mapping effort also led to the discovery of deep sea volcanoes, towering ridges, and deep trenches in a remote part of the southern Indian Ocean that was largely unexplored. Investigators discovered that the large mountain ridge within the arc was created by the collision of two tectonic plates. Sonar data revealed structures that soared more than 300 meters high in some places and trenches that plunged as deep as 1400 meters.
Adding Value to the Mission
The exhaustive search for MH370 also ranks as one of the largest marine surveys ever conducted thanks to the Fugro Survey team’s decision to always keep the multibeam sonar system on. The search collected 172,741 square miles of bathymetry data in the search area and another 268,432 square miles of data as the vessels travelled to and from the search area.
Three years’ worth of meticulous scanning and quality assurance review produced a highly detailed picture of the seafloor in the southern Indian Ocean. Geoscience Australia presented a story map to tell the story of their search. It includes interactive maps that recount the mission using embedded videos showing how the data was collected and what the new bathymetry looks like compared to previous seafloor maps in the area.
“This difficult search united teams across Geoscience Australia to rigorously apply science and technology to this important task,” McCabe said. “We’re all disappointed that we did not find the aircraft, and we’re hopeful that the survey work will eventually lead to its discovery to provide closure for the families of the missing passengers and crew.”
Although the mystery of the loss of the aircraft hasn’t been solved, the seafloor maps from the search will benefit scientific explorations of the southern Indian Ocean for years to come. Geoscience Australia published the first phase of data in 2017. The second phase of the data will be released later this year.
Learn how ocean scientists, resource managers, and conservationists use GIS to assess deep ocean features and guide sustainable ocean practices. Learn how smart mapping makes mapping easier and more impactful.


December 13, 2017 |
December 14, 2017 |
September 26, 2017 |